Week 9 - Parametric study on Gate valve.
The aim, Introduction, Theory
The objective of simulating above case is to obtain mass flow rates at the outlet of a gate valve with different levels of valve opening. It is important and necessary to find out what would be the pressure at the walls, what would be the mass flow rates so that it can be used in operational activities. Gate valves are absolute necessecity to any pipeline or piping flows. The whole world depends on the transportation of oil from one place to another. Simulating flow can not only increase efficiency but also check the quantity of volumes to be moved. Gate valves are devices which can be used to restrict fluid flow to one direction. Gate valves are used in many industrial and home uses. Gate valves are operated very simple, one can open a gate half to 1% or 100% depending upon the use and requirement.
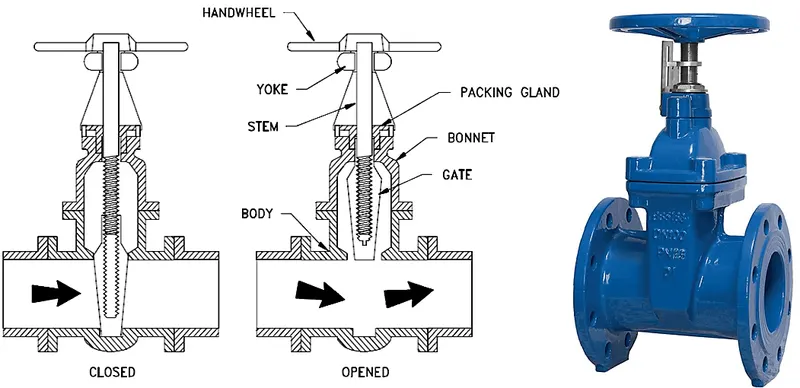
Fig.1- Gate valve
Gate valves are designed so that they can withstand high pressure. Gate valves are mostly made from cast-iron, carbon steel, red brass, stainless steel, alloys etc. Gate valves are so constructed that they have flanges at the end which can be bolted to designed torque. These kind of devices are made leak proof.
Solving & Modelling approach
While simulating flow through a gate valve we need to extract the fluid volume which is going to come into play. We start by extracting the fluid volume by using the extract volume tool. Before the volume is extracted we give the gate disc a rise of 10mm using the move option.
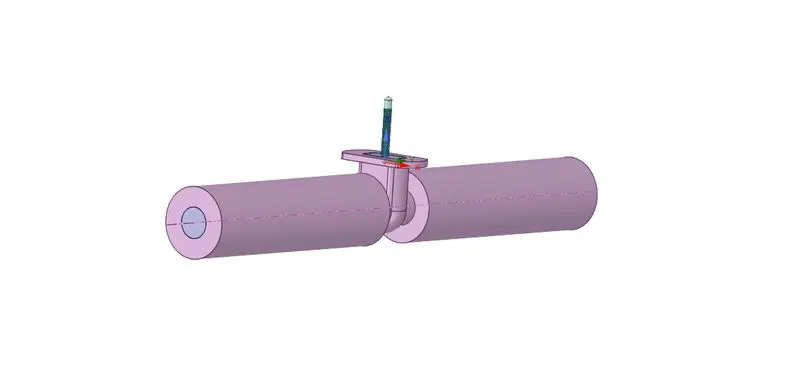
Fig.2- Geometry of gate valve with extended inlet and outlet
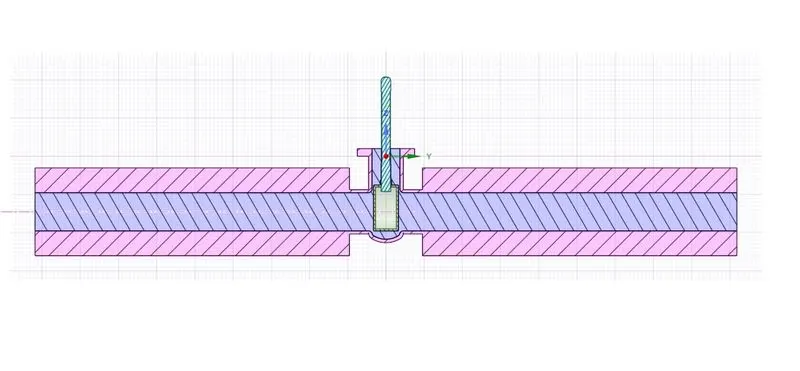
Fig.3- Section plane view of gate disc lifted by 10mm
Solving the above simulation includes mesh generated having element size as 25mm. The mesh is more concentrated at the gate disc component becasue we are simulating for mass flow rates from the gate disc.
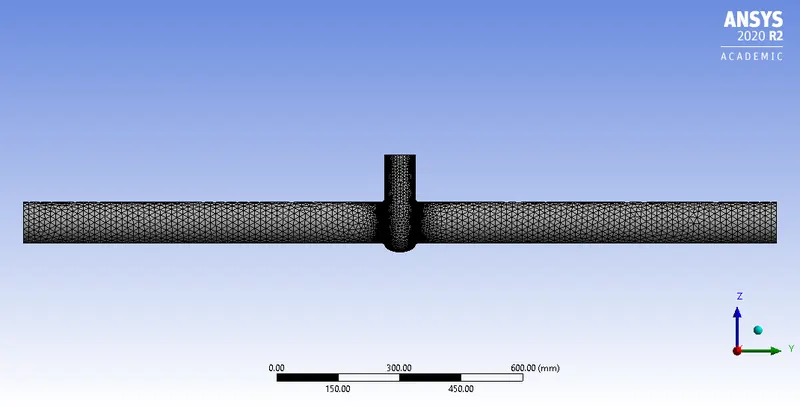
Fig.4- Mesh
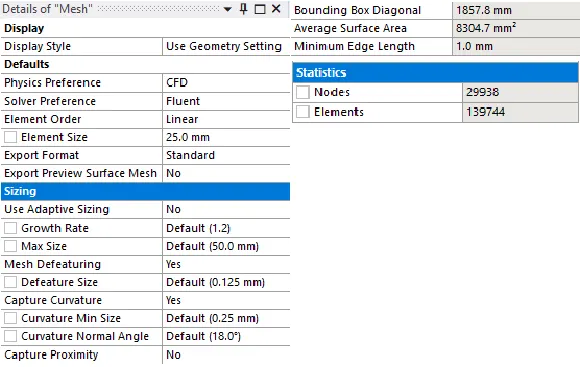
Fig.5- Mesh settings
Pre-processing and solver setting
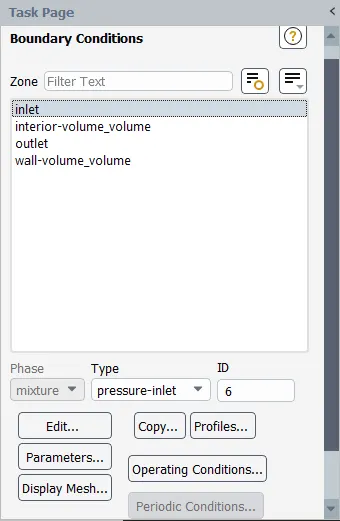
Fig.6- Inlet boundary
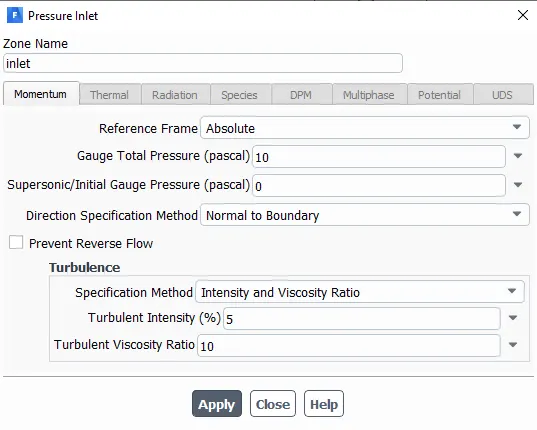
Fig.7- Inlet boundary condition
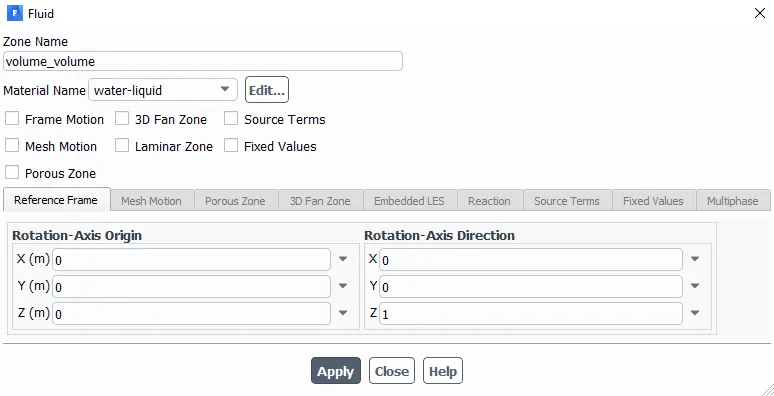
Fig.8- Cell zone conditions- Water
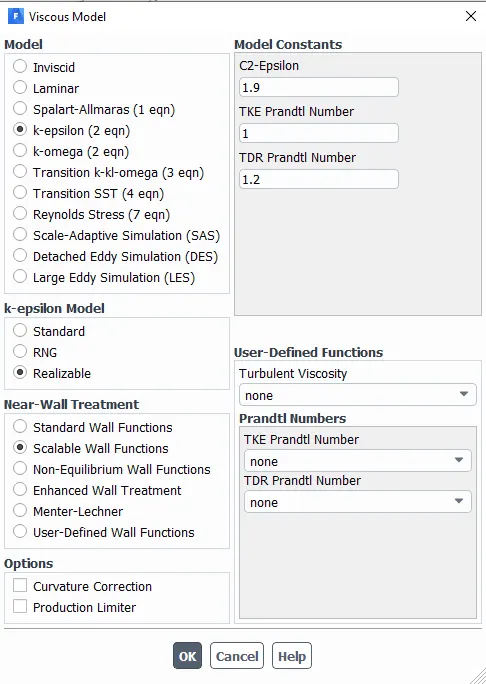
Fig.9- Viscous model
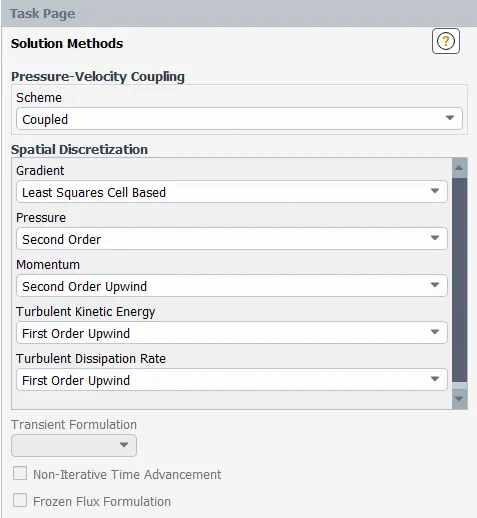
Fig.10- Solution method
Results
The solution was run for 250 iterations and converged before that. The mass flow rate is tabulated beloe for different levels of opeing of gate disc:
| Valve opening (mm) | Valve opening (%) | Mass flow rates |
| 10.8 | 10 | -0.15432964 |
| 16.2 | 20 | -0.19584378 |
| 21.6 | 30 | -0.2547762 |
| 27 | 40 | -0.30102846 |
| 32.4 | 50 | -0.38644602 |
| 37.8 | 60 | -0.45210354 |
| 42.2 | 70 | -0.43920806 |
| 47.6 | 80 | -0.54473329 |
Table.1- Values of mass floe rate from the outlet
Contours and plots:
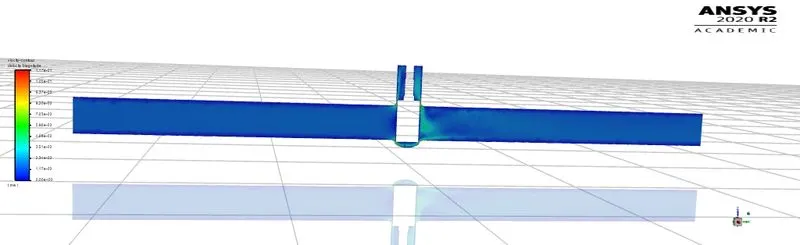
Fig.11- Velocity contour when valve opening is 10% i.e. 10.8mm
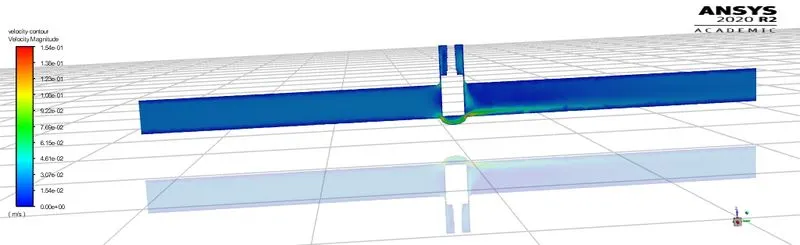
Fig.12- Velocity contour when valve opening is 20% i.e. 16.8mm
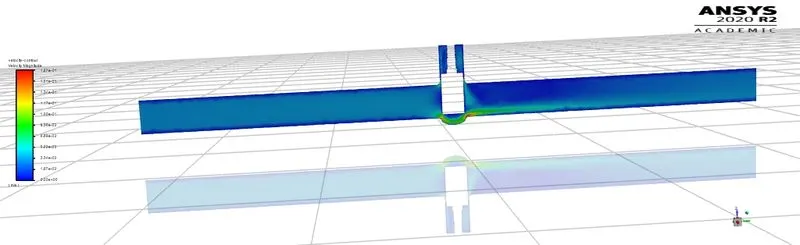
Fig.13- Velocity contour when valve opening is 30% i.e. 21.6 mm
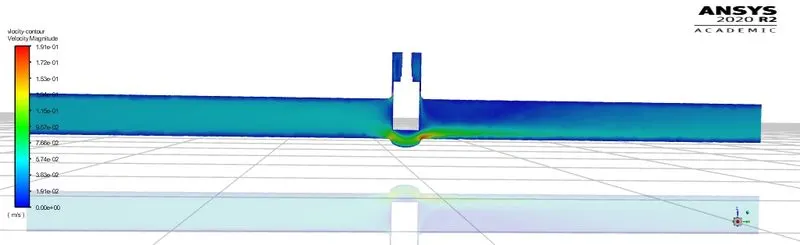
Fig.14- Velocity contour when valve opening is 40% i.e. 27 mm
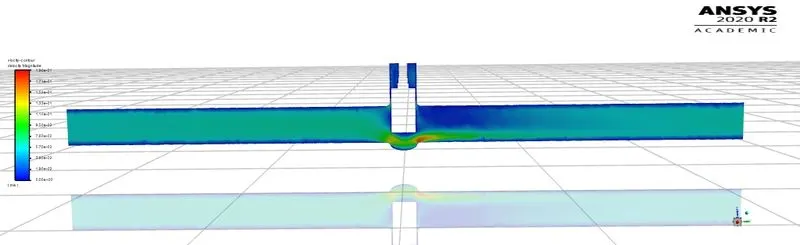
Fig.15- Velocity contour when valve opening is 50% i.e. 32.4 mm
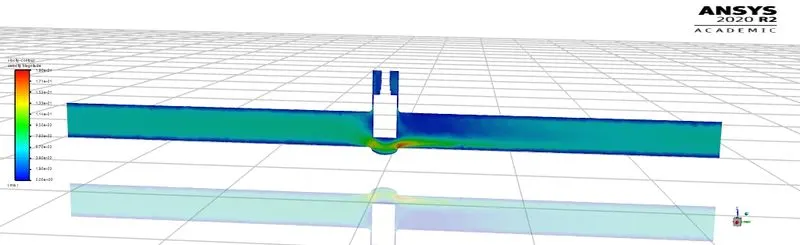
Fig.16- Velocity contour when valve opening is 60% i.e. 37.8 mm
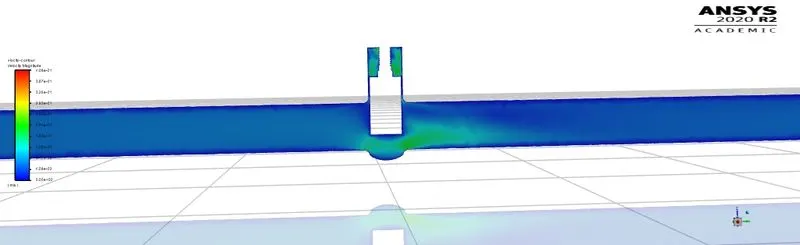
Fig.17- Velocity contour when valve opening is 70% i.e. 42.2 mm
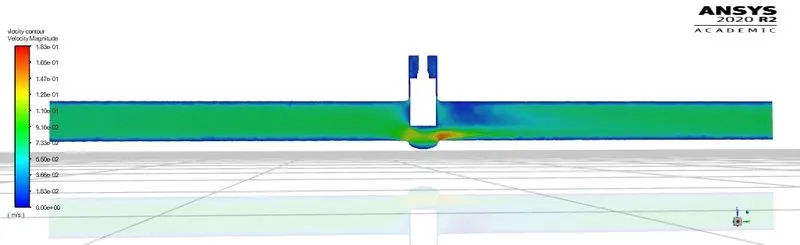
Fig.18- Velocity contour when valve opening is 80% i.e. 47.8 mm
Conclusion
The above study was done on parametric study which is a great tool to evaluate the change in parameters without making different solution settings for different levels of lift. Parametric study helps is analysing output parameters at different stages of lift or drop.
In the above situation we can observe the mass flow rate is negative and it keeps on increasing with the increase of percenage of lift. It means the more the valve is opened the more the fluid can flow through. We can control the amount of fluid flow in some cases as and when required as per needs.