Material modeling from raw data in LS-DYNA
AIM: To model a material in LS-DYNA using data obtained from experiments. To use the material model to simulate a tensile test of a simple dogbone specimen and compare the results to the experimental results.
PROCEDURE:
The experimental data which constitutes true stress and true strain of a material are first plotted in excel and fitted to a curve as shown below:
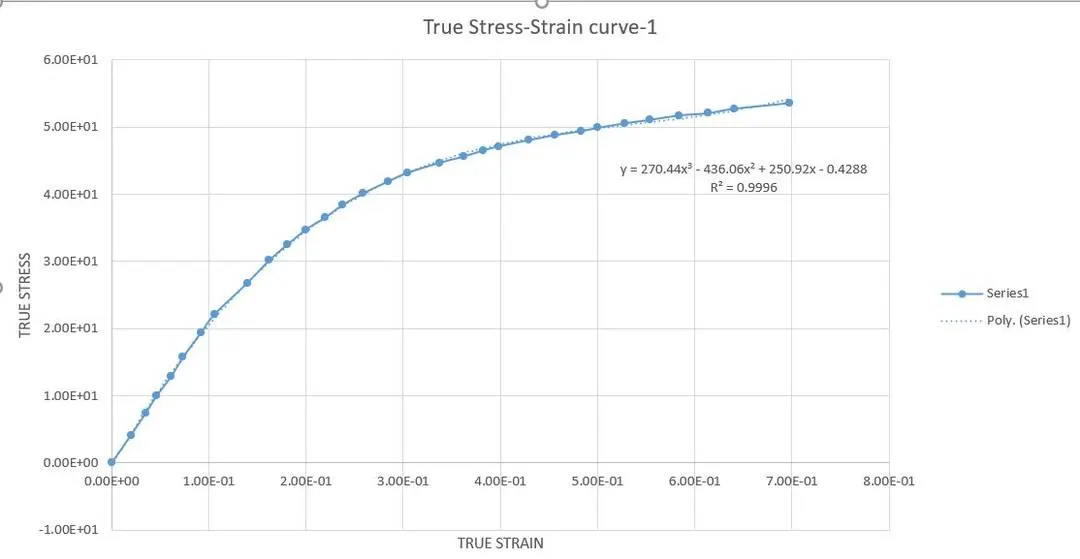
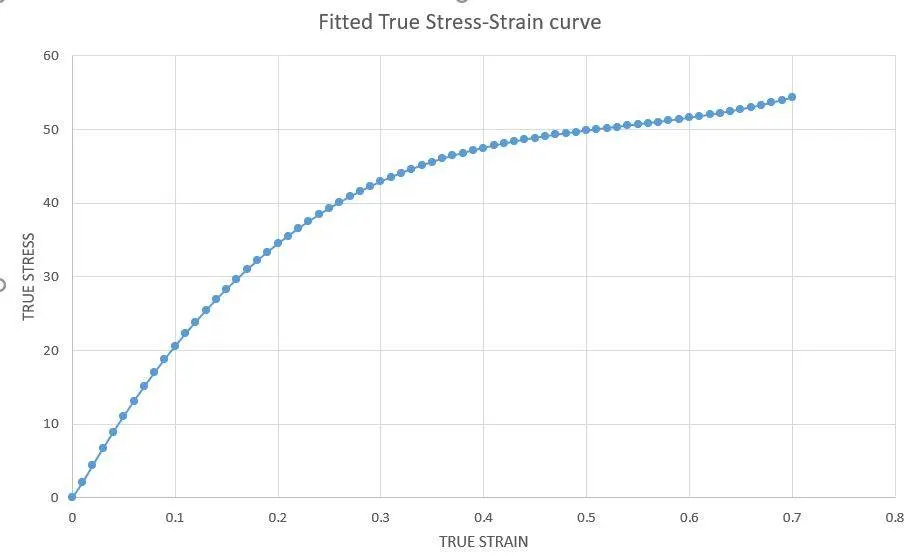
A polynomial of degree 3 is used for curve fit and as can be seen from the above graph, a very good fit with R^2 = 0.9996 is obtained. The stress is plotted in ksi units and strain is in percentage. Using this curve fit, another curve is plotted with homogeneous variation of x-data points as shown below:
Since a system of [kg mm ms] has to be utilized in LS-DYNA, the values have to be changed from ksi values to MPa/GPa values. The converted graph is shown below:
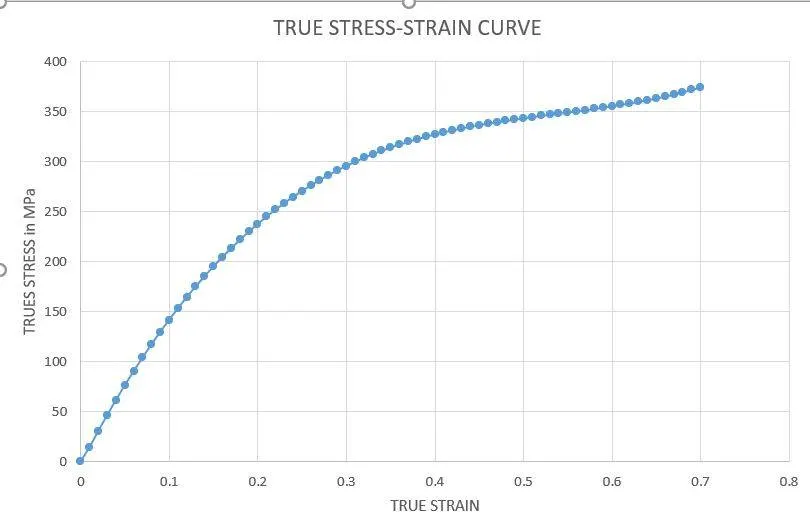
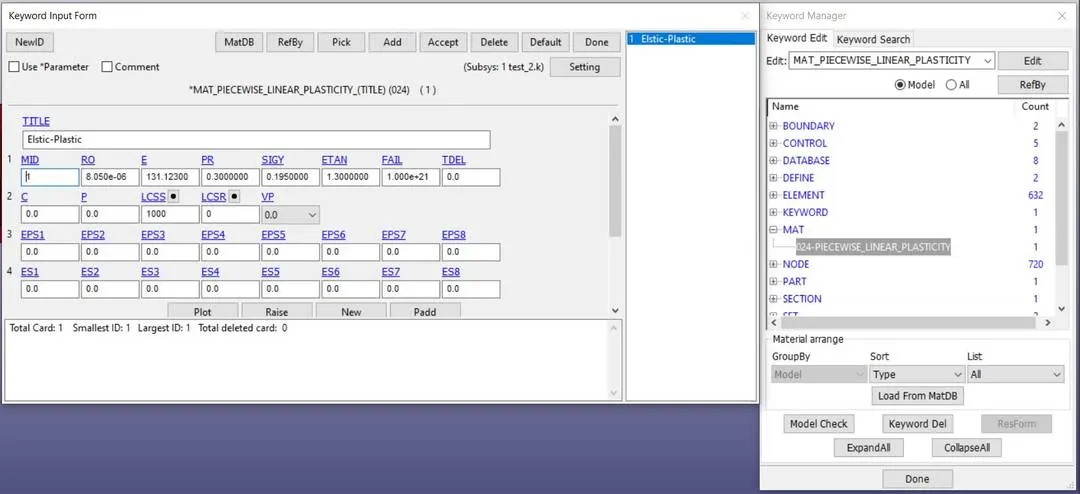
In the above graph, True stress is in MPa and strain is in percentage. From the graphs, we get a Young's modulus value of 131.123 GPa and yield stress of 195.21 MPa.
These values that are converted is inserted into the material data of MAT_024 type piecewise linear plasticity material. The strain is modelled using a linear displacement curve. The tensile model is given below:
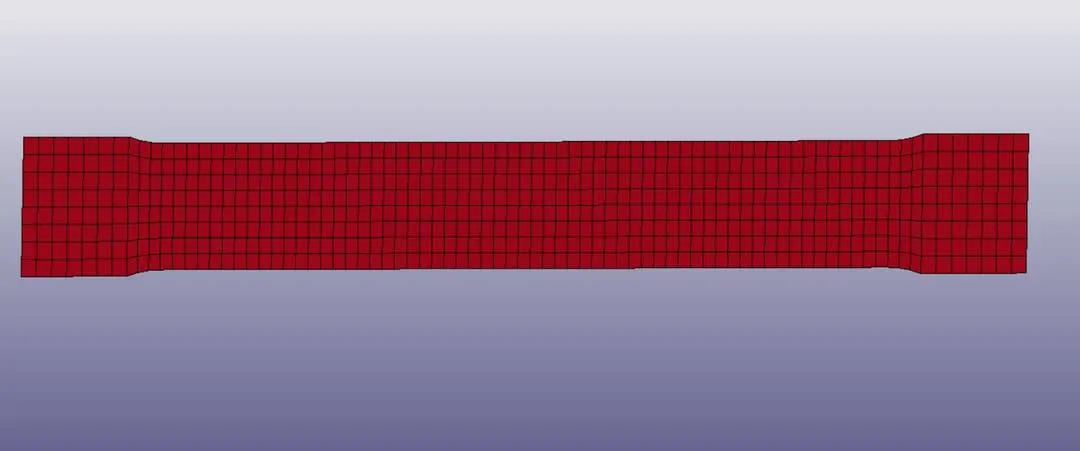
One end is constrained in all directions. The other end is given a displacement which is plotted below:
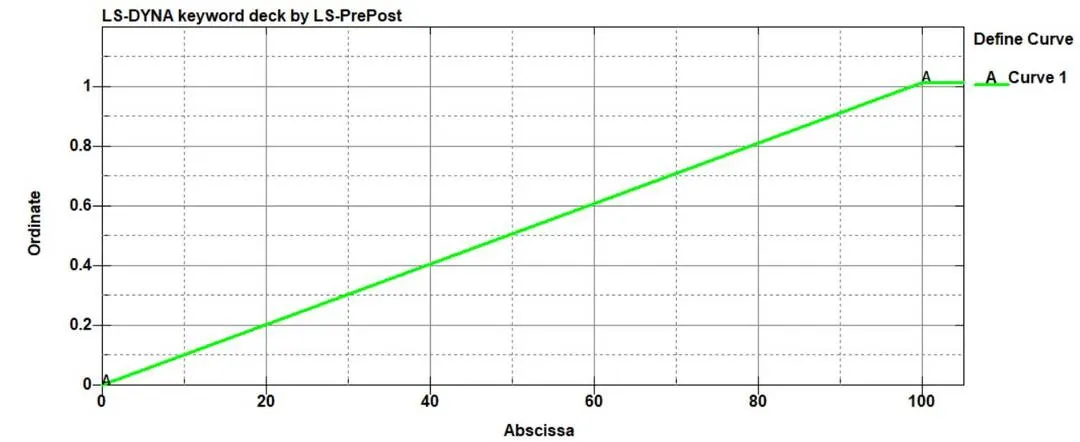
The material data is given in keyword manager as given below:
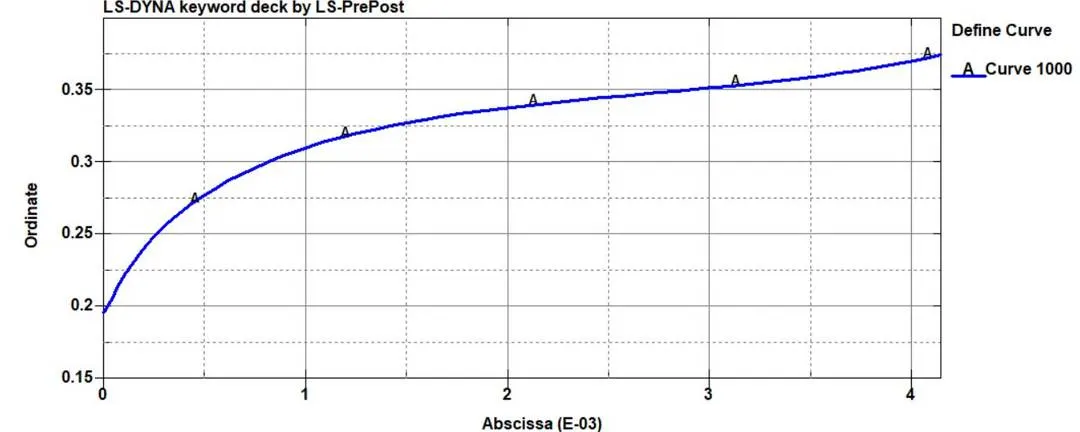
The plot for the curve defined for plastic region is given below:
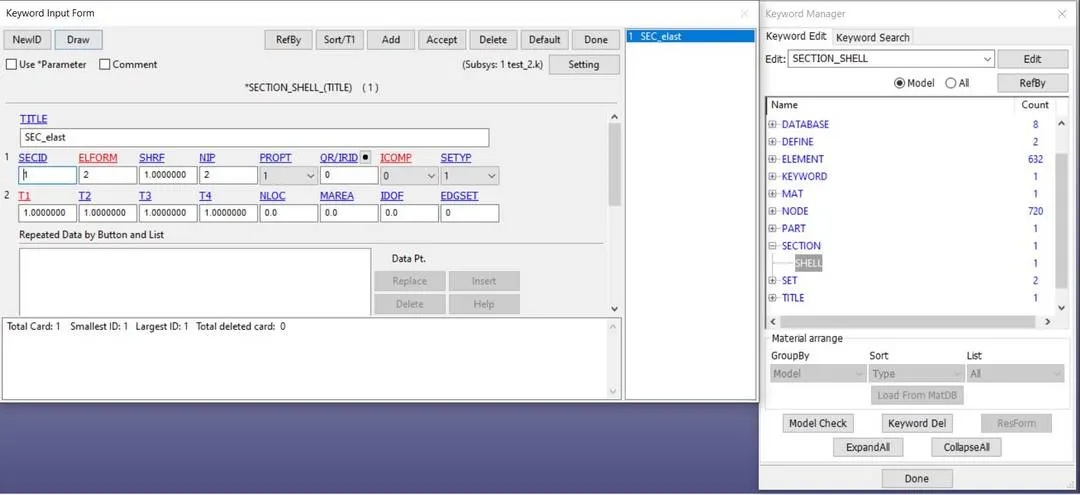
The section properties are defined in keyword manager as given below:
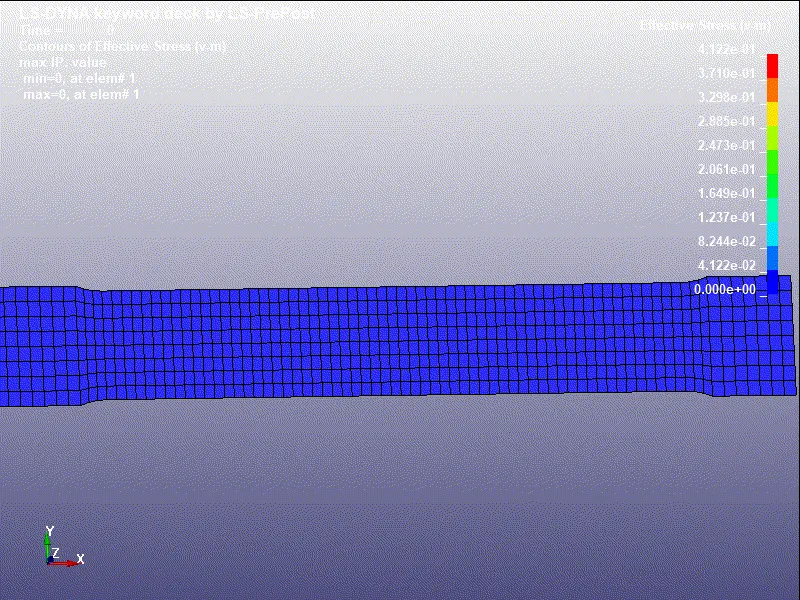
The results of the tensile test are as given below for the Von-Mises stress contour:
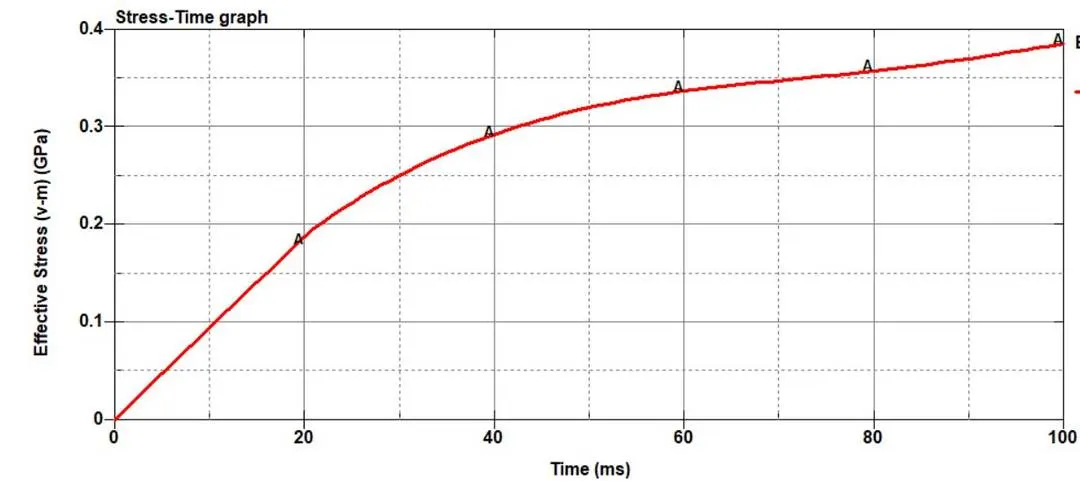
The stress vs time curve is plotted below:
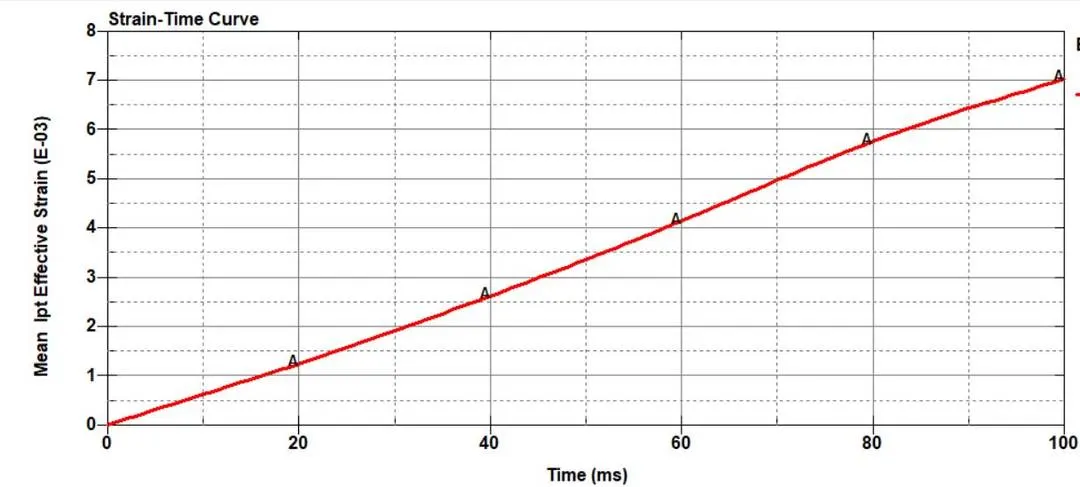
The strain vs time curve is given below:
Using these values, the Stress-Strain plot is plotted against the input stress-strain plot and compared below:
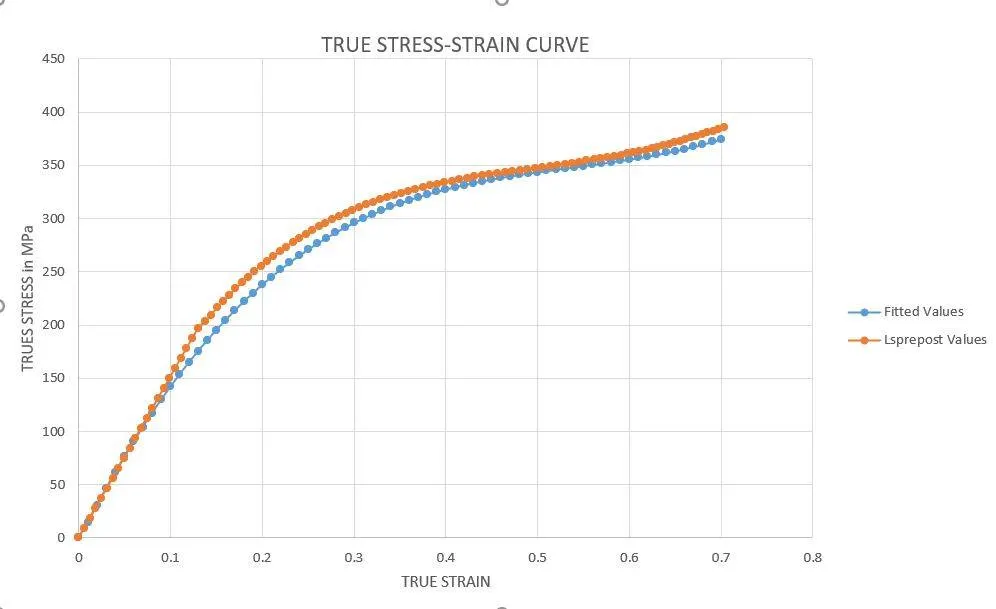
The blue curve is the input values and orange curve is the value obtained from post-processing. As can be seen, except from the values near the yield point, the postprocessing curve is in adherence with the input values.
CONCLUSION: Material modelling was successfully done using MAT_024 material and the material data was used to conduct a simple tensile test. The obtained results were compared quantitatively with the input values and the two curves were found to be in good adherence with each other.