Week 8 - Simulating Cyclone separator with Discrete Phase Modelling
Aim:
To perform analysis on cyclone separator and calculate the separation efficiency and pressure drop
Objective:-
- To write a few words about any four empirical models used to calculate the cyclone separator efficiency.
- To perform an analysis on a given cyclone separator model by varying the particle diameter from 1 μm to 5 μm and calculate the separation efficiency in each case. Discuss the results. [Use both the velocity's as 3m/sec.]
- To perform an analysis on a given cyclone separator model by varying the particle velocity from 1 m/sec to 5 m/sec and calculate the separation efficiency and pressure drop in each case. Discuss the results. [Use particle diameter size as 5 μm for all cases & keep flow velocity same as particle velocity]
Boundary Conditions:-
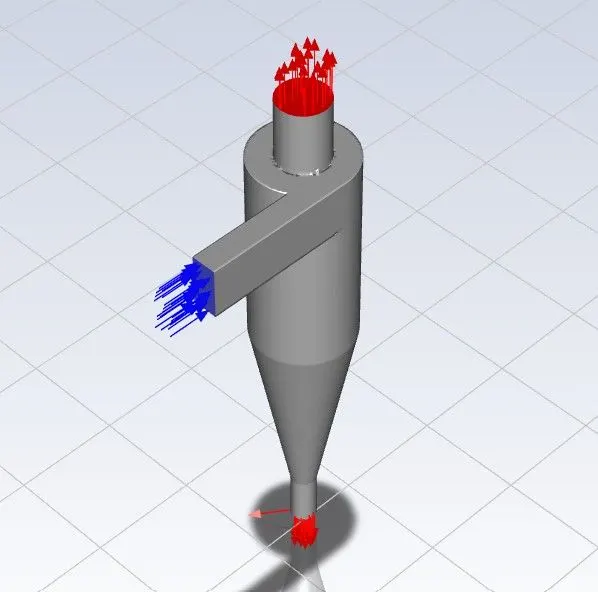
Inlet and wall:- Reflect
Outlet(Top):- Escape
Outlet(Bottom/dustbin) - Trap
1.
theory:
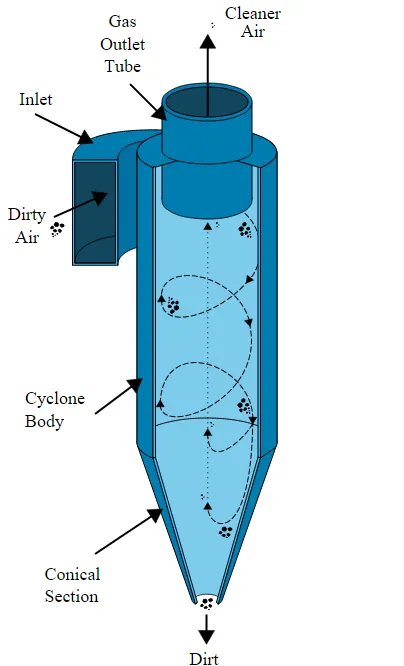
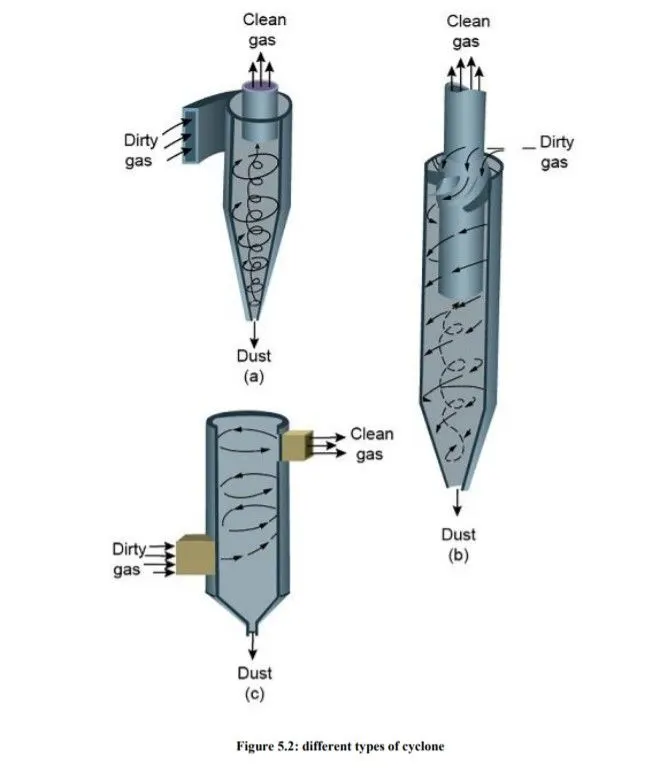
cyclone separator is a used for removing particulates from an air, gas or liquid stream, without the use of filters, through vortex separation. When removing particulate matter from liquid, a hydrocyclone is used; while from gas, a gas cyclone is used. rotational effects and gravity are used to separate mixtures of solids and fluids.
Cyclone separators work much like a centrifuge, but with a continuous feed of dirty air. In a cyclone separator, dirty flue gas is fed into a chamber. The inside of the chamber creates a spiral vortex, similar to a tornado. during rotation of dirty air, the particles with high density gets settled downwards due to gravity and the The cleaned flue gas with low density escapes out the top of the chamber.
cyclone separating efficiency:
The collection or separation efficiency is most properly defined for a given particle size. As mentioned, fractional efficiency is defined as the fraction of particles of a given size collected in the cyclone, compared to those of that size going into the cyclone. Experience shows that collection efficiency of cyclone separator increases with increasing particle mean diameter and density; increasing gas tangential velocity; decreasing cyclone diameter; increasing cyclone length. cyclone separarting efficiency is the ratio of total number of particles trapped at the oulet (the number of highly dence particles) of cyclone to the total number of particles tracked at the inlet (the number of particles injected).
pressure drop:
Pressure drop across the cyclone is of much importance in a cyclone separator. The pressure drop significantly affects the performance parameters of a cyclone. The total pressure drop in a cyclone will be due to the entry and exit losses, and friction and kinetic energy losses in the cyclone. Normally most significant pressure drop occurs in the body due to swirl. vortex motion creates the acceleration ib radial axis. this causes a development of pressure variation wth respect to radial axis.
The efficiency of a cyclone collector is related to the pressure drop across the collector. This is an indirect measure of the energy required to move the gas through the system. The pressure drop is a function of the inlet velocity and cyclone diameter.
here the clear air has to escape through outlet 1. so we have to consider the pressure drop as pressure diffference at inlet and outlet 1.
empirical models used to calculate the cyclone separator efficiency:
IOZIA AND LEITH MODEL-
Iozia and Leith (1990) logistic model is a modified version of Barth (1956) model which is developed based on force balance. The model assumes that a particle carried by the vortex endures the influence of two forces: a centrifugal force and a flow resistance.
LI AND WANG MODEL-
The Li and Wang (1989) model includes particle bounce or re-entrainment and turbulent diffusion at the cyclone wall. A two-dimensional analytical expression of particle distribution in the cyclone is obtained. Li and Wang model was developed based 180 on the assumption that the radial particle velocity and the radial concentration profile are not constant for uncollected particles within the cyclone.
KOCH AND LICHT MODEL-
Koch and Licht (1977) collection theory recognized the inherently turbulent nature of cyclones and the distribution of gas residence times within the cyclone. Koch and Licht describe particle motion in the entry and collection regions with the assumption that The tangential velocity of a particle is equal to the tangential velocity of the gas flow, i.e. there is no slip in the tangential direction between the particle and the gas.
LAPPLE MODEL-
Lapple (1951) model was developed based on force balance without considering the flow resistance. Lapple assumed that a particle entering the cyclone is evenly distributed across the inlet opening. The particle that travels from inlet half width to the wall in the cyclone is collected with 50% efficiency.
2.
To perform an analysis on a given cyclone separator model by varying the particle diameter from 1 μm to 5 μm and calculate the separation efficiency in each case. Discuss the results. [Use both the velocity's as 3m/sec.]
geometry:
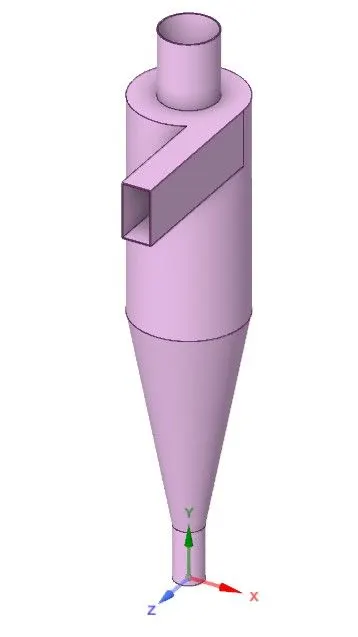
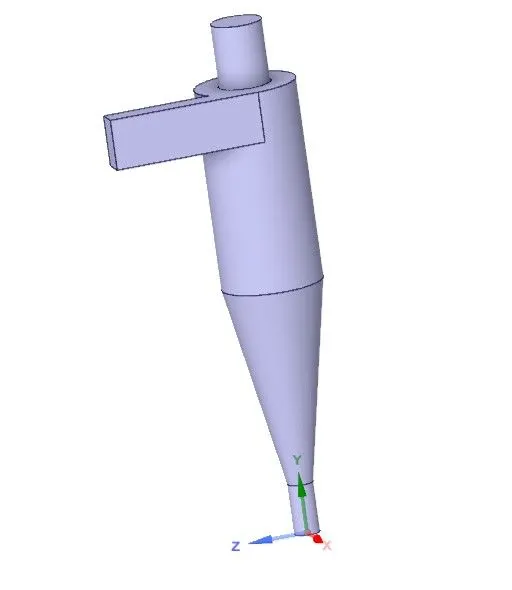
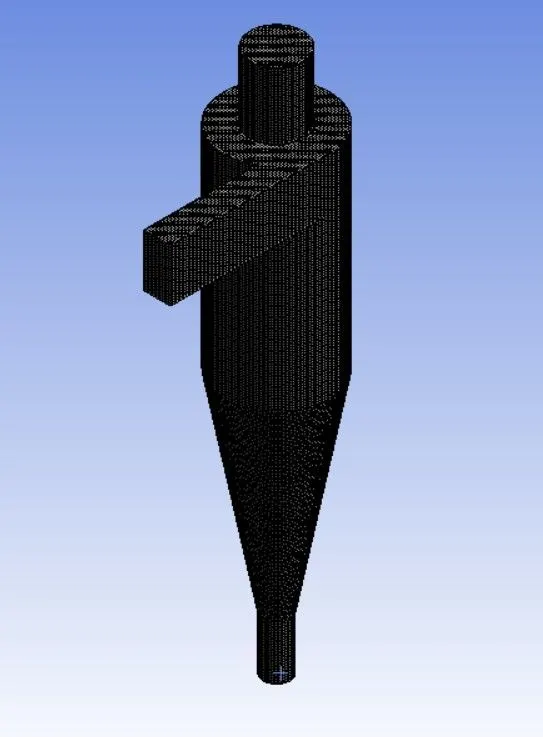
the right side figure is the volume extracted from the cyclone sperarator geoemtry.
mesh:
mesh is generated with element size of 5mm and Cartesian method is used here. The Cartesian method creates unstructured hexa mesh of mostly uniform size, aligned to the specified coordinate system, and fits it to the geometry. This method is useful when the geometry features align well with a coordinate system and a regular mesh is desired. here the top outlet is named as 'outlet 1' and the bottem outlet is named as 'outlet 2'.
set up:
solver type- pressure based
time- steady
gravity in y direction: -9.81
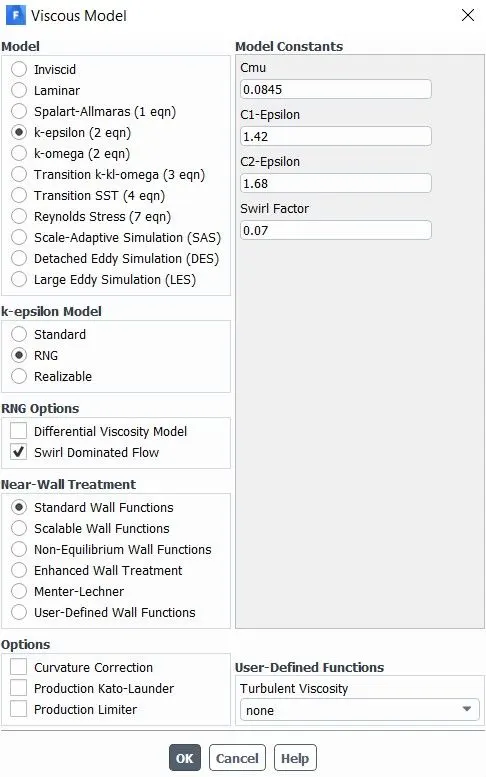
turbulence model - k epsilon RNG model
here i have taken k epsilon RNG model because this trbulance model gives the accurate results for the vortex flows.
Discrete phase model:
to solve transport equations for the continuous phase, ansys fluent allows you to simulate a discrete second phase in a Lagrangian frame of reference. This second phase consists of spherical particles (which may be taken to represent droplets or bubbles) dispersed in the continuous phase. ansys fluent computes the trajectories of these discrete phase entities, as well as heat and mass transfer to/from them. The coupling between the phases and its impact on both the discrete phase trajectories and the continuous phase flow can be included.
couplings between continuous phase (fluid phase) and discrete phase (particles phase):
1. one way coupling-
- the fluid phase influences the discrete phase via drag and turbulence
- the discrete phase has no influence on the continuous phase.
2. two way coupling-
- the fluid phase influences the discrete phase via drag and turbulence
- the discrete phase influences the continuous phase via source terms of mass, momentum and energy
- it alternatively solves the discrete and continuous phase equations until the solutions in both phases stop changing.
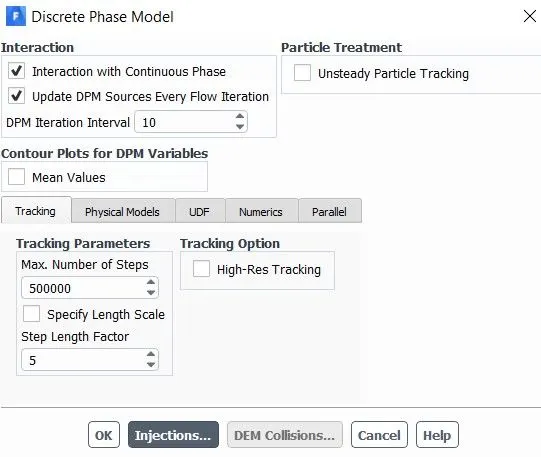
in the below i have enabled the two way coupling and i have updated the DPM sources for every 10 iteratins.in the tracking parameters, the max. number of time steps were taken as 500000. it means here we are going to track the particle trajectory from inlet to outlet. but due to vortex motion generated in the separator, the particles gets recirculated. so we cannot track the particle trajectory. so i have taken 500000 time steps upto which we are going to solve the equations for a particle. if the particle trajectory is not found with in the 50000 time steps, we can confirm that the particle is in recirculation region. step length factor controls the time step size used to integrate the equations of motion of particles. the integration time step is computed by ansys fluent based on specified length sclae and the velocity of particles and velocity of continuous phase.
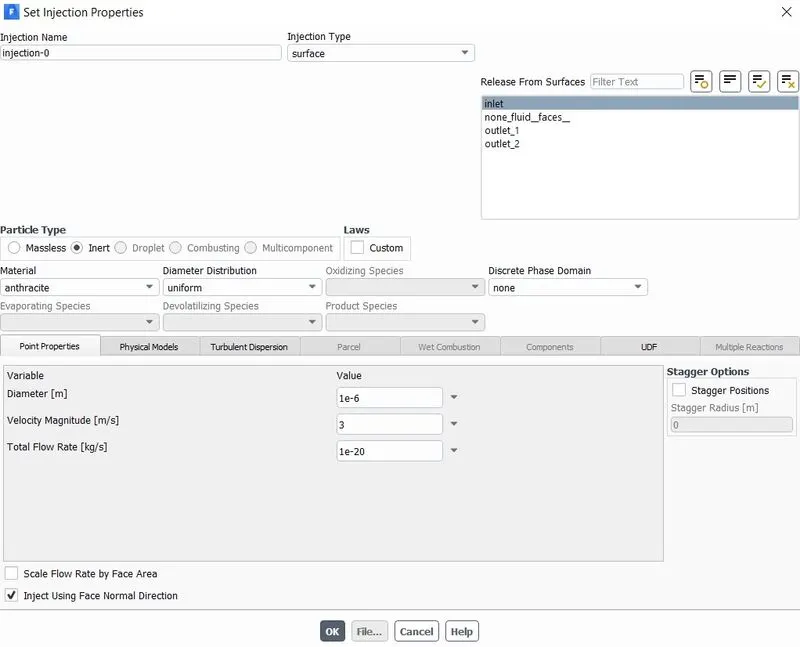
now click on injection. here we are going to inject the anthracite inert particles. the injection type is surface at the inlet. the inlet velocity of particles is 3 m/s and the diamter of the particle is 1e-6 m .
boundary conditions: here we are going to provide air as continuous fluid. so it means n through inlet both the air and anthracite particles enter into the cyclone separator.
inlet- air with velocity 3 m/s
DPM boundary condition is 'reflect'
outlet 1 - DPM boundary condition is 'escape'
outlet 2- DPM boundary conditio is 'trap'
wall - DPM boundary condition is 'reflect'
initialization : standard initialization
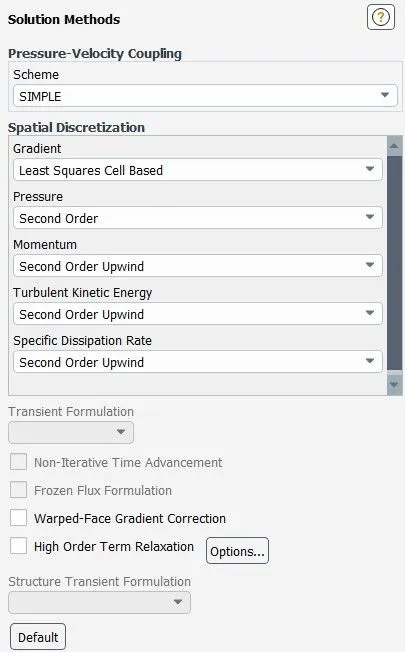
particle diamter - 1 micro meter
particle velocity - 3 m/s
flow velocity - 3 m/s
solution:
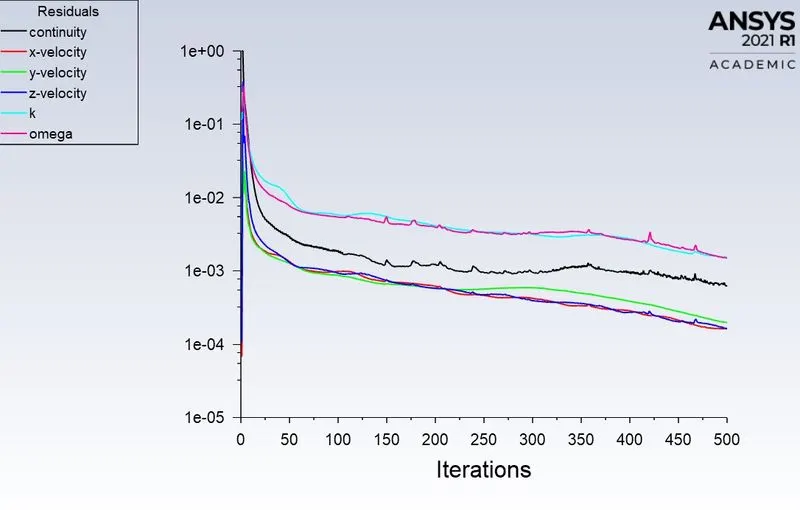
residuals plot-
now export the particle history data by clicking the file button and save the data in the browse.
after calcultions, by opening the console we can see the number of particles tracked, number of particles trapped etc..
tracked number of particles = 378
escaped number of particles = 199
trapped number of particles = 136
incomplete number of particlesv = 43
where
tracked particles- the particles which enter the cyclone separator with each flow time.
escaped particles- the particles which have low density , leave the upper outlet of cyclone separator that is outlet 1.
trapped particles- the particles which have high density, leave the lower outlet of cyclone separator that is outlet 2.
incomplete particles- the [articles which are settled in the recirculated region due to vortesity developed in the cyclone separator.
separation efficiency = trapped particles/tracked particles
= 136/378 = 0.3597
= 35.97 %
pressure at inlet plot-
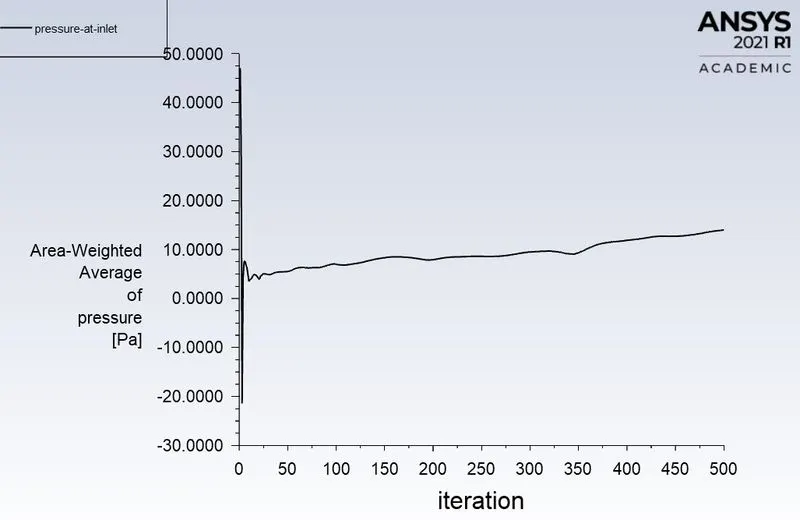
area weighted average at inlet is 13.995505 pa
pressure at outlet 1 plot-
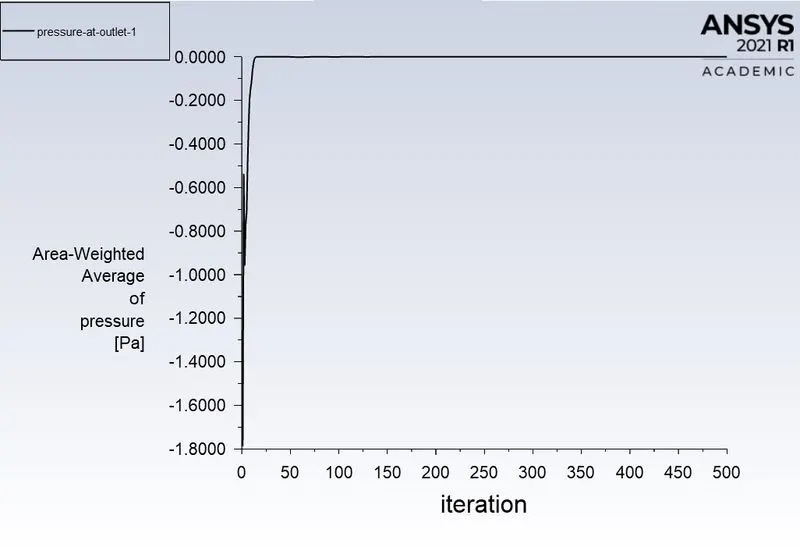
area weighted average of pressure at outlet 1 is 0 pa
- pressure drop = pressure at inlet - pressure at outlet 1 = 13.995505 pa
result:
now import the particle tracking history in the CFD post
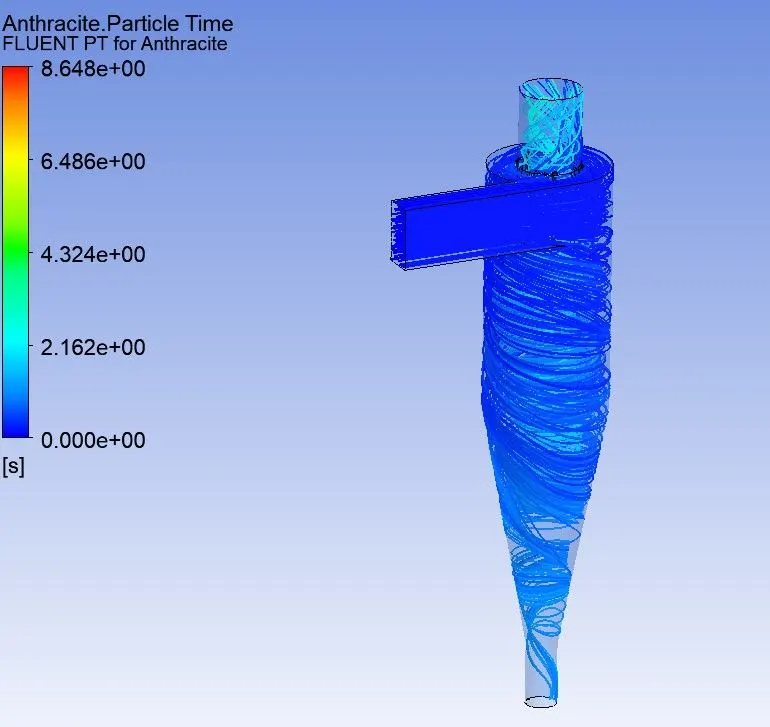
anthrasite particle time contour-
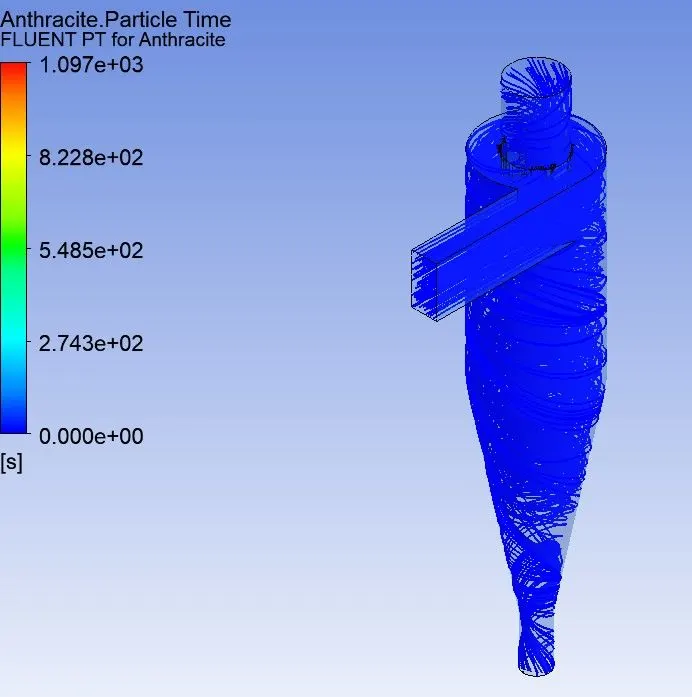
it denotes the time at which the position of anthrasite particles are present in the cyclone separator. here in the below figure, i have taken 100 particles to see their trajectory.
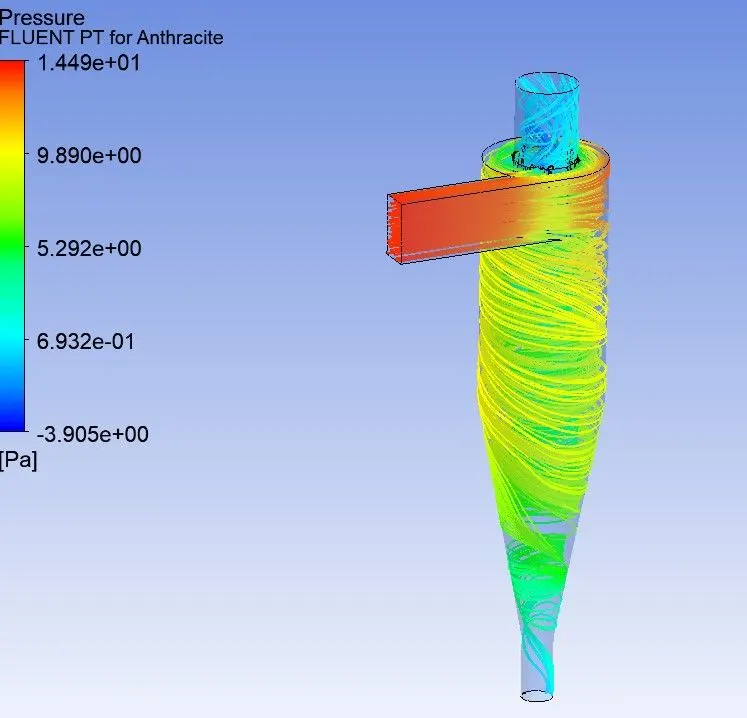
pressure contour-
animation-
https://drive.google.com/file/d/1nQPOpHVIolRtovCMOhkHrRdNGcx4Afr1/view?usp=sharing
particle diamter - 3 micro meter
particle velocity - 3 m/s
flow velocity - 3 m/s
solution:
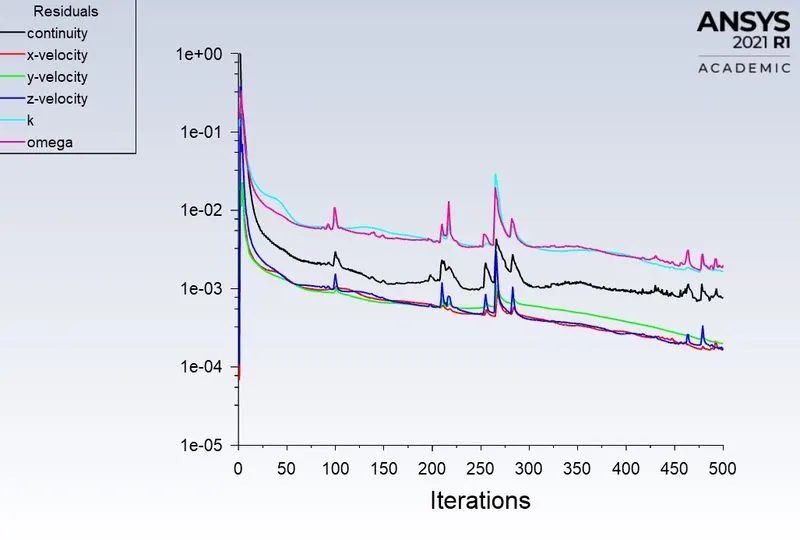
residuals plot-
after calcultions, by opening the console we can see the number of particles tracked, number of particles trapped etc..
tracked number of particles = 378
escaped number of particles = 173
trapped number of particles = 193
incomplete number of particlesv = 12
separation efficiency = trapped particles/tracked particles
= 193/378 = 0.5105
= 51.05 %
pressure at inlet plot-
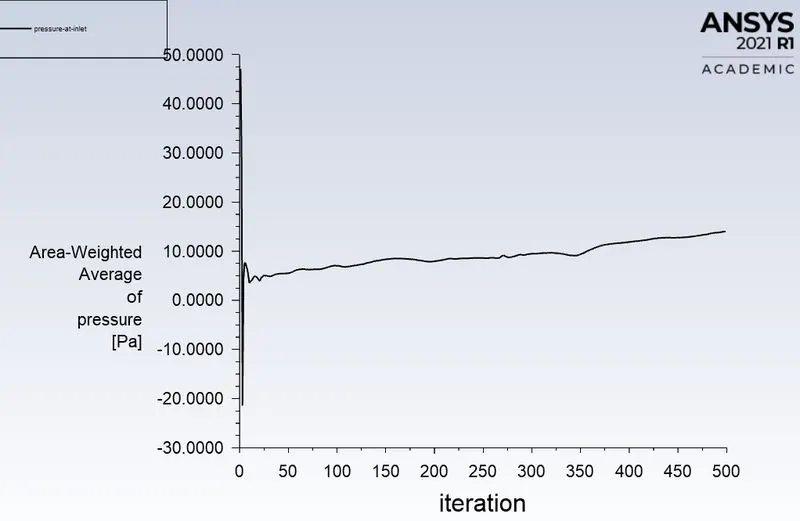
area weighted average of pressure at inlet is 14.011631 pa
pressure at outlet 1 plot-
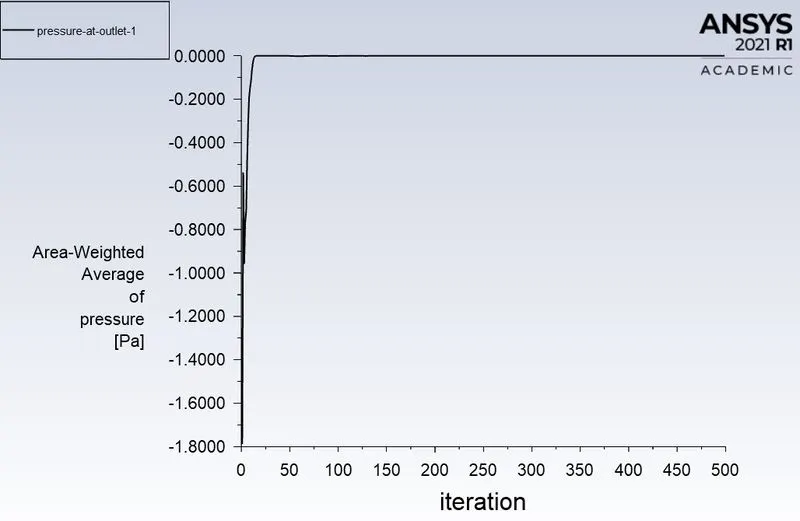
area weighted average of pressure at inlet is 0 pa
- pressure drop = pressure at inlet - pressure at outlet 1 = 14.011631 pa
result:
anthrasite particle time contour-
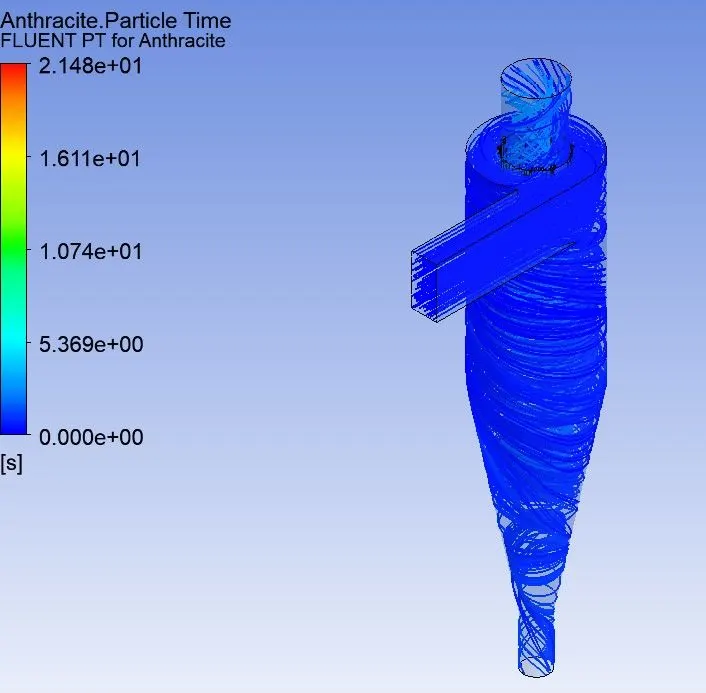
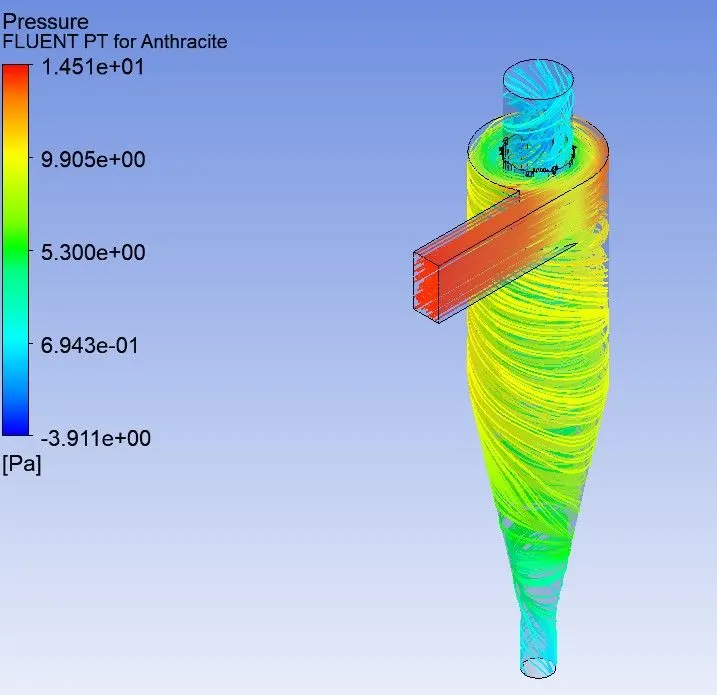
pressure contour-
animation-
https://drive.google.com/file/d/1y2H8TSM2Yrn5n8arqbrynJPbQcYkjO0y/view?usp=sharing
particle diamter - 5 micro meter
particle velocity - 3 m/s
flow velocity - 3 m/s
solution:
residuals plot-
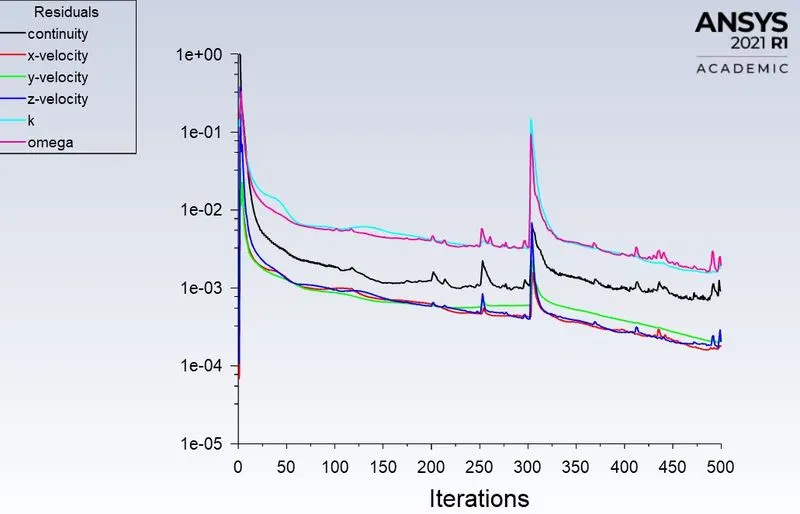
after calcultions, by opening the console we can see the number of particles tracked, number of particles trapped etc..
tracked number of particles = 378
escaped number of particles = 76
trapped number of particles = 234
incomplete number of particlesv = 68
separation efficiency = trapped particles/tracked particles
= 234/378 = 0.6190
= 61.90 %
pressure at inlet plot-
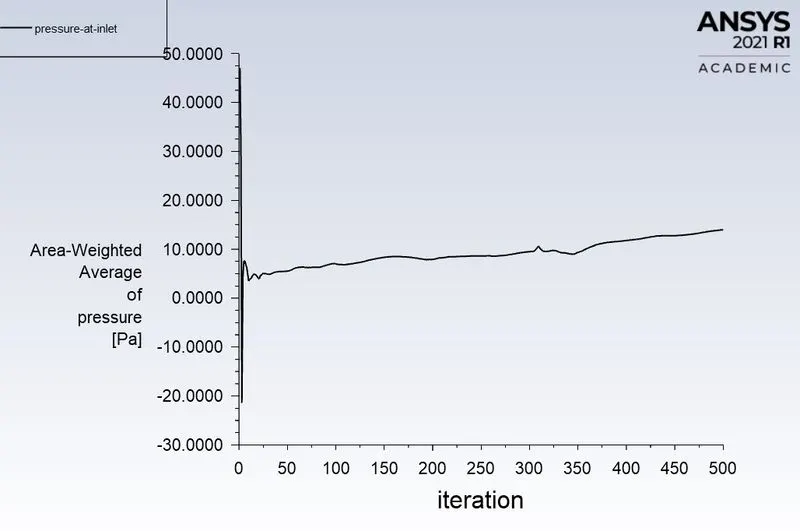
area weighted average of pressure at inlet is 13.959583 pa
pressure at outlet 1 plot-
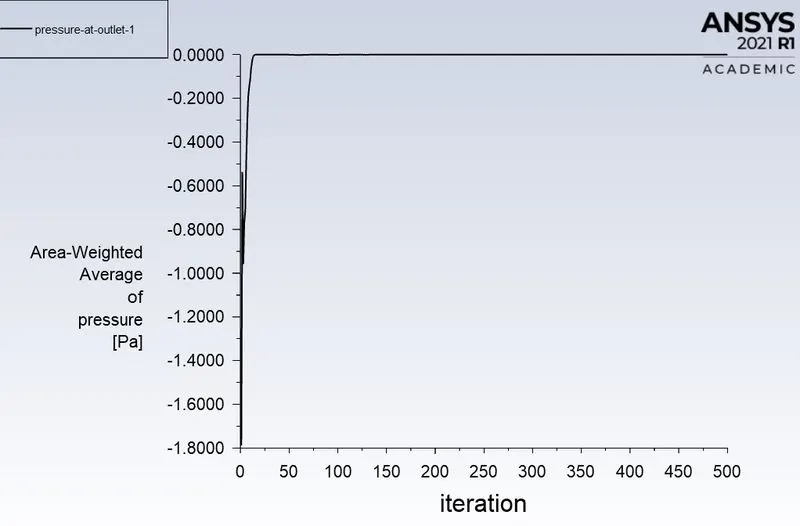
area weighted average of pressure at inlet is 0 pa
- pressure drop = pressure at inlet - pressure at outlet 1 = 13.959583 pa
result:
anthrasite particle time contour-
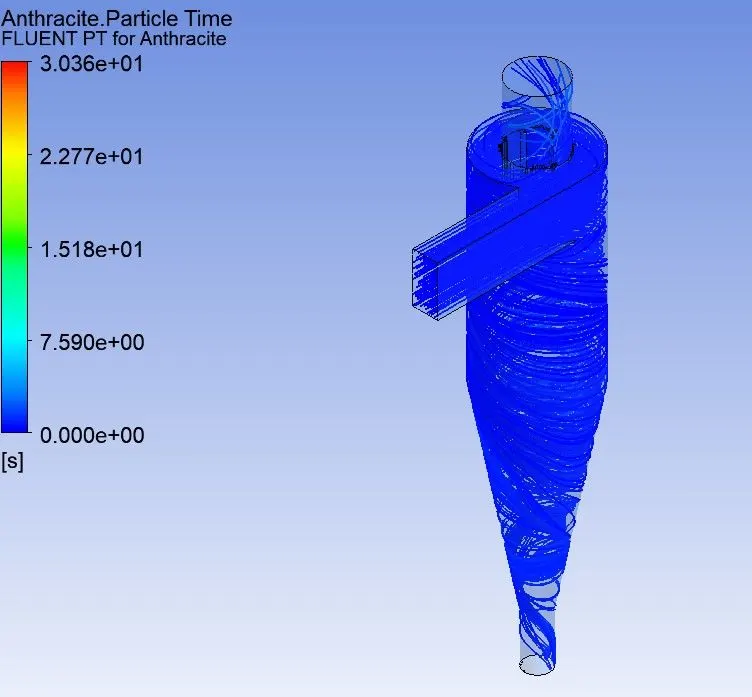
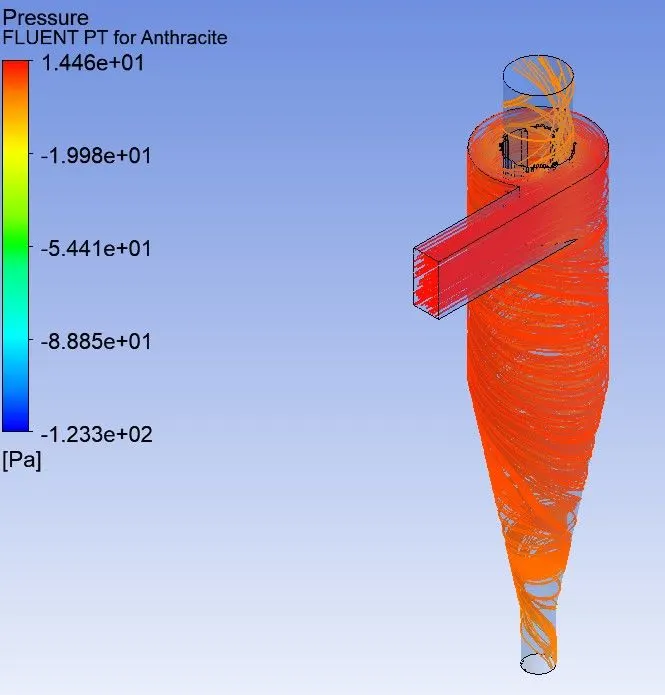
pressure contour-
animation-
https://drive.google.com/file/d/16Dka3yfo9VQZEQ9enUJJyay6FBOds9YP/view?usp=sharing
3.
To perform an analysis on a given cyclone separator model by varying the particle velocity from 1 m/sec to 5 m/sec and calculate the separation efficiency and pressure drop in each case. Discuss the results. [Use particle diameter size as 5 μm for all cases & keep flow velocity same as particle velocity]
particle diameter - 5 micro meter
particle velocity - 1 m/s
flow velocity - 1 m/s
solution:
residuals plot-
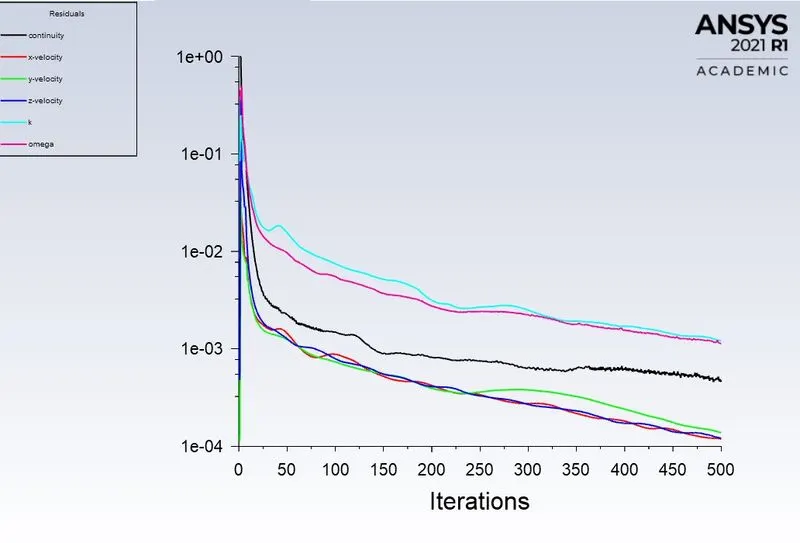
after calcultions, by opening the console we can see the number of particles tracked, number of particles trapped etc..
tracked number of particles = 378
escaped number of particles = 177
trapped number of particles = 195
incomplete number of particlesv = 6
separation efficiency = trapped particles/tracked particles
= 195/378 = 0.5158
= 51.58 %
pressure at inlet plot-
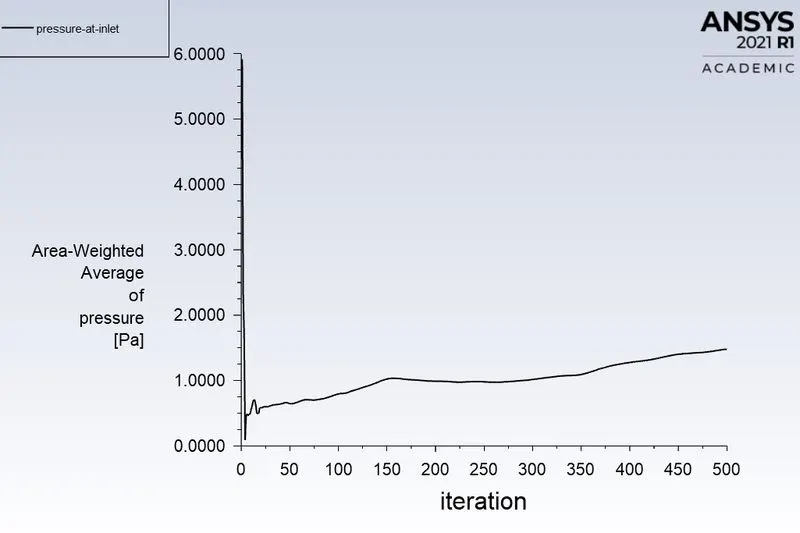
area weighted average of pressure at inlet is 1.4784529 pa
pressure at outlet 1 plot-
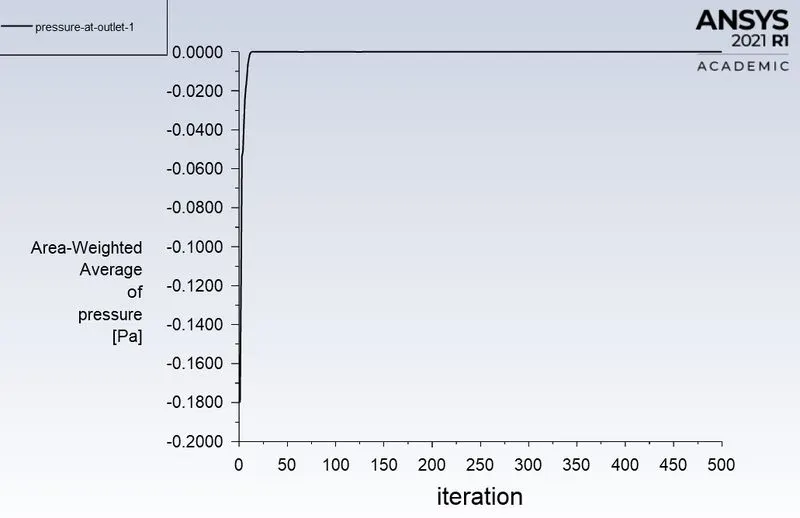
area weighted average of pressure at inlet is 0 pa
- pressure drop = presssure at inlet - pressure at outlet 1 = 1.47845 pa
result:
anthrasite particle time contour-
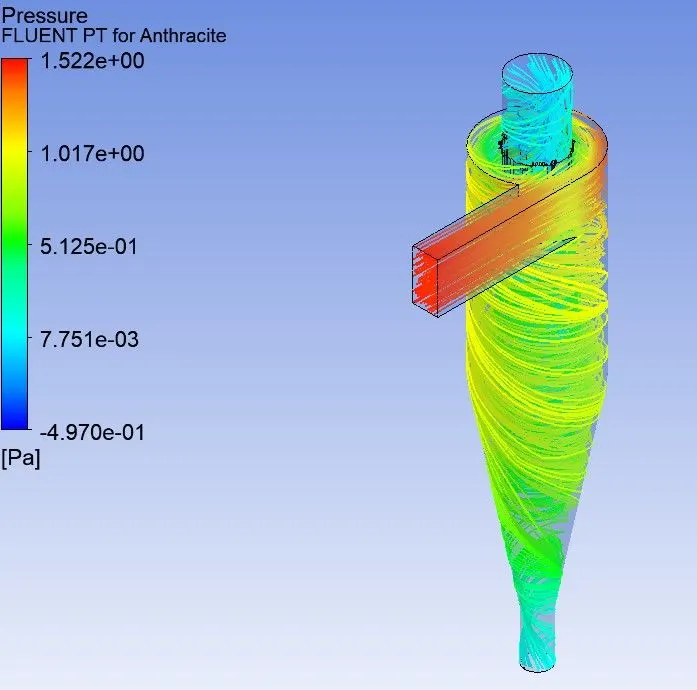
pressure contour-
animation-
https://drive.google.com/file/d/19qLHcxvqB4MauxrdYXoTLTKgWnVyZQrQ/view?usp=sharing
particle diameter - 5 micro meter
particle velocity - 3 m/s
flow velocity - 3 m/s
solution:
residuals plot-
after calcultions, by opening the console we can see the number of particles tracked, number of particles trapped etc..
tracked number of particles = 378
escaped number of particles = 76
trapped number of particles = 234
incomplete number of particlesv = 68
separation efficiency = trapped particles/tracked particles
= 234/378 = 0.6190
= 61.90 %
pressure at inlet plot-
area weighted average of pressure at inlet is 13.959583 pa
pressure at outlet 1 plot-
area weighted average of pressure at inlet is 0 pa
- pressure drop = pressure at inlet - pressure at outlet 1 = 13.959583 pa
result:
anthrasite particle time contour-
pressure contour-
animation-
https://drive.google.com/file/d/16Dka3yfo9VQZEQ9enUJJyay6FBOds9YP/view?usp=sharing
particle diameter - 5 micro meter
particle velocity - 5 m/s
flow velocity - 5 m/s
solution:
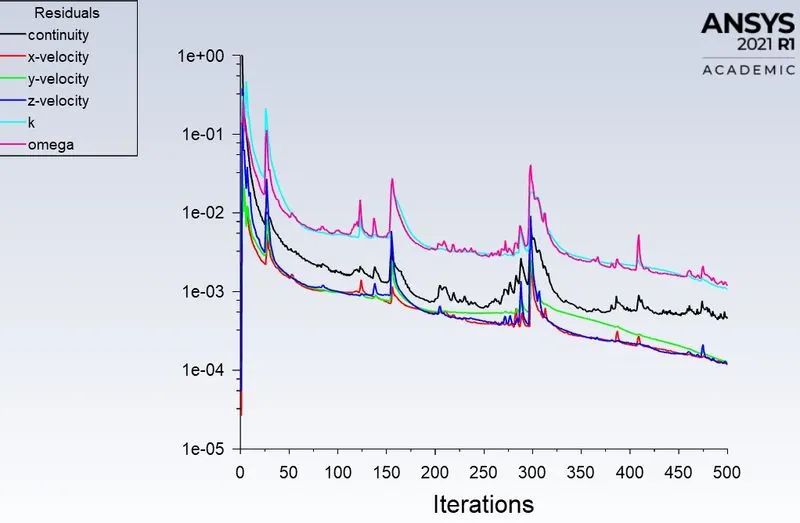
residuals plot-
after calcultions, by opening the console we can see the number of particles tracked, number of particles trapped etc..
tracked number of particles = 378
escaped number of particles = 38
trapped number of particles = 339
incomplete number of particlesv = 1
separation efficiency = trapped particles/tracked particles
= 339/378 = 0.8968
= 89.68 %
pressure at inlet plot-
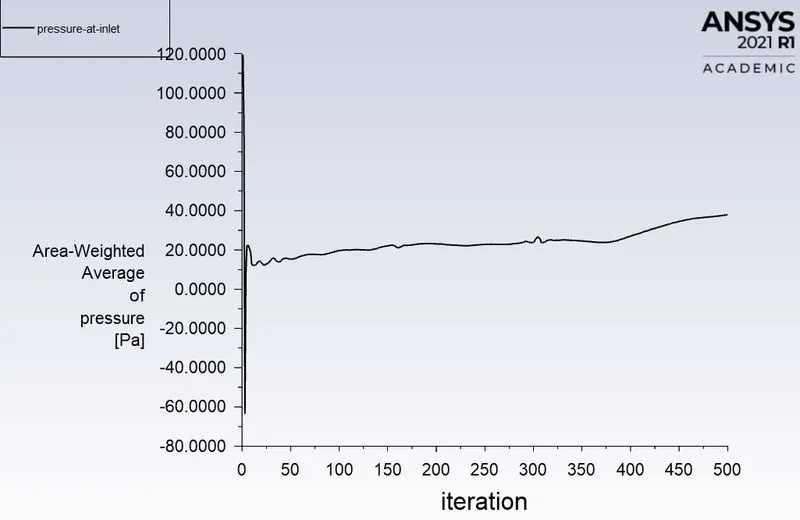
area weighted average of pressure at inlet is 37.979201 pa
pressure at outlet 1 plot-
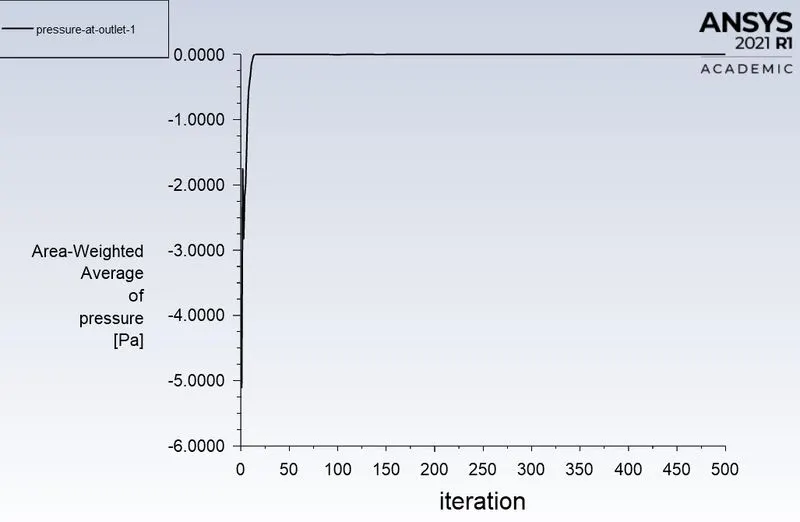
area weighted average of pressure at outlet 1 is 0 pa
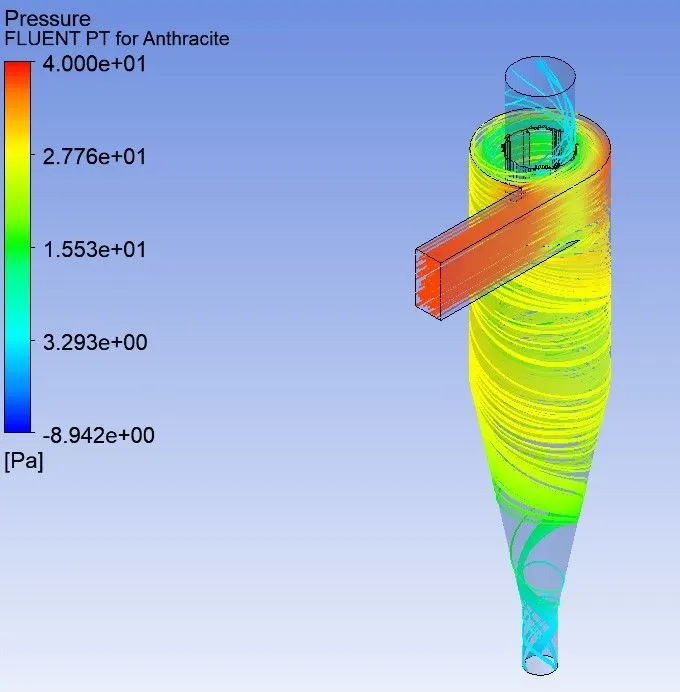
- pressure drop = pressure at inlet - pressure at outlet 1 = 37.979201 pa
result:
anthrasite particle time contour-
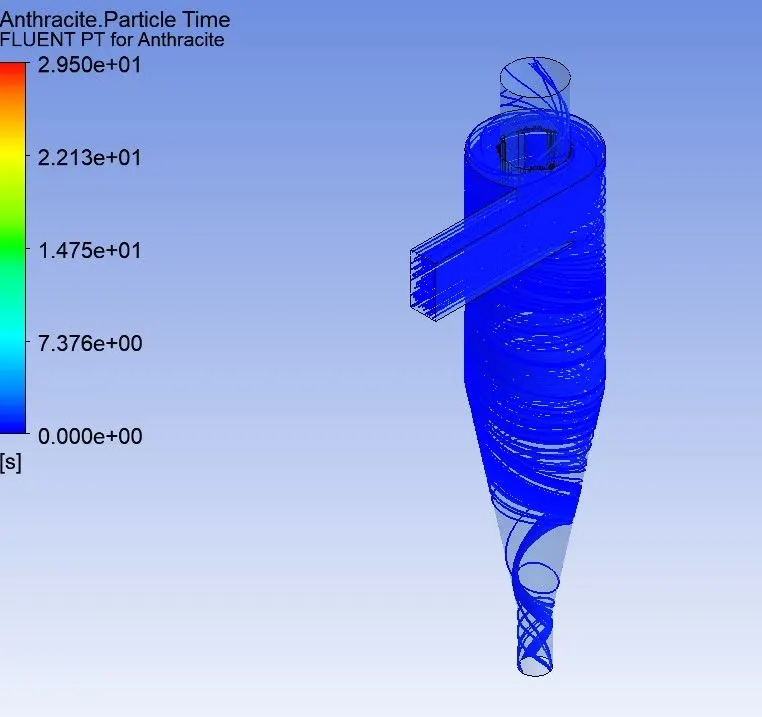
pressure contour-
animation-
https://drive.google.com/file/d/1NZsBk6O_2AfJt67TF5X8Cvxv-ENeIDrh/view?usp=sharing
| particle diameter (micro meter) | particle velocity (m/s) | separation efficiency | pressure drop (pa) |
| 1 | 3 | 35.97 | 13.995 |
| 3 | 3 | 51.05 | 14.01 |
| 5 | 3 | 61.09 | 13.95 |
| 5 | 1 | 51.58 | 1.47845 |
| 5 | 3 | 61.9 | 13.95 |
| 5 | 5 | 89.68 | 37.979 |
cocnclusion:
- the separation efficiency increases with increase in particle size. because the particle with more mass will have more gravitational force to get settle down at the outlet 2.
- the pressure drops remains constant for the particles with same velocity, because the pressure drop is a function of velocity of the particles.
- the separation efficiency increases with increase in velocity of particle.
- the pressure drop increases with increase in particle velocity, because the pressure drop is a function of velocity of the particles.