Week 8 - Simulating Cyclone separator with Discrete Phase Modelling
Aim
Perform an analysis on the given cyclone separator at various velocities and particle diameters to obtain cyclone separator efficiency and pressure drop.
Introduction
Cyclone Separators are separation devices that employ inertia to remove particulate matter from gases. It involves a generation of a central vortex in the separator where the lighter gas particles will be influenced and tend to move up and escape in, the heavier particles on the other hand will have higher inertia and will not be able to move into the vortex, instead they bump on the walls of the cyclone separator and fall down into the collection bin.
The separation efficiency of a cyclone separator is defined as the ratio of particles trapped to the total number of particles. Higher separation efficiency is usually observed with larger particle sizes as they tend to have more inertia and get trapped easily.
Empirical Models
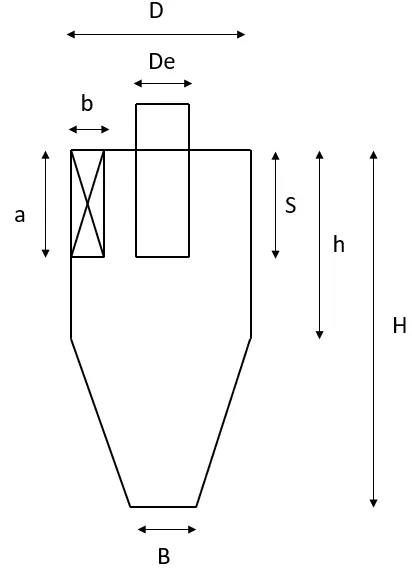
Empirical models to estimate Cyclone separator efficiency have been devised based on the schematic of a generic cyclone separator shown below [1].
- Iozia and Leith Model:
This model is based on force balance that assumes particles carried by the vortex endures through a centrifugal force and flow resistance. The separation efficiency is given as: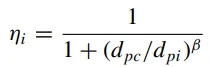
where,
- Li and Wang Model:
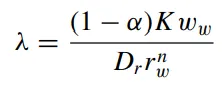
This model includes particle bounce and turbulent diffusion at the cyclone wall using a two-dimensional analytical expression for the particle distribution.
The concentration distribution in the cyclone is given by: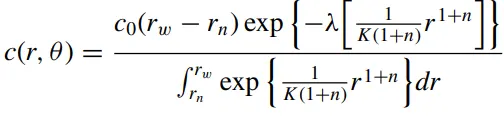
where,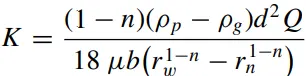
The final collection efficiency for particles is given as:
where,
- Koch and Licht Model:
This model recognizes the inherent turbulent nature of the cyclone and the distribution of gas
residence times within the cyclone. The separation efficiency is given as: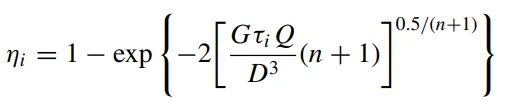
where,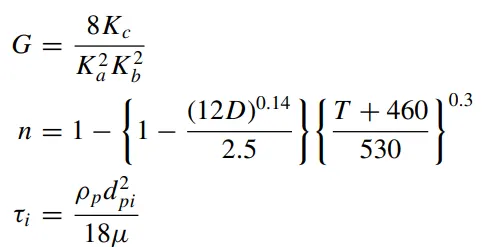
- Lapple Model:
This model is based on force balance without considering the flow resistance and assumes that a particle entering the cyclone is evenly distributed across the inlet opening. The separation efficiency is given as: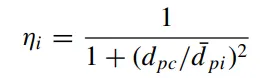
where,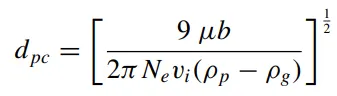
and,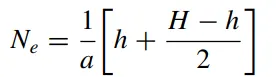
All empirical relations seen above were taken from the works of Gimbun et al [1].
Pressure drop
Pressure drop is the loss in total pressure of the system and can be estimated by the difference between the total pressure at the inlet and outlets.
Method
Cyclone Separator Geometry and Fluid domain
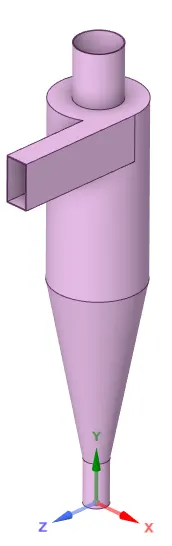
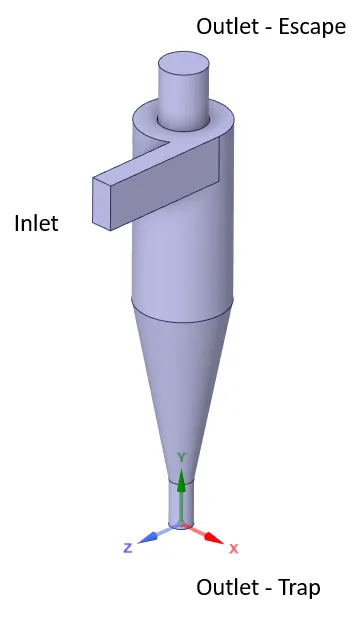
The image below shows the given geometry of the cyclone separator on the left and the extracted internal fluid volume on the right. The trap and escape outlets are used to trap the heavier particles and let escape the lighter particles respectively.
Mesh Generation
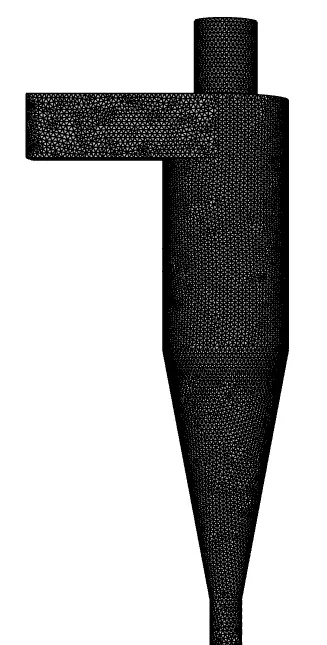
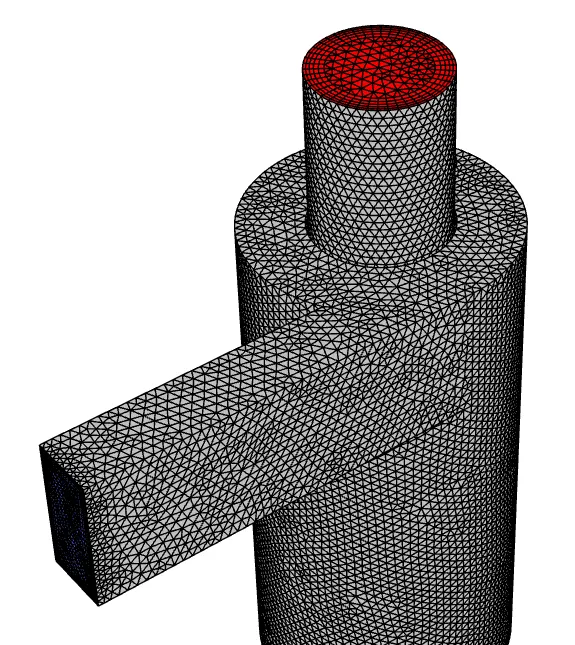
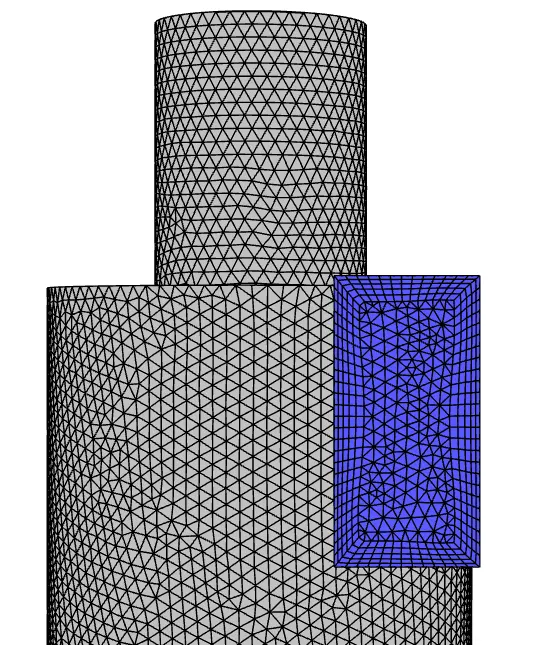
An unstructured tetrahedral mesh was generated on the fluid domain with a global element size of 6.9e-3m and an inlet face sizing of 4e-3m. Five inflation layers were generated using a smooth transition of 0.6 on all the wall surfaces. The resulting mesh had 510K cells as shown below.
Solver and Boundary Conditions
All simulations were performed using ANSYS Fluent 2022R2. Fluid used in the analysis was air with default properties. The fluid velocity at the inlet was varied from 1,3 and 5m/s across simulations with a reflect boundary condition for DPM calculations. The outlets were set to a 0 gauge pressure relative to the atmosphere with the top outlet set to an escape boundary condition and the bottom outlet set to a trap boundary condition for DPM calculations. Surface injection of particles was enabled with velocities equal to the respective inlet velocity and diameters changing from 1,3 and 5 micrometres. Anthracite was chosen as the material for the inert particles with a density of 1550 kg/`m^3`.
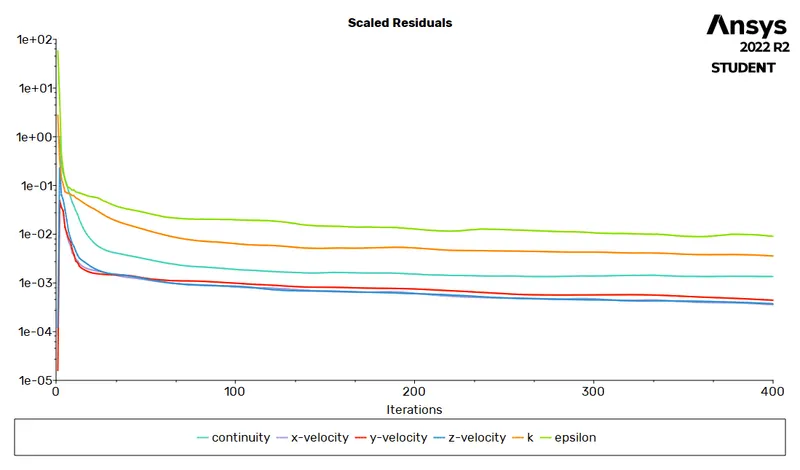
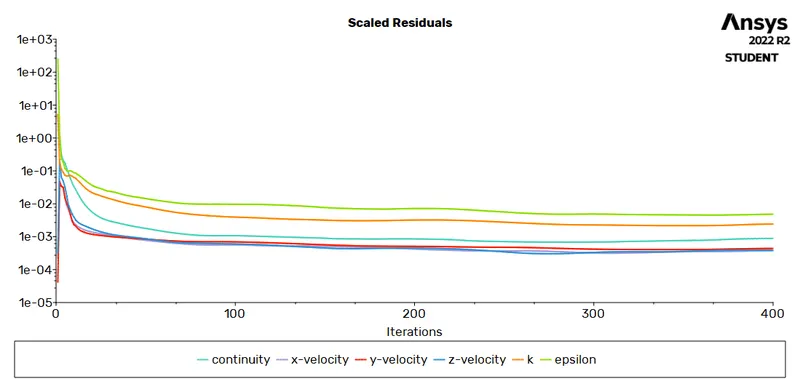
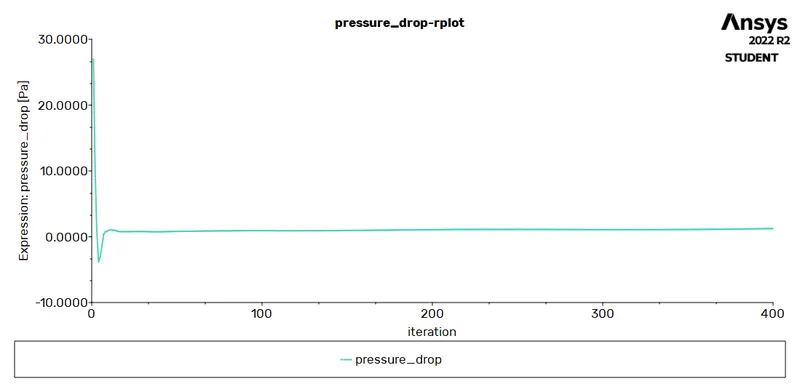
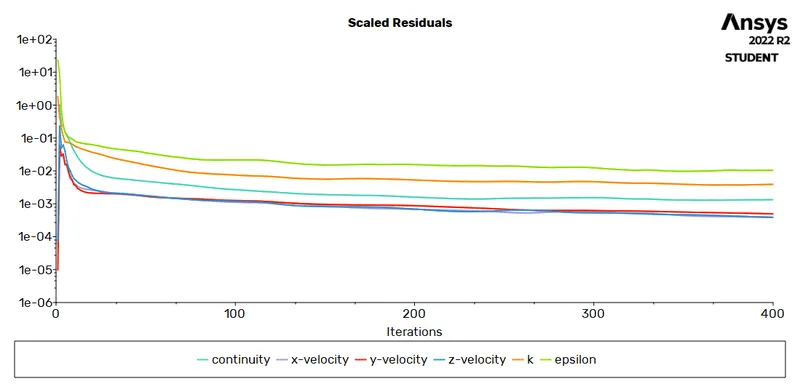
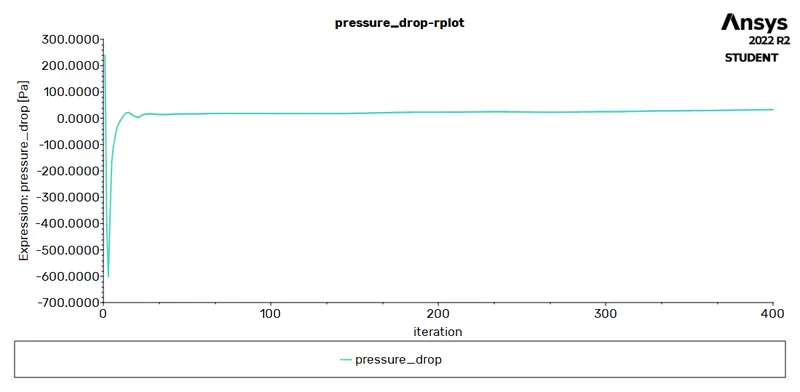
The steady-state pressured-based PV SIMPLE scheme was used to discretize the flow parameters. The discrete phase model was enabled for particle tracking with a step length factor of 5. Turbulence in the flow was predicted using the two-equation K-Epsilon RNG model which better captures swirling flows. The second order scheme was used to estimate the pressure and the second order upwind scheme was used to estimate momentum and turbulence parameters. The solution was initialized by a standard initialisation using the boundary conditions of the inlet. Convergence was checked by the scaled residuals to reach 1e-2 and the variations in the pressure drop not exceeding 1e-3 units across iterations. Simulations typically took 400 iterations to achieve convergence.
Results
Part 1
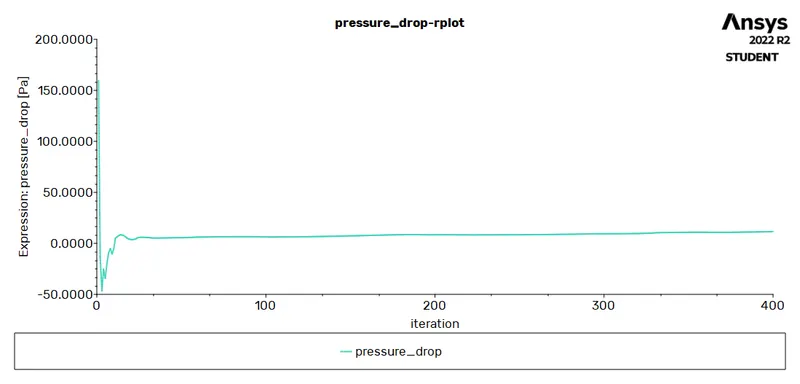
In the first analysis, the velocity of the inlet and particles were maintained at a constant 3m/s while the particle diameter was varied to 1, 3 and 5 micrometres.
Convergence
Case 1: 1`mu`m @ 3 m/s
The images below show the scaled residuals and the pressure drop across iterations to assure solution convergence.
Case 2: 3`mu`m @ 3 m/s
The images below show the scaled residuals and the pressure drop across iterations to assure solution convergence.
Case 3: 5`mu`m @ 3 m/s
The images below show the scaled residuals and the pressure drop across iterations to assure solution convergence.
Particle Track Comparisons of the three cases:
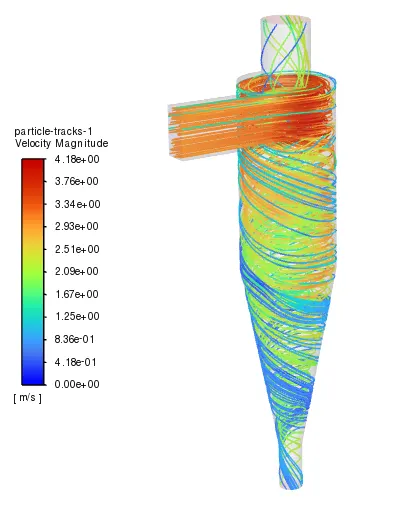
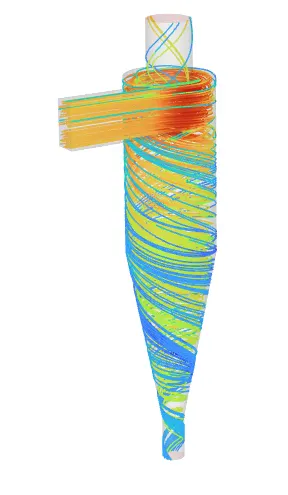
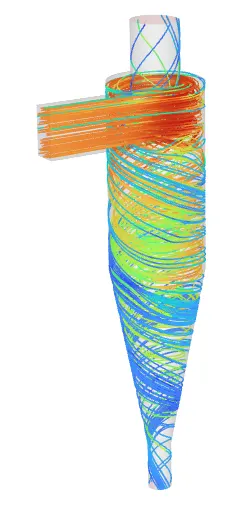
The image below shows the particle track coloured by the velocity of the various cases.
Case 1 Case 2 Case 3
From the image, it can be seen that case 1 has the highest amount of escaped particles while case 3 has the lowest. This is a direct correspondence to the size of the particles as their inertia is much higher in case 3 as compared to case 1.
The table below details the cyclone separator efficiency and pressure drop
| Case No. | Particle Size | Particles Tracked | Particles Trapped | Particles Escaped | Separation Efficiency | Pressure Drop |
| 1 | 1e-6m | 744 | 565 | 179 | 75.94% | 11.496 Pa |
| 2 | 3e-6m | 744 | 579 | 165 | 77.82% | 11.496 Pa |
| 3 | 5e-6m | 744 | 641 | 103 | 86.15% | 11.496 Pa |
From the table, it is clear that the separation efficiency is highest for case 3 with the largest particle size which is reflected in the qualitative particle track images as well. The pressure drop on the other hand is seen to be undisturbed by the variation in the particle sizes.
Part 2
In the second analysis, the particle diameter was maintained at a constant 5micrometres while the velocity of the inlet and particles was varied to 1, 3 and 5 m/s.
Convergence
Case 1: 5`mu`m @ 1 m/s
The images below show the scaled residuals and the pressure drop across iterations to assure solution convergence.
Case 2: 5`mu`m @ 3 m/s
The images below show the scaled residuals and the pressure drop across iterations to assure solution convergence.
Case 3: 5`mu`m @ 5 m/s
The images below show the scaled residuals and the pressure drop across iterations to assure solution convergence.
Particle Track Comparisons of the three cases:
The image below shows the particle track coloured by the velocity of the various cases.
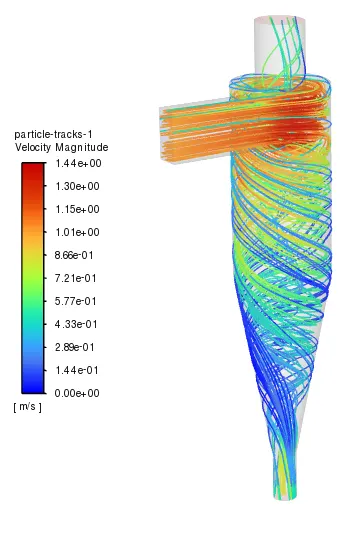
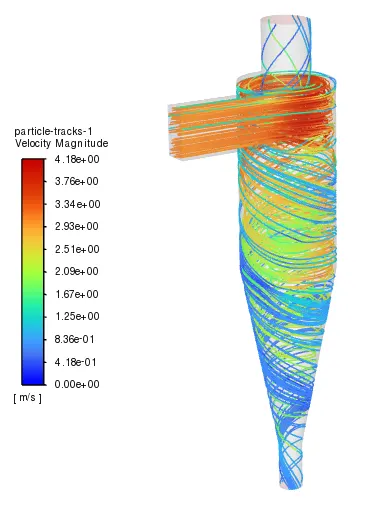
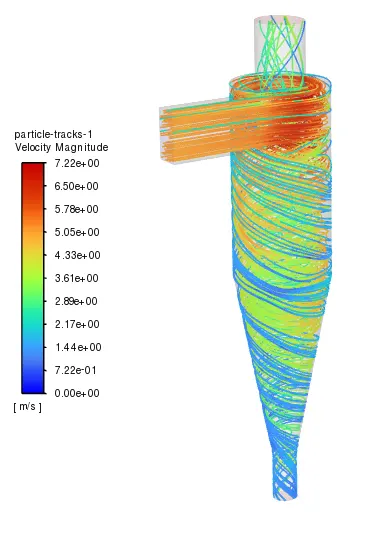
Case 1 Case 2 Case 3
From the image, it can be seen that case 1 and 3 have the highest amount of escaped particles while case 2 has the lowest. A detailed view of the pressure drop in the cases can better explain the reasons for this difference.
The table below details the cyclone separator efficiency and pressure drop for a particle size of 5 `mu`m
| Case No. | Particle Velocity | Particles Tracked | Particles Trapped | Particles Escaped | Separation Efficiency | Pressure Drop |
| 1 | 1m/s | 744 | 551 | 193 | 74.06% | 1.244 Pa |
| 2 | 3m/s | 744 | 641 | 103 | 86.15% | 11.496 Pa |
| 3 | 5m/s | 744 | 549 | 195 | 73.79% | 32.740 Pa |
From the table, it is clear that the separation efficiency is highest for case 2. The pressure drop is seen to be the highest in case 3 with the highest velocity. The high separator efficiency seen in case 2 can be attributed to the lower pressure drop compared to case 3 and higher flow velocity compared to case 1.
Conclusion
A numerical study was performed on the given Cyclone separator with velocities varying from 1, 3, 5 m/s and partical sizes from 1,3 and 5 micrometres. A qualitative study was conducted using particle track lines to visualise the flow and particles that escaped. Cyclone separator efficiency and pressure drop were evaluated for each case for quantitative comparison. It was seen that increasing particle size increased the cyclone separator efficiency and had no impact on the pressure drop. Increasing the velocity of the flow showed an increase in pressure drop. The study showed that an optimum velocity of 3m/s produced a high separator efficiency while still maintaining a lower pressure drop.
References
- Gimbun, Jolius & Luqman Chuah, Abdullah & Choong, TSY & Fakhru'l-Razi, A.. (2005). A CFD Study on the Prediction of Cyclone Collection Efficiency. International Journal for Computational Methods in Engineering Science and Mechanics. 6. 161-168. 10.1080/15502280590923649.