Week 8:Centrifugal pump simulation
Title: Centrifugal pump simulation
Aim:
- To run simulation for 3 mass flow rates (130 kg/sec, 156 kg/sec and 180 kg/sec)
- To obtaine plot of total pressure ratio Vs mass flow rate
- To obtain pump efficiency.
Theory:
Centrifugal pump is a device used to lift liquid from lower elevation to higher elevation by increasing pressure of fluid by a rotating device called impeller inside a centrifugal pump. Centrifugal pump has following parts.
1. Impeller: Rotating part used to impart pressure energy to a fluid.
2. Casing: Casing is volute in shape and designed in a such way that, it converts kinetic energy to pressure energy.
3. Suction pipe: Through which water enters from sump to eye of impeller.
4. Delivery pipe: Through which water flows from eye of impeller to point where it is needed.
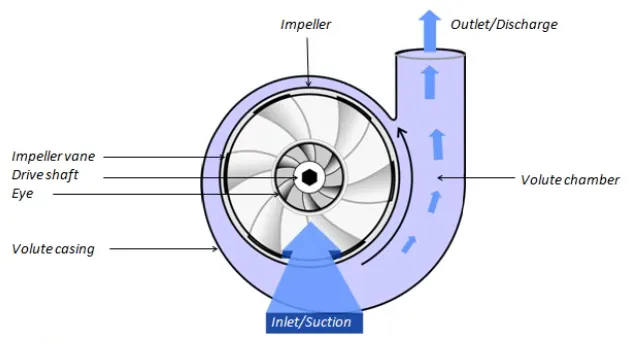
Figure: Cross-section of impeller
1) Simulation with mass flow rate of 130 kg/sec
Geometry:
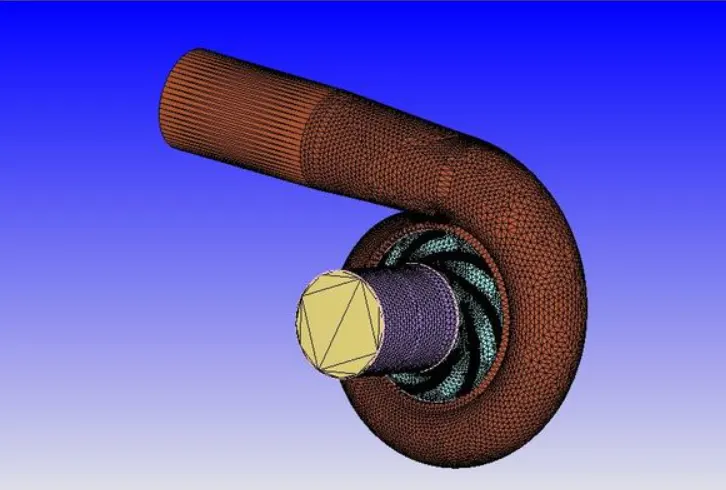
Boundary flagging
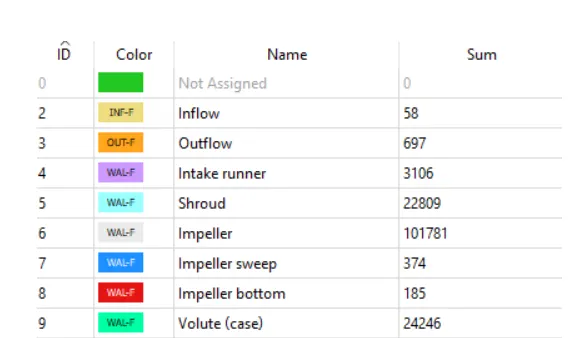
Mesh:
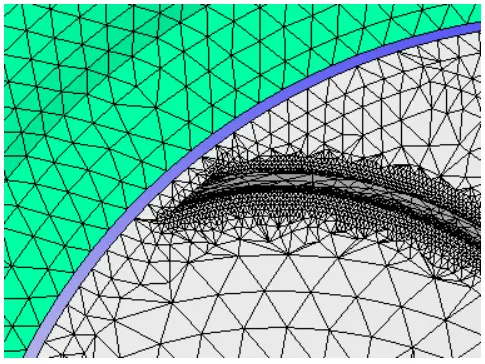
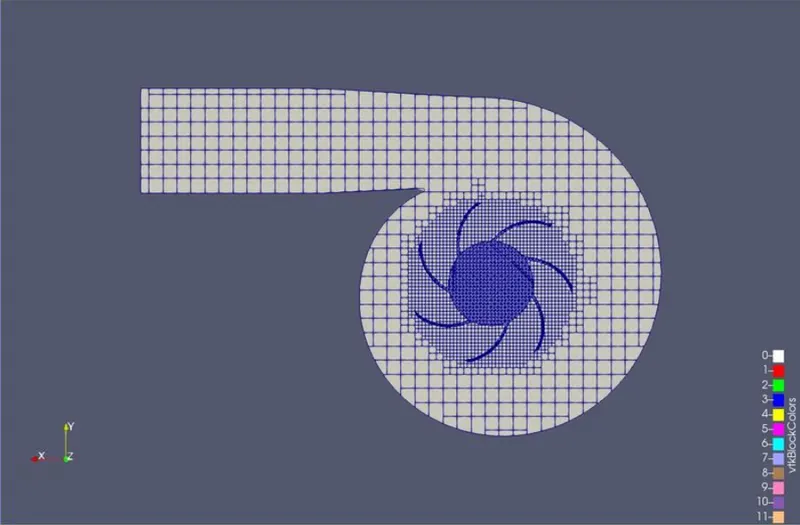
Base mesh size is 0.012 m. AMR is also used which gave fine mesh near impller as can be seen.

Boundary conditions:
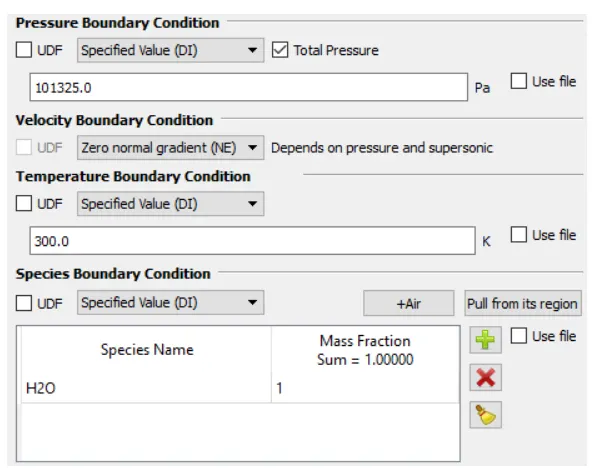
Inlet
Inflow boundary
Pressure = 101325 Pa
Temperature = 300 K
Species: Water
Outlet
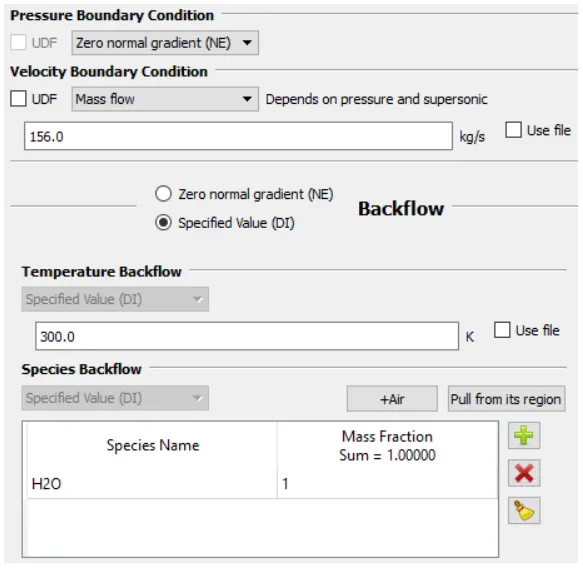
Outflow boundary
Mass flow rate = 130 kg/sec
Temperature = 300 K
Species: Water
Shroud
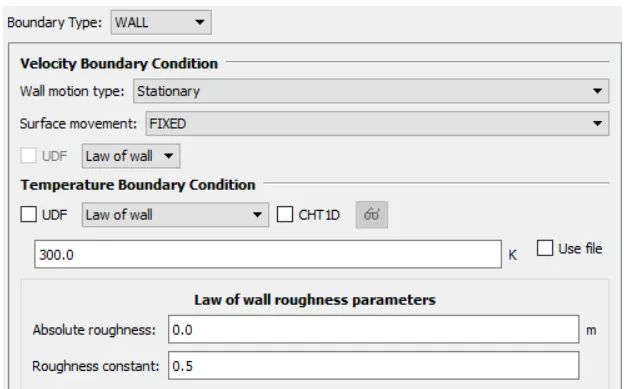
Wall boundary
Wall motion = Stationary
Motion = Fixed
Temperature = 300 K
Impeller
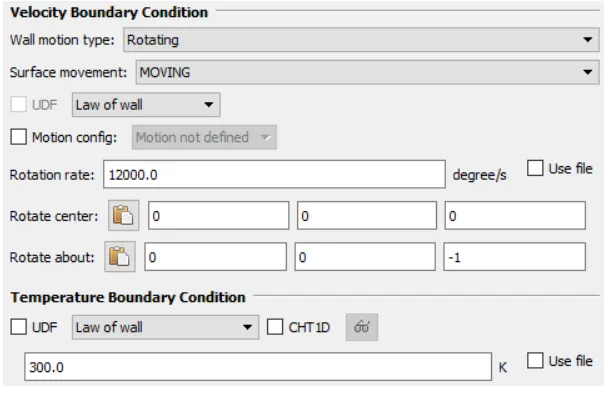
Wall boundary
Wall motion = Rotating
Movement = Moving
Temperature = 300 K
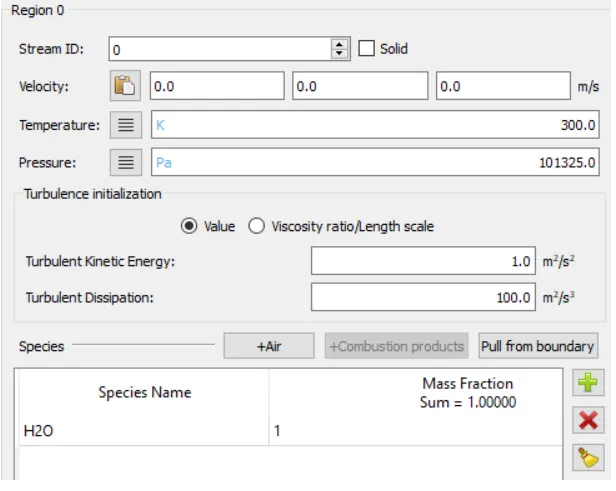
Initial Conditions:
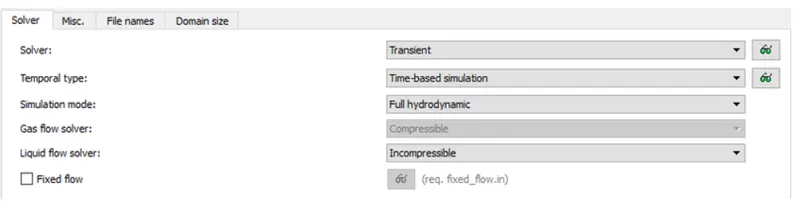
Simulation and time parameters:
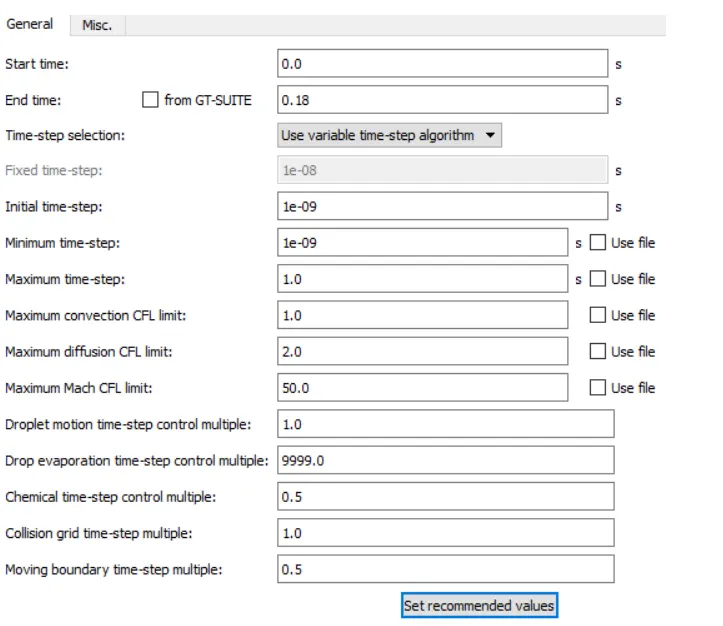
End time:
Results:
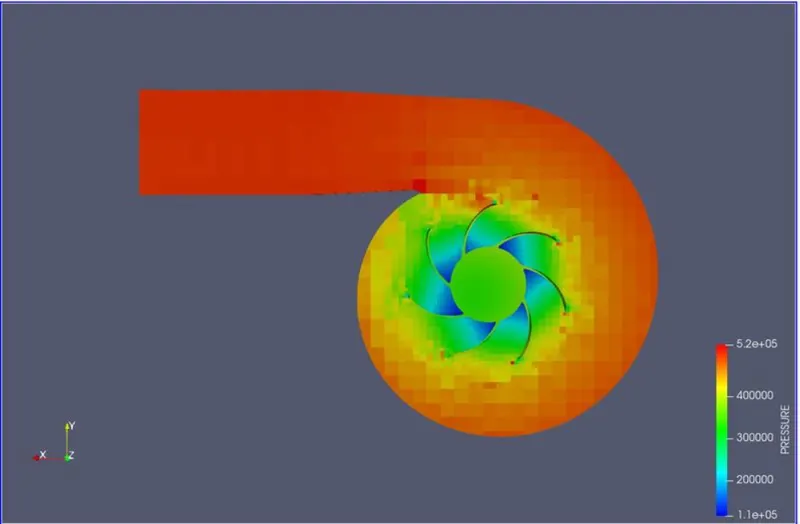
Pressure contour plots
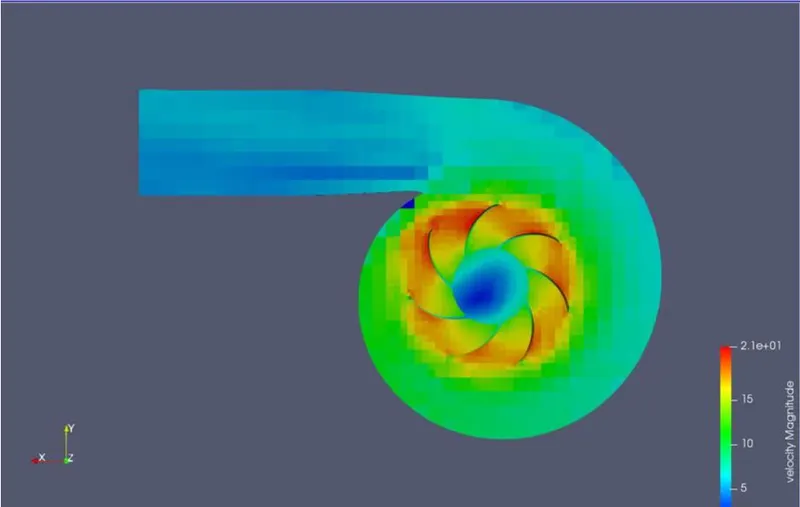
Velocity contour plots
Pressure plot
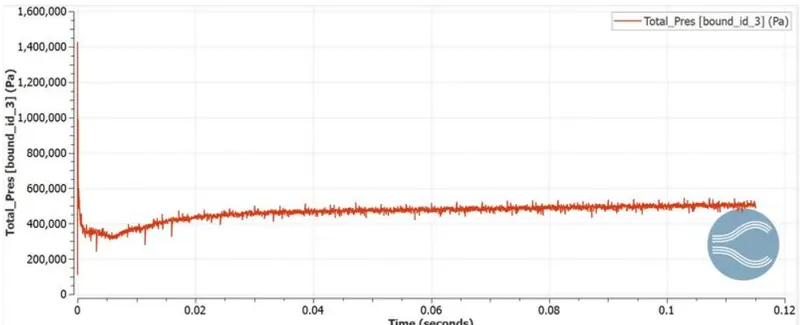
Outlet pressure at outlet is found to be 511025 bar.
Velocity plot
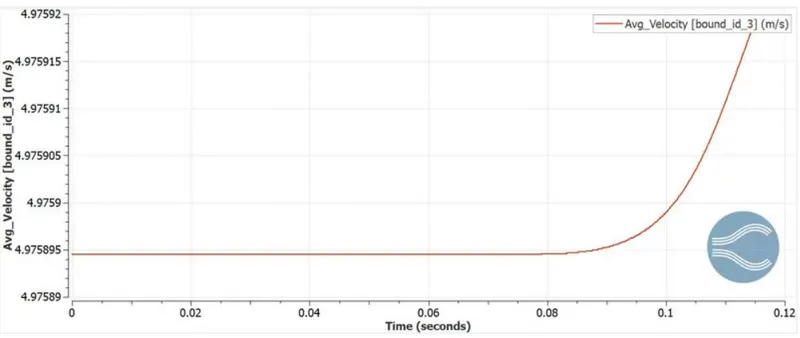
There is increased in veocity upto 4.97592 m/sec.
Cell count
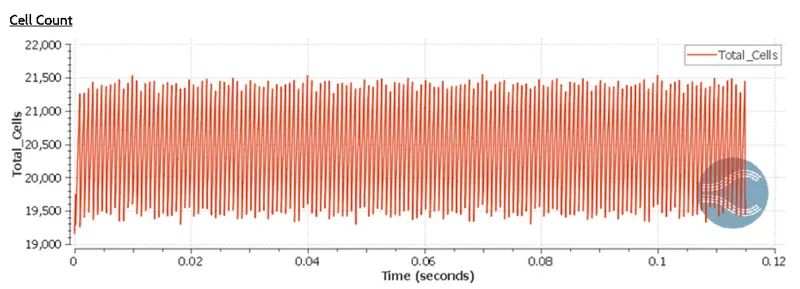
Maximum cell count was observed to be 21500.
2) Simulation with mass flow rate of 156 kg/sec
Geometry
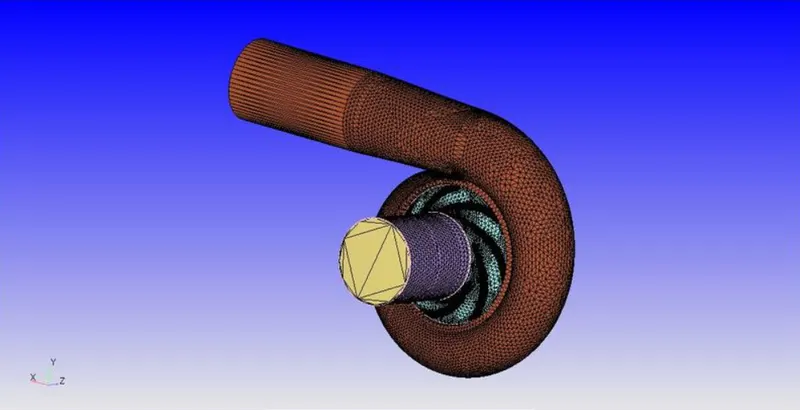
mesh
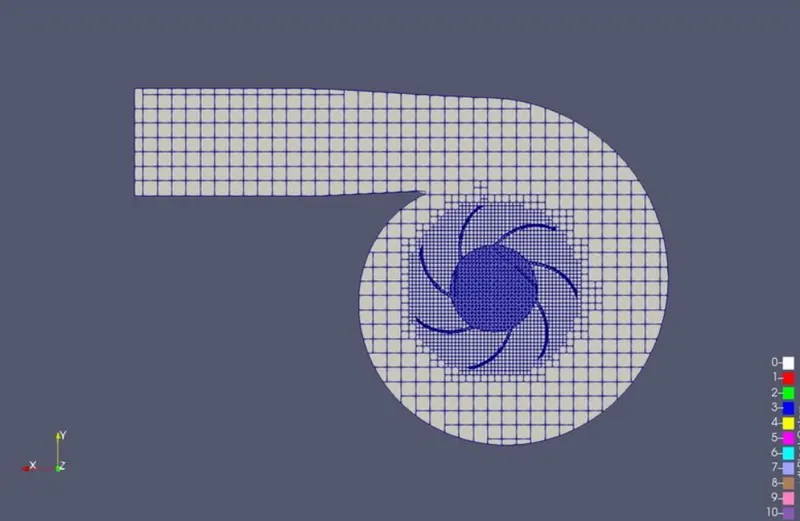
Base mesh size is 0.012 m. AMR is also used which gave fine mesh near impller as can be seen.
Boundary conditions:
Inlet
Inflow boundary
Pressure = 101325 Pa
Temperature = 300 K
Species: Water
Outlet
Outflow boundary
Mass flow rate = 156 kg/sec
Temperature = 300 K
Species: Water
Shroud
Wall boundary
Wall motion = Stationary
Motion = Fixed
Temperature = 300 K
Results
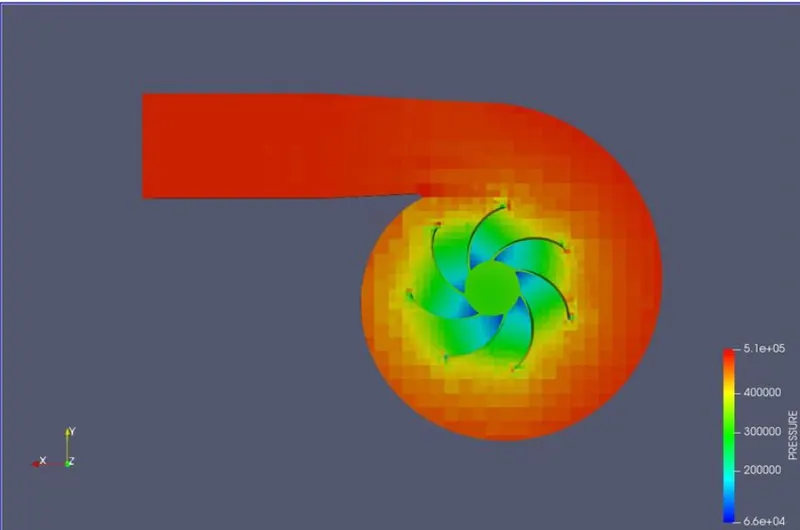
Pressure contour
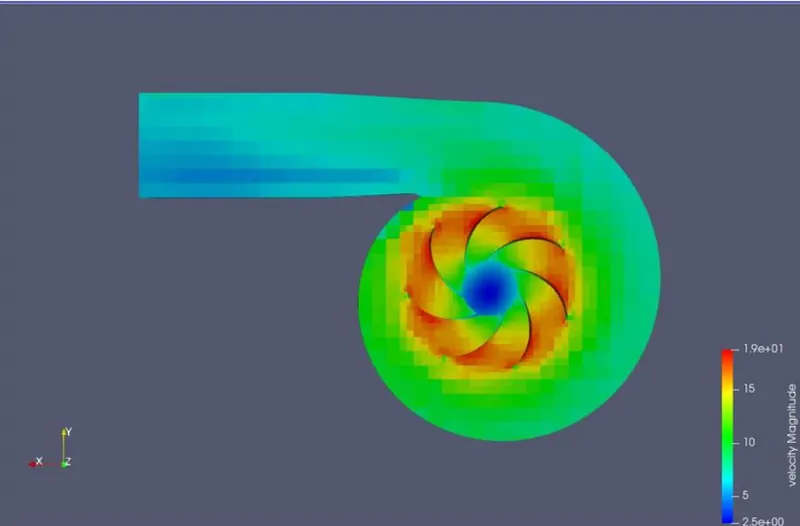
Velocity contour
Pressure plot
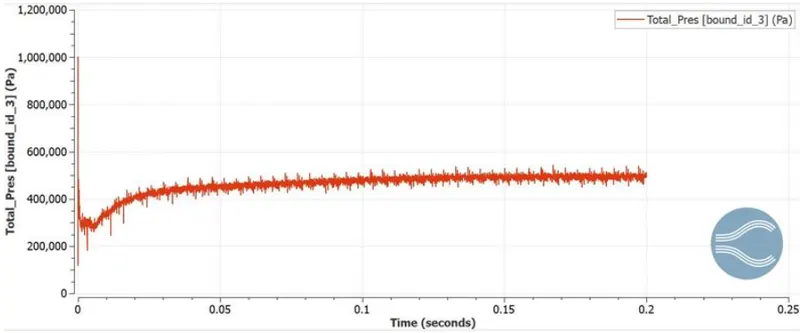
Outlet pressure at outlet is found to be 499508 bar.
Velocity plot
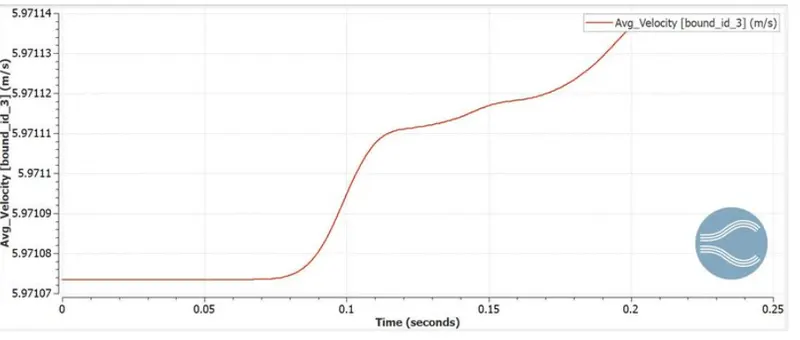
There is increased in veocity upto 5.97114 m/sec.
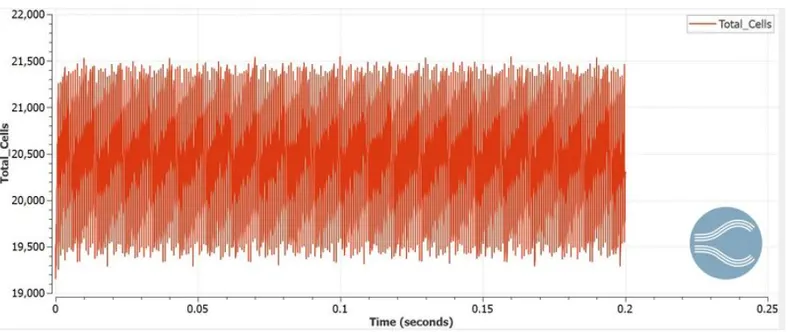
Maximum cell count was observed to be 21500.
3) Simulation with mass flow rate of 180 kg/sec
Geometry
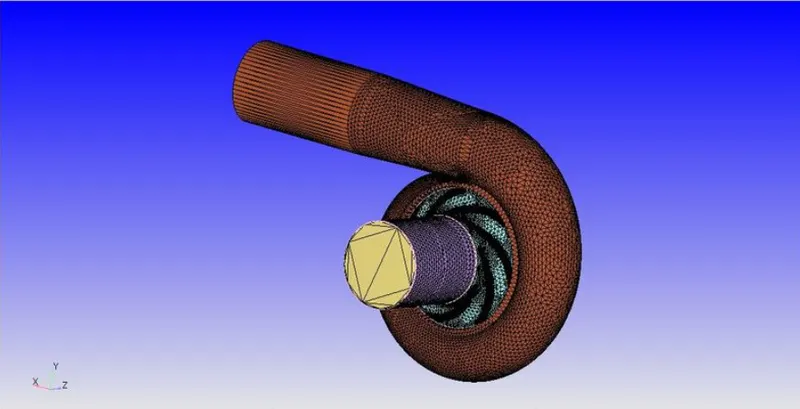
Mesh
Boundary conditions:
Inlet
Inflow boundary
Pressure = 101325 Pa
Temperature = 300 K
Species: Water
Outlet
Outflow boundary
Mass flow rate = 180 kg/sec
Temperature = 300 K
Species: Water
Shroud
Wall boundary
Wall motion = Stationary
Motion = Fixed
Temperature = 300 K
Results
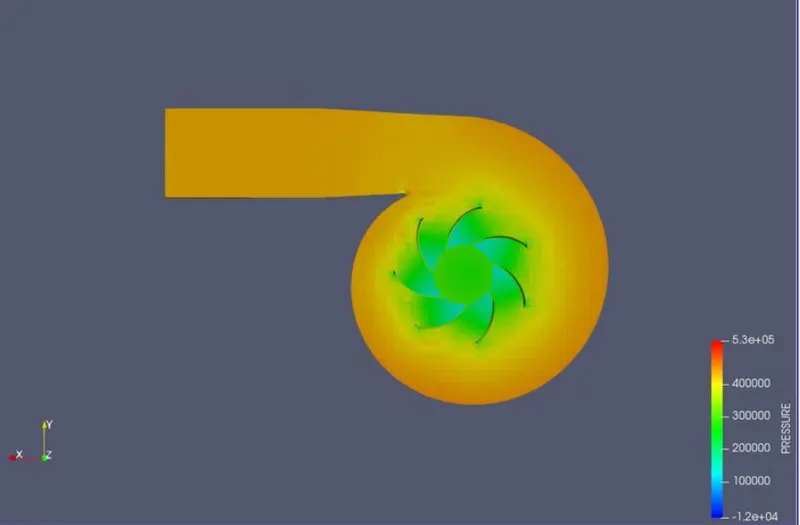
Pressure contour
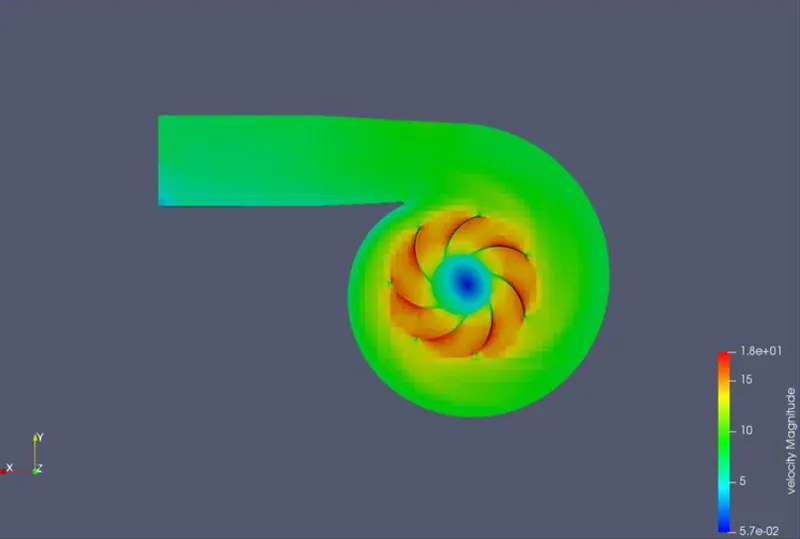
Velocity contour
Pressure plot
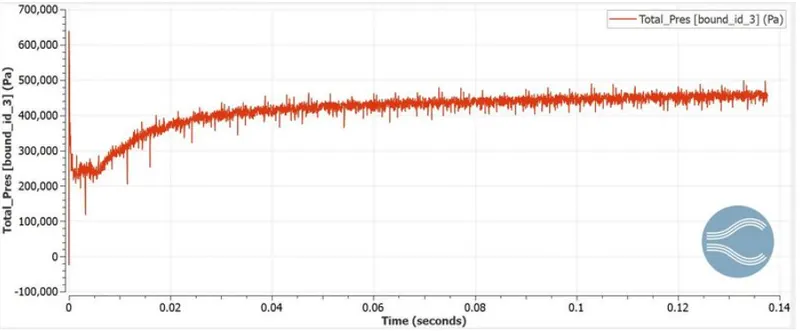
Outlet pressure at outlet is found to be 450554 bar.
Velocity plot
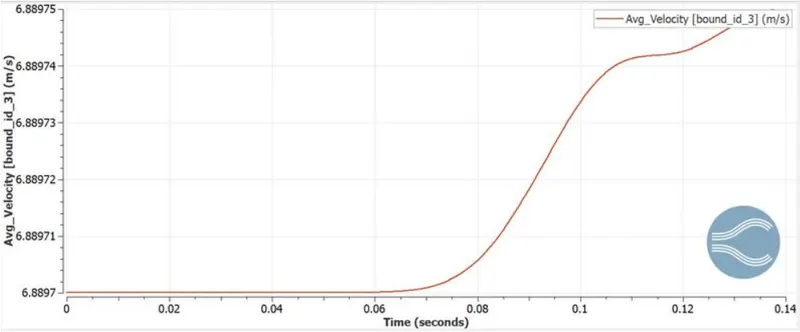
There is increased in veocity upto 6.88975 m/sec.
Cell count
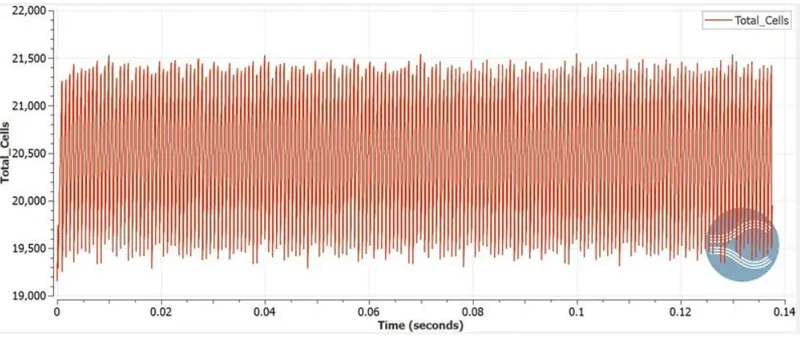
Maximum cell count was observed to be 21500.
Results and conclusions
- Maximum cell count is found to be 21500
- Velocity is found to be maximum at blade tip and reducing along volute casing.
- Pressure is minimum at eye of impeller and goes on increasing along volute casing. At pump flow exit pressure is higher.