Week 7 State of charge estimation
**This assignment is for the 13th batch live session**
AIM:
1. To Simulate the 3 test cases from the harness dashboard and write a detailed report on the results for the given MATLAB model.
2. What is coulomb counting? Refer to the above model and explain how BMS implements coulomb counting for SOC estimation?
SOLUTION:
Battery management system (BMS):
It is an electronic system that manages a rechargeable battery (cell or battery pack), such as by protecting the battery from operating outside its safe operating area, monitoring its state, calculating secondary data, reporting that data, controlling its environment, authenticating it, and balancing it.
Test Harness:
To Create a test-specific simulation environment for the model we use a test harness method.
Here, we isolate the individual blocks for unit testing and add inputs, verification logs, and dashboard blocks, and perform closed-loop testing by adding physical plant models to the test harness Test.
Below is the link for the project model which we have considered to study and understand its behavior,
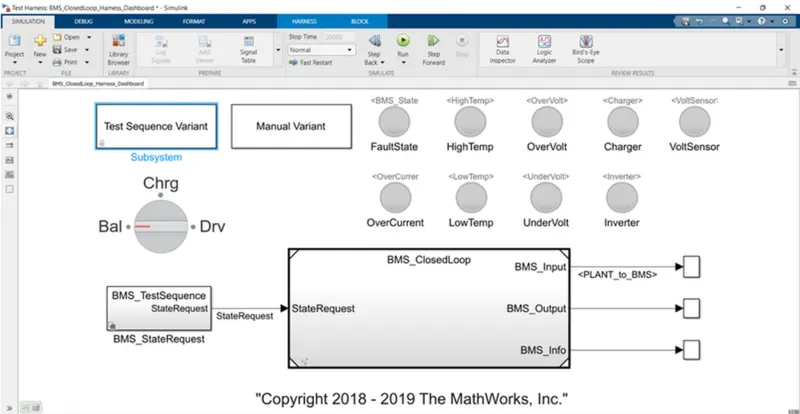
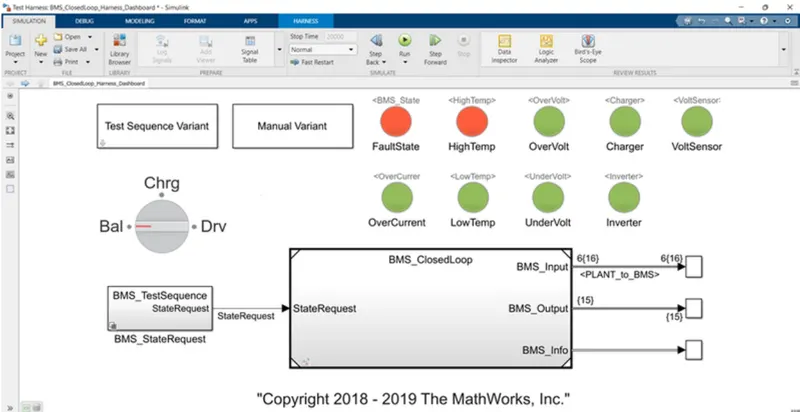
DASHBOARD:
COMPONENTS OF THE SYSTEM:
* Lamps to indicate fault state high temperature, over current, charging voltage, sensor operation, low temperature, and under-voltage. If any fault in these read induction will intimate us and all in good conditions indicated by green indication.
* Manual variant
* Rotating switch for manual variant changes while running simulation
* BMS Test sequence state request to provide state request commands
* Test sequence variant
BMS Closed Loop:
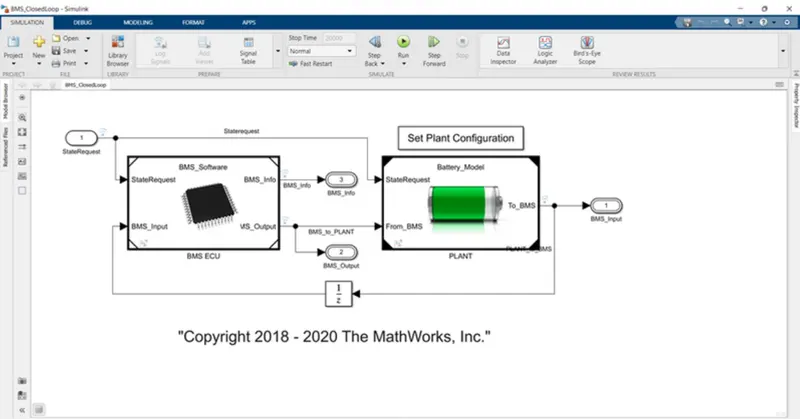
This main block consists of two subsystems BMS ECU and Plant units The plant output from the plant unit is given as input to BMS ECU as the BMS input feedback loop the state request is given to the BMS ECU unit The BMS output commands are given as input to the plant unit as From BMS the state request is given to plant unit The final outputs from closed-loop model are BMS input, BMS output, BMS information.
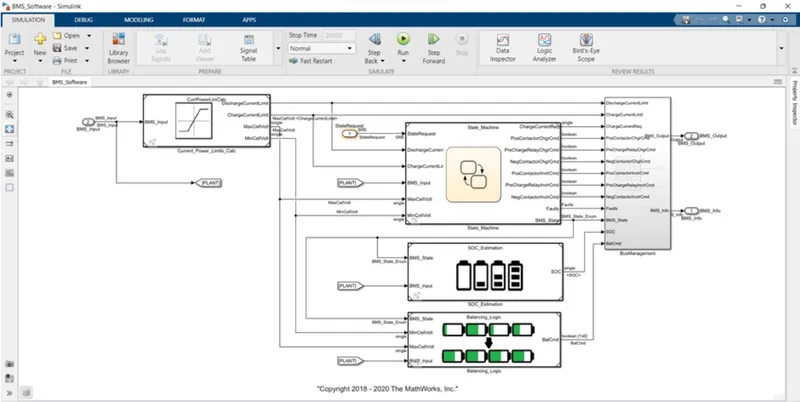
In the BMS ECU unit, the current power limit calculations are done used in state machine block Soc estimations cell balancing logic as shown below;
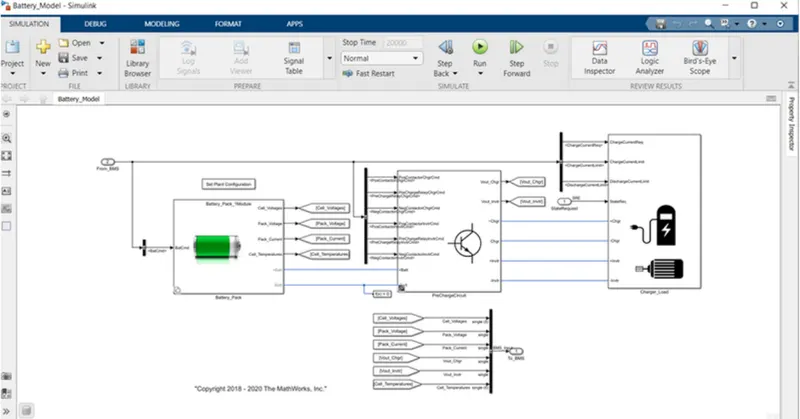
In the plant unit, the battery pack unit Per charger unit and charger load units are created
In the battery pack, there are two types of configurations
1 module with 6 cells and
16 modules with 95 cells
Here we are choosing 1 module for lesser simulation running time.
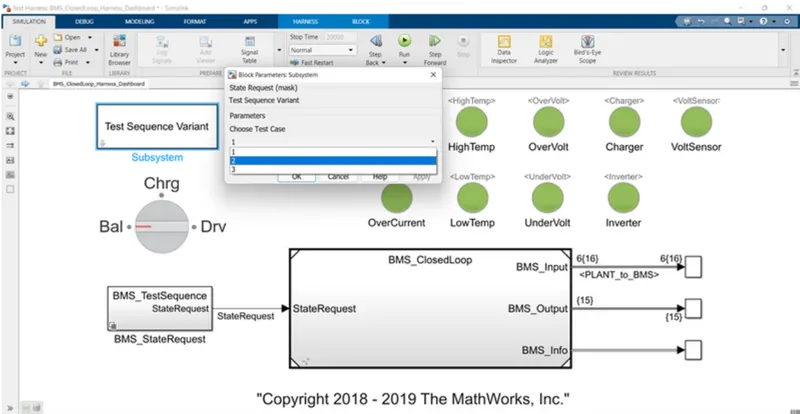
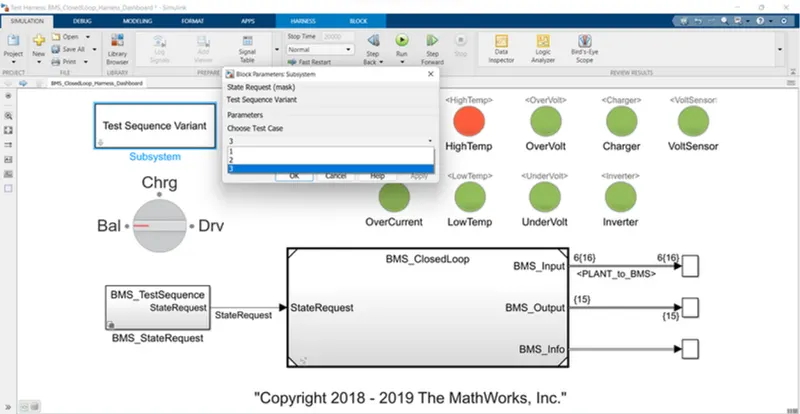
To run three test cases from the harness dashboard of closed-loop BMS control, We have to test three cases for this model by selecting the test sequence variant and select the cases one by one as follows;
Drive cycle link:
Test case: 1
Select from the test sequence variant dialog box and click apply as shown below;
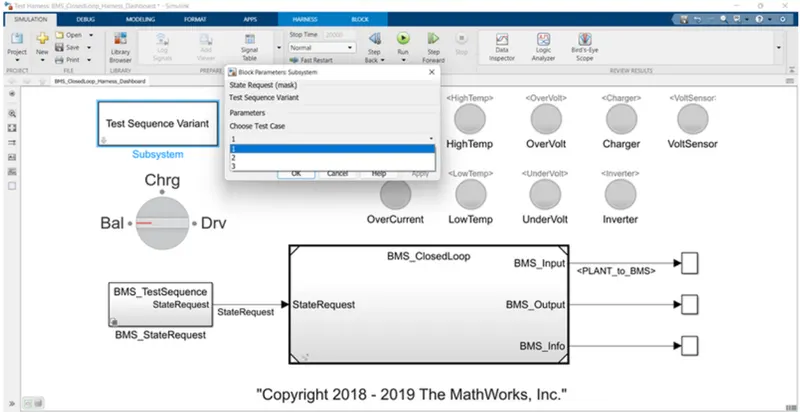
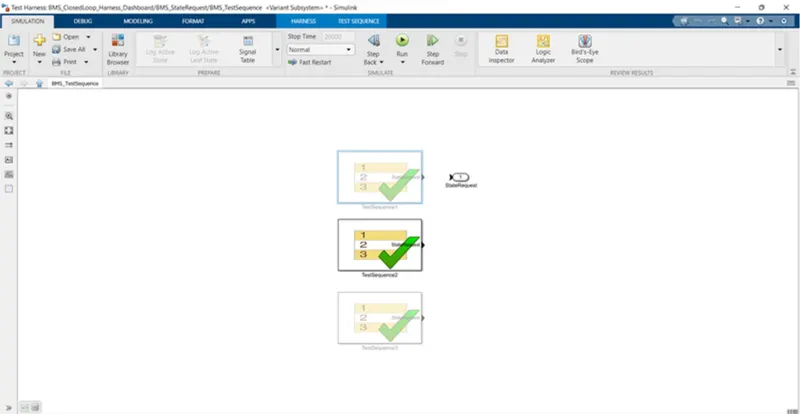
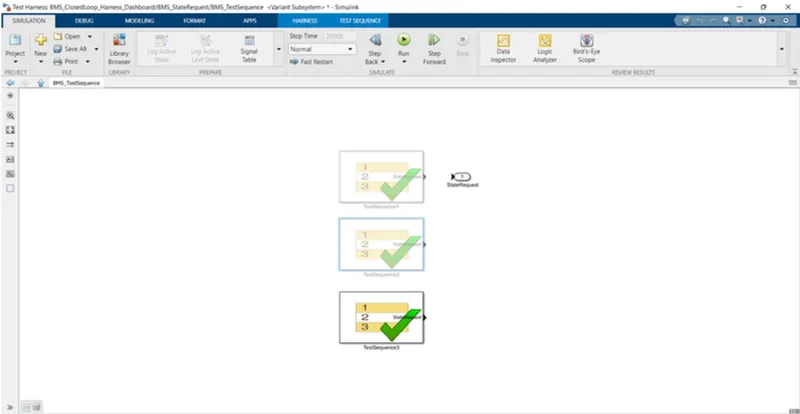
Here the selection changes are marked as BMS state requests and made as a subsystem.
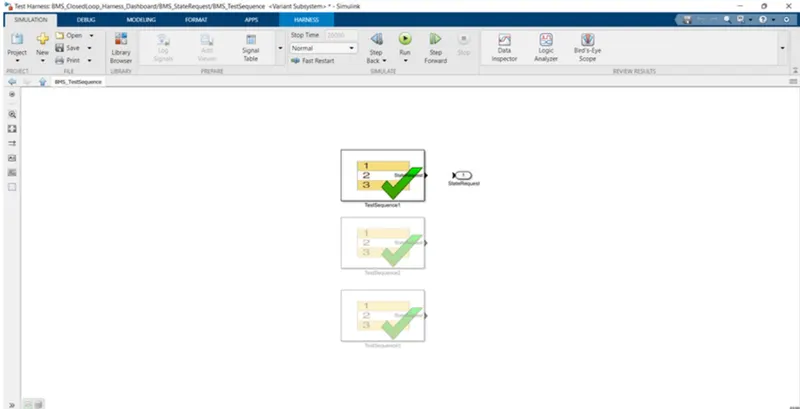
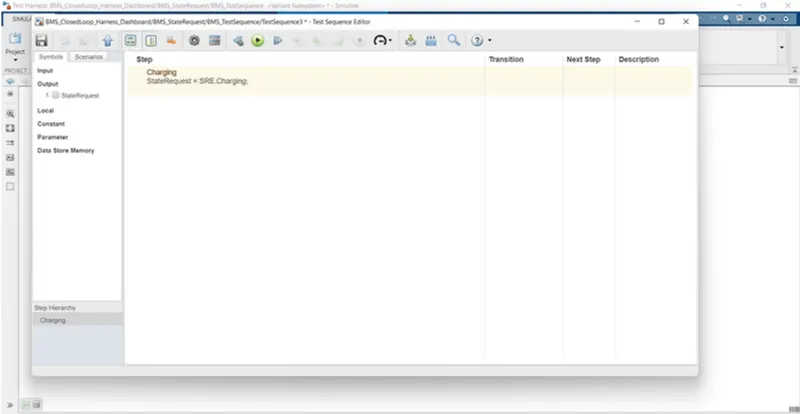
This test case consists of the following sequences;
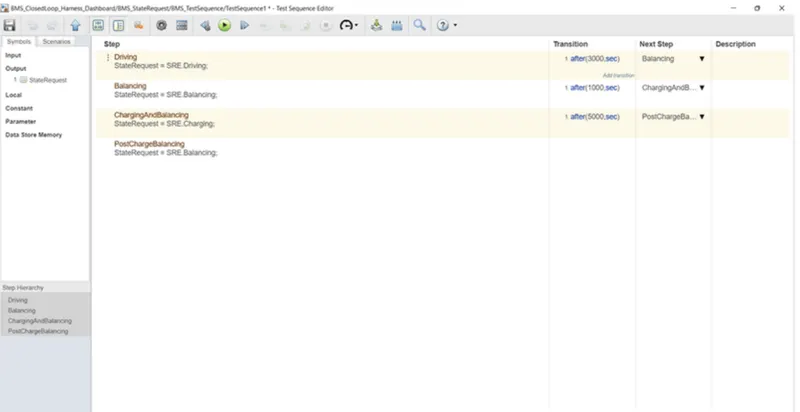
Here from the above test sequence editor figure, the following changes have been made;
1. Driving for the first 3000 secs
2. After 3000 sec starts balancing operations occur for the next 1000 secs
3. Then charging and balancing occurs for the next 5000 secs 4. After that sequence post charge, a balancing operation occurs till the end of the simulation period.
OUTPUTS:
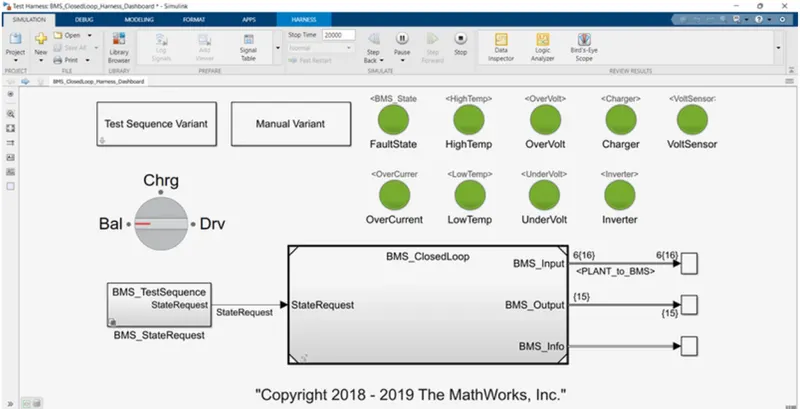
The lamp indication is showing green for the overall simulation period showing that there are no faults occurs the sequence.
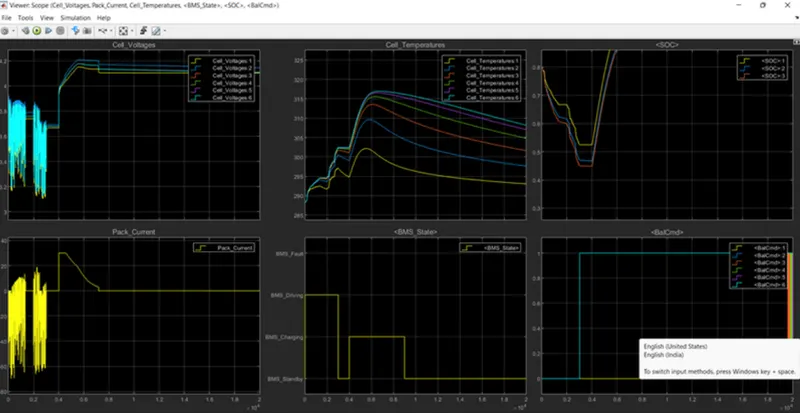
OBSERVATION:
1. Cell voltage and pack current:
For the first 3000 secs, all 6cells are drive models where discharging occurs majorly and in standby mode for a lesser duration at approximately 1000 to 2000 sec.
The voltage varies from 3.1 V to 3.9V in this range.
From 3000sec to 4000sec cell balancing occur and at this stage, the module is in standby mode and the voltage is constant at nearly 3.7V After 4000sec charging occurs voltage raised from 3.7V to 4V at 4V to 4.2V constant voltage current is reduced from 30A to 2.6A At end of the charging and cell balancing occurs up to 9000sec.
After 9000sec post charge, cell balancing starts, and all cell voltage is balanced to a voltage concerning cells 1 to 4V.
2. CELL Temperature:
Initially, for 3000sec the temperature range of cells increases gradually from ambient temperature 288k to 302k.
The temperature of the cell is lesser and cell 6 has a higher temperature for all stages.
After 4000sec, the temperature starts to increase exponentially up to constant voltage and cell balancing region up to 9000sec.
A single cell temperature raised to 302k and cell 6 temperature raised to 317k after 9000sec the temperature still reduce and remains stable at reaching ambient temperature.
3. BMS states:
For 3000sec the battery module is in drive mode
From 3000sec to 4000sec the battery module is in balancing standby mode.
After 4000sec up to 9000sec, the battery module is in charging and balancing mode
After 9000sec, only post charge balancing mode operates up to the end of the simulation.
4. SOC:
Initially, the state of charge of the battery module is at 80%
Here, the yellow plot represents SOC estimation done by the coulomb counting technique.
The blue plot represents SOC estimation using the Kalman filter technique
The red plot represents SOC estimation using the extended Kalman filter technique.
Initially, for 3000sec, SOC decreases to nearly 45% during drive mode
After 3000sec up to 4000sec the SOC is constant and 45% cell balancing occurs in standby mode.
From 4000sec to 9000sec, the module is in charging mode.
TEST CASE: 2
STEP:1:
OBSERVATION:
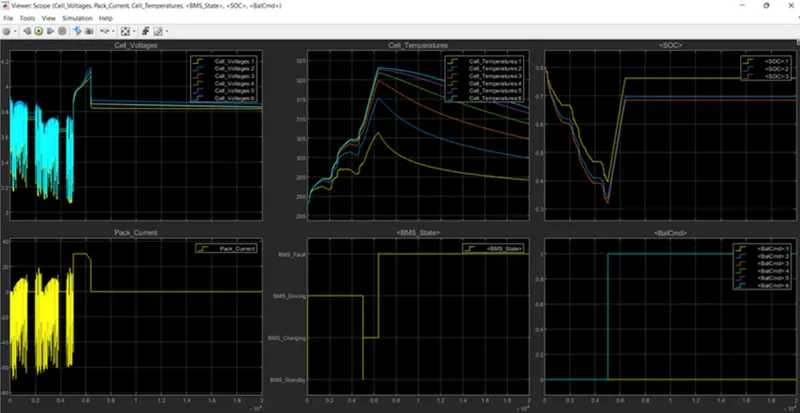
Cell voltage and pack current:
The cell voltage varies from a maximum of 3.9V and reduces to 3.05V as cut-off voltage up to 9000sec entire capacity drained at 9000sec. the pack current discharge up to a maximum 70A and slight charging occurs during the over al drive. Some standby mode conditions are in between the drive mode
Cell Temperature
Here cell 1 lesser temperature variant from 288K to approximately 302.5K cell 6 in having a temperature vary from 288K to approximately 322.5K. the cell temperature is slightly reduced in between drive mode as this duration is on stand by
Battery Module State:
The entire sequence is performing in drive mode as shown in the plot. Small duration of stand by modes are rot piloted in this plot simulation 10000sec command is given as drive mode but in actual practical situation standby mode are present battery current drains by other small or Es
SOC of Module Here the SOC reduces from 80% to 0% in the entire drive mode as shown above plot at stand-by modes hat the SOC remains constant.
TEST CASE:3
STEP:1
OBSERVATION:
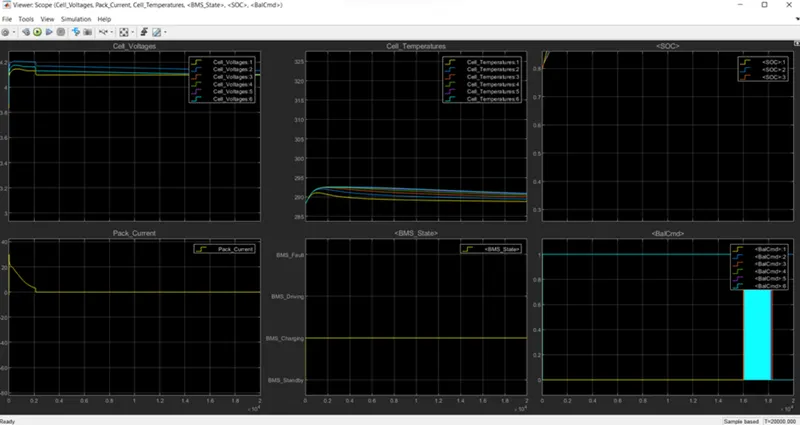
Cell voltage and pack current:
Initially, cell 2 voltage rises from 3.9V to a maximum of m 4.2V and stabilized to 4.15V cell 1 rise from 3.85V to 4.1V and stabilized to 4.08V The battery pack current raising from OA to30A and starts to reduce to 2.5A gradually at the end to full charging 2000sec. after full charge current flow will be cut off as shown in the result plot Cell voltage and pack current: Initially cell2, the voltage rises from 3.9V to a maximum of 4.2V and stabilized to 4.15V Cell rises from 3.85V to 4.1V and stabilized to 4.08V The battery pack current raising from OA to 30A and start to reduce to 2.5A gradually at the end to full charging up to 2000ses. At 2000sec the pack is fully charged to 100% After full charge current flow will be cut off as shown in the resulting plot
Cell Temperature:
The cell temperature continues to increase heat up to full charge and after that, the temperature gets started to reduce to ambient temperature As shown from the resulting plot the temperature starts to decrease after the full charger
BMS state:
The entire battery pack sequence is operating in charging mode.
SOC:
The pack soc gets fully charged at 2000sec and remains at full charge for the rest of the sequence as shown above The actual state of charge is around 93% shown as full charge shown by UKF and EKF techniques
Cell balancing:
Cells 6 and 2 starts to balance concerning cell 1 and all cells are trying to balance at end of the simulation.
2. coulomb counting:
Coulomb counting is a technique used to track the state of charge of a battery pack.
It works by integrating the active flowing current (measured in amps) over time to derive the total sum of energy entering or leaving the battery pack. this produces a capacity that is typically measured in amp-hours[Ah]
The coulomb counting method measures the discharging current of a battery and integrates the discharging current over time to estimate SOC.
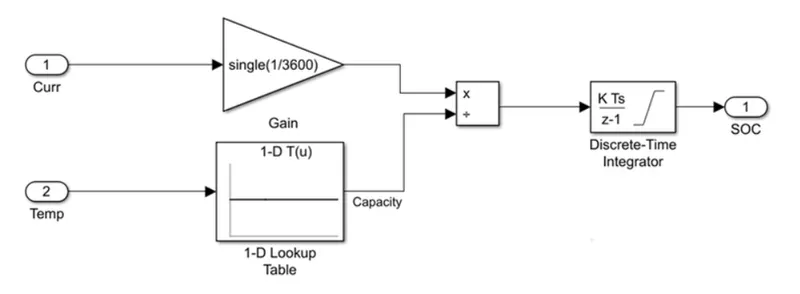
It’s done to estimate the SOC(t) which is estimated from the discharging current I(t) and previously estimated SOC values Soc(t-1). SOC is calculated by the following equation;
soc(t)=soc(t-1) + [I(t)/Qn]*dt
where,
SOC(t)= state of charge at the estimated time.
I(t)= discharging current.
Qn= nominal battery capacity