Project 1 - Parsing NASA thermodynamic data
AIM: To write a function that extracts the 14 coefficients and calculates the enthalpy, entropy, and specific heats for all the species in the given data file.
This report is regarding MATLAB CODE for parsing the NASA thermodynamic data about species, extracting the 14 coefficients of the individual species, determining the specific heat, enthalpy, entropy of species, and calculating molecular weight of the species from the given data file.
In addition, plotting the Specific Heat, Enthalpy, Entropy with respect to local temperatures and saving the images of the plots in the individual folder with species names.
MATLAB code is developed for the user to input his choice of species for retraining their plots. The step-by-step code generation in MATLAB and logic is explained and errors appeared during the process of successful execution of code and steps are taken to resolve them.
THEORY OF DATA PARSING: It is a method of converting one string of data into other categories of data based on user choice. It is also defined as input analysis to organize data.
Originally, parsing is essential because different entities need the data in different forms. Parsing permits transmute data in a way that can be acknowledged by software. IThe universal particular example is programs -which are written by humans and executed by computers. Here, people scribe them in a form that they perceive, then software transforms them in a way that can be used by a Computer.
NASA Thermodynamics Data: The National Aeronautics and Space Administration is USA's independent agency that came up with thermodynamic data for individual species that are necessary for accomplishing equilibrium chemistry and finite-rate chemical kinetics calculations.
This data commonly provides the thermodynamic properties (enthalpy, entropy, and specific heat) of a species as a function of temperature which is determined from coefficients present in the data.
Thermodynamic data for individual species are essential in many chemical reaction applications. For more than a half-century, the NASA Lewis (Currently Glenn) Research Centre has been compiling and disseminating thermodynamic data utilization in its chemical equilibrium programs. This data is comprehensively used by the thermodynamic community across the globe.
Initially, the data had 42 species and now it's been accumulated to more than 2000 species. This report utilized some of the thermodynamic data used in the NASA Glenn computer program CEA (Chemical Equilibrium with Applications).
The original NASA CEA program consists of more than 2000 solid, liquid, and gaseous chemical species with their temperatures ranging from 200 to 20 000 K. The data are expressed as least-squares coefficients to a seven-term functional form for specific heat with respect to temperature by Universal gas constant with integration constants. The NASA Glenn computer program PAC (Properties and Coefficients) was used to calculate thermodynamic functions and to generate the least-squares coefficients. Pac input was taken from a wide range of sources.
The following are three equations. The NASA polynomials have the form:
Cp/R = a1 + a2 T + a3 T^2 + a4 T^3+ a5 T^4
H/RT = a1 + a2T /2 + a3 T^2 /3 + a4T^3/4 + a5 T^4 /5 + a6/T
s/R = a1lnT + a2T + a3 T^2 /2 + a4 T^3 /3 +a5 T^4/4 + a7
where a1, a2, a3, a4, a5, a6, and a7 are the numerical coefficients supplied in NASA thermodynamic files. The first 7 numbers starting on the second line of each species entry (five of the second line and the first two of the third line) are the seven coefficients (a1 through a7, respectively) for the high-temperature range (above 1000 K, the boundary upper is specified on the first line of the species entry). The following seven numbers are the coefficients through a7, (a1 respectively) for the low-temperature range (below 1000 K, the lower boundary is line of specified on the first the species entry).
Cp = Specific heat of the species in (J/kg K)
H = Enthalpy in (J/kg)
S= Entropy in (J/K)
Specific heat: Based on thermodynamics, the specific heat capacity of a substance is the heat capacity of a sample of the substance divided by the mass of the sample. In layman's words, it is the amount of energy that must be added, in the form of heat, to one unit of mass of the substance in order to cause an increase of one unit in temperature.
Enthalpy: it is a concept used in science and engineering when heat and work need to be calculated. The name comes from the Greek word "enthalpos" meaning "to put heat into". The idea and the word were made up by the Dutch scientist Heike Kamerlingh Onnes in 1909
If a substance changes at constant pressure at this juncture enthalpy tells how much heat and work was added or removed from the substance.
Enthalpy is analogous to energy, but not similar. during the process of substance enlarging and shrinking, energy is consumed or released.
Enthalpy accounts for this energy, this made scientists calculate change the enthalpy rather than the change in energy.
Enthalpy (H)= Internal Energy (u) +(Pressure (P) x Volume (v));
H = u + (Pxv)
ENTROPY: it is defined as a measure of the amount of energy that is unavailable to do work. it is a measure of the number of possible arrangements of the atoms in a system that can have So, it could be called as a measure of uncertainty or randomness.
Now we are decoding the given Thermofile in order to simplify using a MATLAB code.
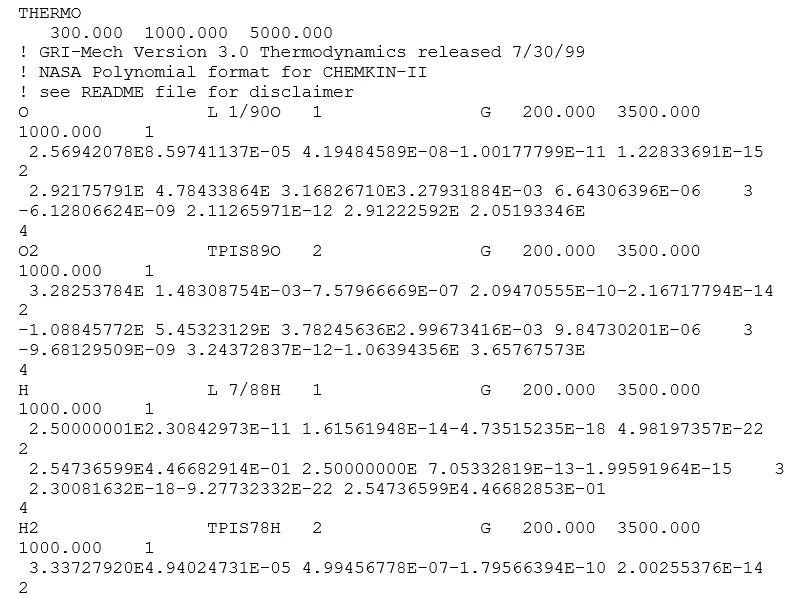
The given data file is downloaded and saved in the same folder where the Matlab code is saved. From the given sample below, the first 5 lines are already describes. The remianing format of the file has groups of four lines and first line indicating the species and the local temperature range and the consecutive three lines contain the coefficients.
Now we are writing a code for the function which comprises all the coefficients.
From the given thermodynamic data file, the third line has only 4 coefficients and therefore indexing position is carried up to b(4)+3. In this way, all the fourteen coefficients of each species are obtained.
To evaluate the properties like specific heat, enthalpy and entropy, a numerical array named T is created that contains local low temperature and local high temperature as limits with 1000 divisions. A function below is invoked that calculates the values of each of the properties for all the species. It has the inputs of local mid temperature and all the fourteen coefficients. .The function that calculates the specific heat, enthalpy and entropy is written as follows
%calculating thermodynamic properties (specific heat,enthalpy,entropy)

function [cp, h, s] = coeff(a1,a2,a3,a4,a5,a6,a7,a8,a9,a10,a11,a12,a13,a14,T)

R = 8.314;
for j = 1:length(T)
    if T(j) < 300

        cp = (a1 + a2.*T + a3.*T.^2 + a4.*T.^3 + a5.*T.^4).*R;
        h = (a1 + (a2.*T)./2 + (a3.*T.^2)./3 + (a4.*T.^3)./4 + (a5.*T.^4)./5 +(a6./T)).*R.*T;
        s = (a1.*log(T) + a2.*T + (a3.*T.^2)./2 + (a4.*T.^3)./3 + (a5.*T.^4)./4 + a7).*R;

    else

        cp = (a8 + a9.*T + a10.*T.^2 + a11.*T.^3 + a12.*T.^4).*R;
        h = (a8 + (a9.*T)./2 + (a10.*T.^2)./3 + (a11.*T.^3)./4 + (a12.*T.^4)./5 +(a13./T)).*R.*T;
        s = (a8.*log(T) + a9.*T + (a10.*T.^2)./2 + (a11.*T.^3)./3 + (a12.*T.^4)./4 + a14).*R;

    end
end
end
An array of cp, h, s is created. if the temperature from the array T is greater than the local_mid_temperature then it falls into calculating the three properties using the prescribed formula for high temperature coefficients or else the values are computed using the low-temperature coefficients.
The value of universal gas constant is invoked. It is extremely mandatory to use the dot product to compute multiplication in the written equations since arrays are used. The objective of the program is make folders for each species saving the variations of specific heat, enthalpy and entropy with temperature.
Now we are writing a main program for extracting the 14 coefficients of the individual species, determining the specific heat, enthalpy, entropy of species, and calculating molecular weight of the species from the given data file.
clear all
close all
clc

%Reading the thermodynamic data file
f1 = fopen('THERMO.dat','r');
fgetl(f1);

%Reading the header information
A = fgetl(f1);

%splotting lines
A = strsplit(A,' ');

%Defining the temperature extracted from datafile
global_low_temp = str2double(A{2});
global_mid_temp = str2double(A{3});
global_high_temp = str2double(A{4});

for i = (1:3)
    comments = fgets(f1);
end

for i = 1:53

    %extracting species name
    species = fgetl(f1);
    species_name = species(1:6);

    %Extracting coefficients from first line
    line_1 = fgetl(f1);
    l1 = strfind(line_1,'E');
    a1 = str2double(line_1(1:(l1(1)+3)));
    a2 = str2double(line_1((l1(1)+4):(l1(2)+3)));
    a3 = str2double(line_1((l1(2)+4):(l1(3)+3)));
    a4 = str2double(line_1((l1(3)+4):(l1(4)+3)));
    a5 = str2double(line_1((l1(4)+4):(l1(5)+3)));

    %Extracting coefficients from second line
    line_2 = fgetl(f1);
    l2 = strfind(line_2,'E');
    a6 = str2double(line_2(1:(l2(1)+3)));
    a7 = str2double(line_2((l2(1)+4):(l2(2)+3)));
    a8 = str2double(line_2((l2(2)+4):(l2(3)+3)));
    a9 = str2double(line_2((l2(3)+4):(l2(4)+3)));
    a10 = str2double(line_2((l2(4)+4):(l2(5)+3)));

    %Extracting coefficients from third line
    line_3 = fgetl(f1);
    l3 = strfind(line_3,'E');
    a11 = str2double(line_3(1:(l3(1)+3)));
    a12 = str2double(line_3((l3(1)+4):(l3(2)+3)));
    a13 = str2double(line_3((l3(2)+4):(l3(3)+3)));
    a14 = str2double(line_3((l3(3)+4):(l3(4)+3)));

    T = linspace(global_low_temp, global_high_temp, 500);

    %calling the thermodynamic equation function
    [cp, h, s] = coeff(a1,a2,a3,a4,a5,a6,a7,a8,a9,a10,a11,a12,a13,a14,T);

    %Creating a folder 'SPECIES'  to save thermodynamic plots of species
    mkdir(['C:UsersSarath KumarOneDrivePicturesCamera RollNASA Species_', species_name]);

    %Plotting
    %plot betwwen Temperature and specific Heat
    figure(1)
    plot(T,cp,'LineWidth',3,'color','b');
    title(species_name)
    xlabel('TEMPERATURE')
    ylabel('SPECIFIC HEAT')

    %plot betwwen Temperature and Enthalpy
    figure(2)
    plot(T,h,'LineWidth',3,'color','g');
    title(species_name)
    xlabel('TEMPERATURE')
    ylabel('ENTHAPY')

    %plot betwwen Temperature and Entropy
    figure(3)
    plot(T,s,'LineWidth',3,'color','r');
    title(species_name)
    xlabel('TEMPERATURE')
    ylabel('ENTROPY')

    cd(['C:UsersSarath OneDrivePicturesCamera RollNASA Species_', species_name]);

    %Saving the plots
    saveas(1,'Temperature versus Specific heat','png');
    saveas(2,'Temperature versus Enthalpy','png');
    saveas(3,'Temperature versus Entropy','png');

    cd ..


    fprintf('The Molecular weight of the element: ')
    disp(species_name)
    molecular_weight(species_name)


end
fclose(f1);
CODE EXPLANATION:
The code begins with the opening if the given file, 'THERMO.dat' using fopen command.
fopen command: This command is used to open file or obtain information about open files.
Syntax:
fileID = fopen(filename,permission)
This syntax opens the file, file name, with the type of access specified by permission for binary read access and returns an integer file identifier equal to or greater than 3.
MATLAB reserves file identifiers 0,1, and 2 for standard input output and standard error respectively;
f1 is the file handler or pointer to the file output, which is in the form of text and the permission given to fopen is to read the file.
In command window, f1 displays a positive number which indicates that the desired action is successfully performed.
To extract the first line from the file, a command named 'fget1' is used. A pointer named heating is used to store the data from the first line.
fgetl command: This command is used to read a line from the file and remove newline characters.
Syntax:
tline = fget1(fileID)
Strsplit command: This command is used to split string or character vectors at specified delimiter.
Syntax:
C = strsplit(str,delimiter)
Later, the species name is called and set to a for loop individually to take the atom in the species name and compare with the atom array containing the given atom names using strcmp.
if condition, after comparing the atom to the species name the place of the atom is j which is then used to find the weight of the atom in j position in the atom array in the weight array which has the weight of the given atoms is the same order or else the values will be calculated wrongly.
Now the weight of the atom in j position is then added and saved in mw with mw which is first set to 0 before the for a loop. After adding mw with the weight a variable is used with the str2num command to check for the number of atoms present.
For the atoms present more than one, an if condition is used, to add mw with the weight after multiplying the weight of the atom with n-l as one atom from it is already added. After the mw is updated the function is ended and returned to the main code.
Where the molecular weight is printed with their species name. Then the local temperature range is stored in low, mid, and high-temperature respectively using str2double command which changes a string to the number when the string contains only numbers.
Then the next line is called coeff_I and then the positions of the E variable are found using findstr command and stored in e, AS ever coefficient contains E in it at the end before 3 positions. The 5 coefficients are separated by cling the position from to and stored in different variables as numbers using str2double command.
This same procedure is used to separate the coefficients from the next two lines and stored them.
After taking the 14 coefficients and stored in 14 variables (al:al4), the enthalpy, entropy, and specific heat are to be calculated for the respective species. So for that, a time array is created using linspace command from the low temperature to high temperature with 100 intervals in between them.
Then the function for the enthalpy, entropy, and specific heat calculation is called.
Program to evaluate molecular weight:
function mw = molecular_weight(species_name)
elements = ['H' 'C' 'N' 'O' 'S' 'A'];
atomic_mass = [1.0079 12.011 14.0062 15.994 32.066 39.948];

%choosing a constant mw that determines molecular wweight
mw = 0;

%choosing a constant 'n' and initializing its value as zero
n = 0;
for i = 1: length(species_name)
    for j = 1 : length(elements)
        if strcmp(species_name(i),elements(j))
            mw = mw +atomic_mass(j);
            k = j;
        end

    end

    %when there are numbers in the species
    n = str2double(species_name(i));
    %if there is a number, then the number is assigned to n
    if n>1
        mw = mw + (atomic_mass(k)*(n-1));
        %fprintf('The Molecular weight of %d',atomic_mass(k))
    end

end
end
And calculated by using the code which is used above separately for the 14 coefficients and the 3 local temperature ranges are called and said the output to be stored in cp,h,s.
Using the formula;
Cp/R = a1 + a2 T + a3 T^2 + a4 T^3+ a5 T^4
H/RT = a1 + a2T /2 + a3 T^2 /3 + a4T^3/4 + a5 T^4 /5 + a6/T
s/R = a1lnT + a2T + a3 T^2 /2 + a4 T^3 /3 +a5 T^4/4 + a7
Where r is the gas constant 8.3145. To calculate the value, for loop is used and i is set to the length of temperature.
As the first 7 coefficients are high temperature and the next 7 coefficients are low temperature an if condition is used to separate the first 7 and the next 7 as if ti) is greater than t2 that is the mid-temperature, when the condition becomes true the cp, h, and s for the first 7 coefficients of the species is calculated using the temperature arrays between the mid and high-temperature range. And when if the condition fails the temperature arrays between low and mid-temperature ranges are used along with the next 7 coefficients and the cp, h, and s values are calculated.
After calculating the cp, h, and s values for all the local temperature arrays the function is ended and returned to the main code.
To save the plots a new folder is created in the local disk D, and the directory is changed to the location where the new folder is created.
Then the plots are plotted and saved automatically, using the cd command. Plotting of the graph is done individually, 3 figures are used as there are 3 different values.
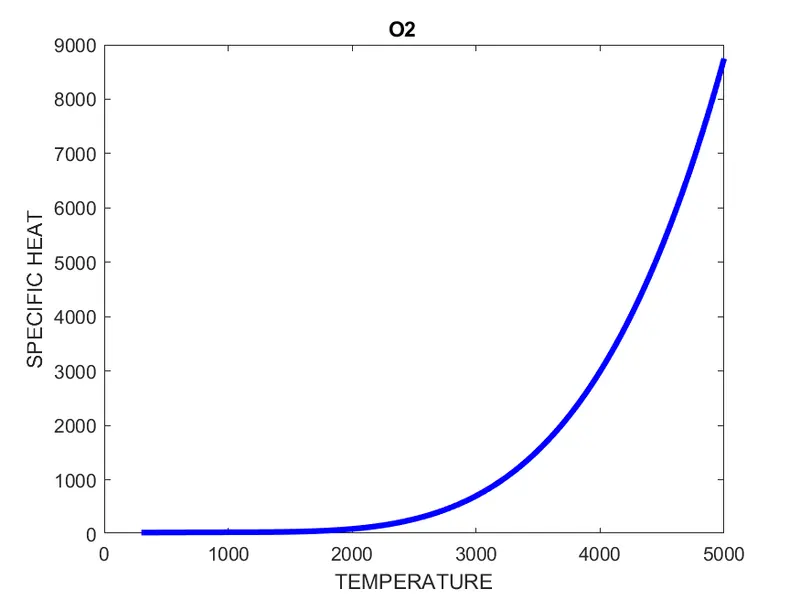
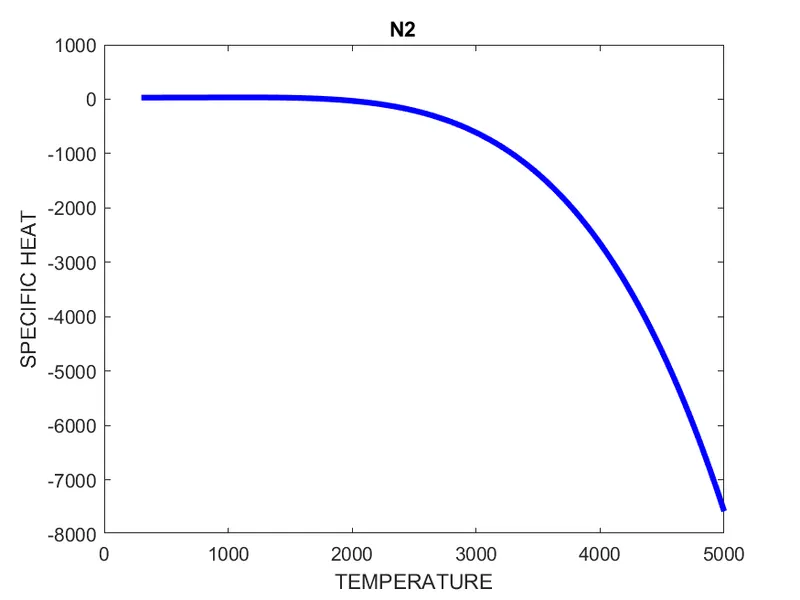
In the 1st figure, the plot for temperature and specific heat with the title of the species name is plotted, and then the plot is made to a file with the filename as specific heat with their species name and saved as individual png files.
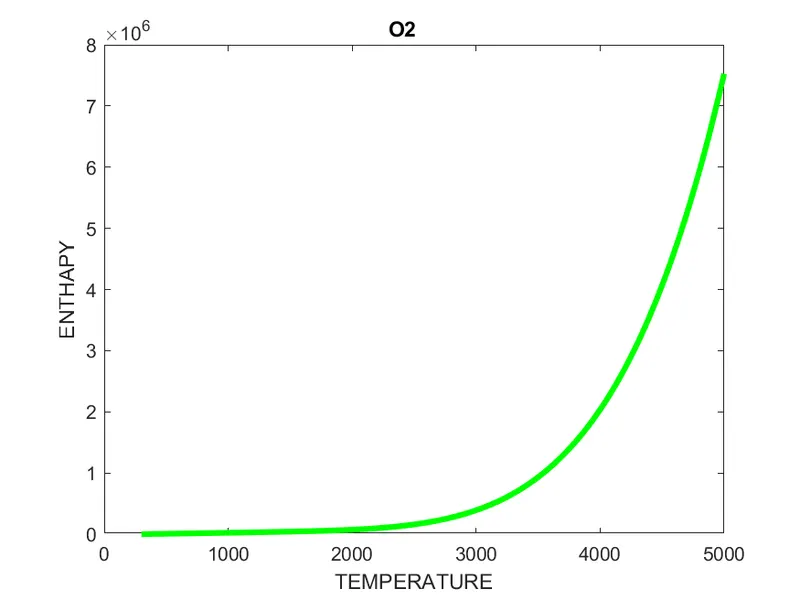
In the 2nd figure, the plot for temperature and enthalpy with the title of the species name is plotted, and then the plot is made to a file with the filename as enthalpy with their species name and saved as individual png files.
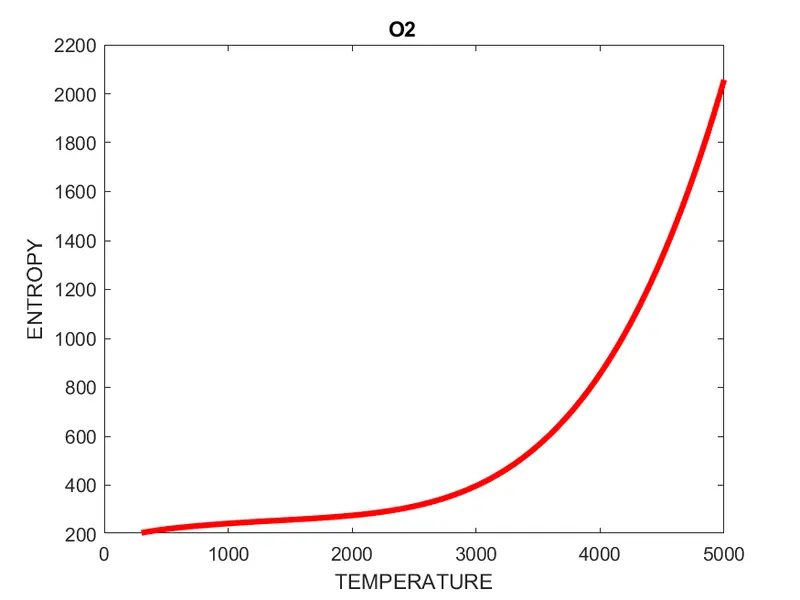
In the 3rd figure, the plot for temperature and entropy with the title of the species name is plotted. and then the plot is made to a file with the filename as entropy with their species name and saved as individual png files.
Once all the program is executed for all the species then the if condition in which the strcmp of the species name with end is equal, then the if condition fails and the loop ends, then the directory is returned back to the program folder location and the code ends there.
RESULTS:
1. A function in MATLAB that extracts the 14 coefficients and calculates the enthalpy entropy and specific heats for all the species in the data file is successfully written.
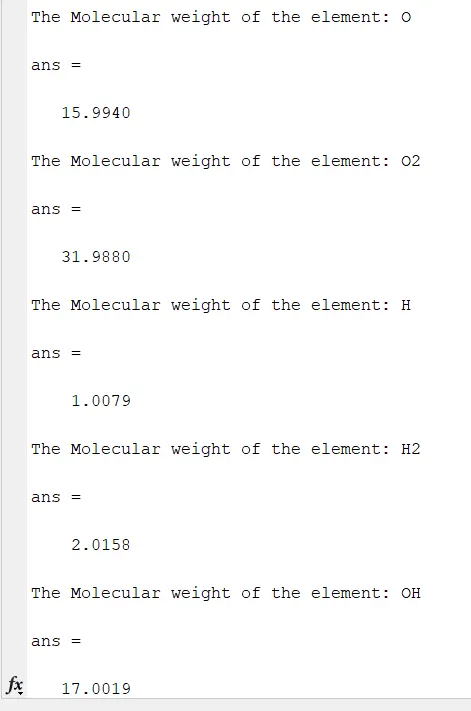
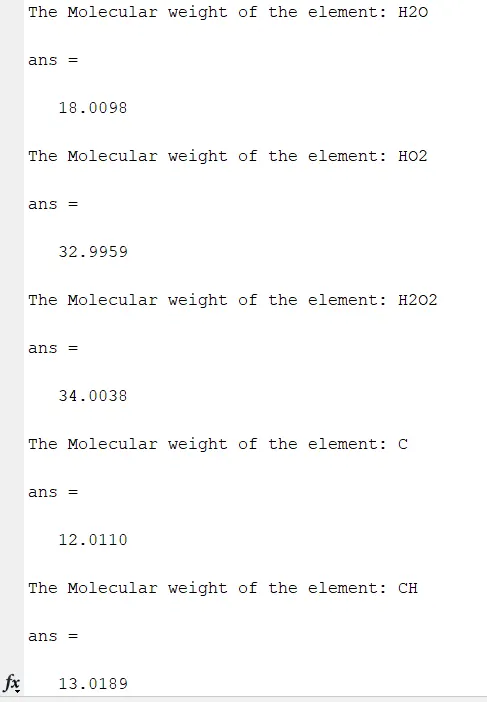
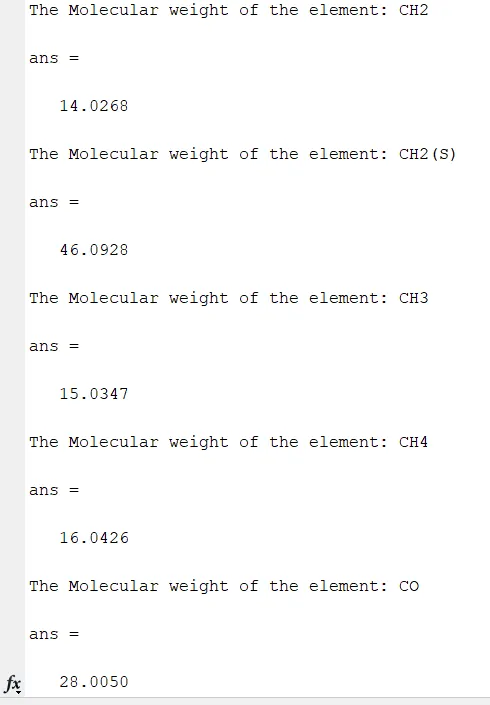
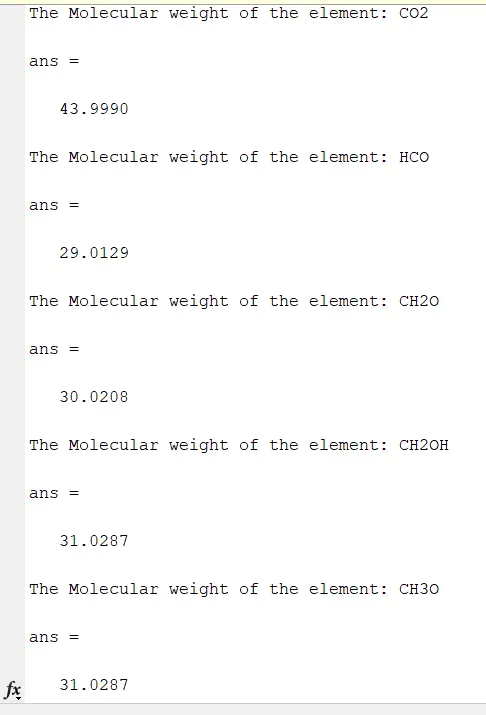
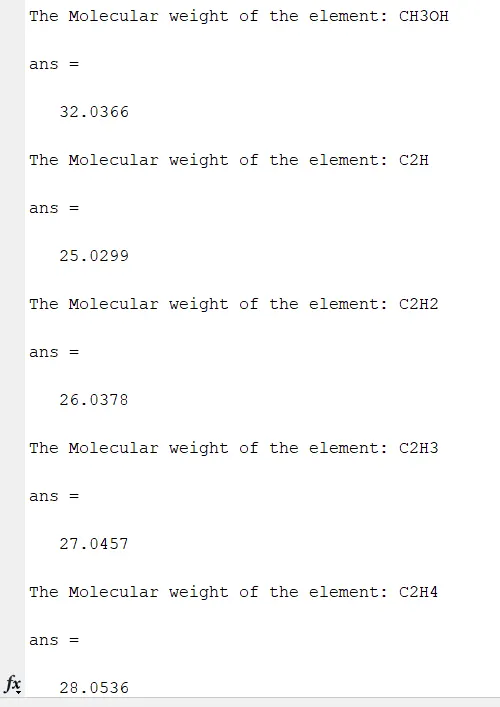
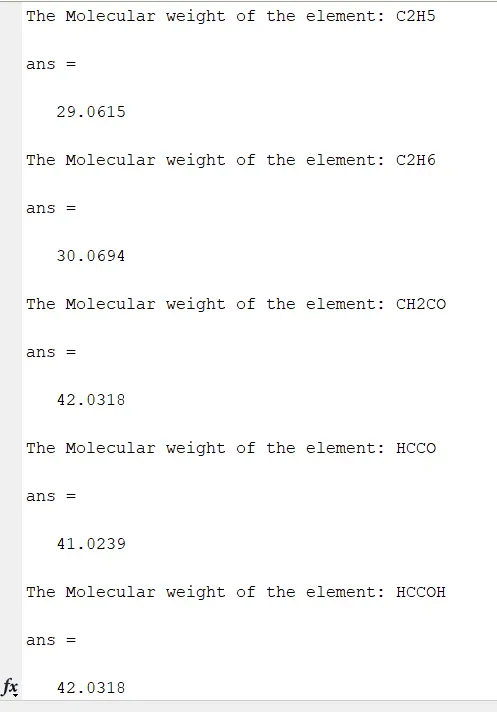
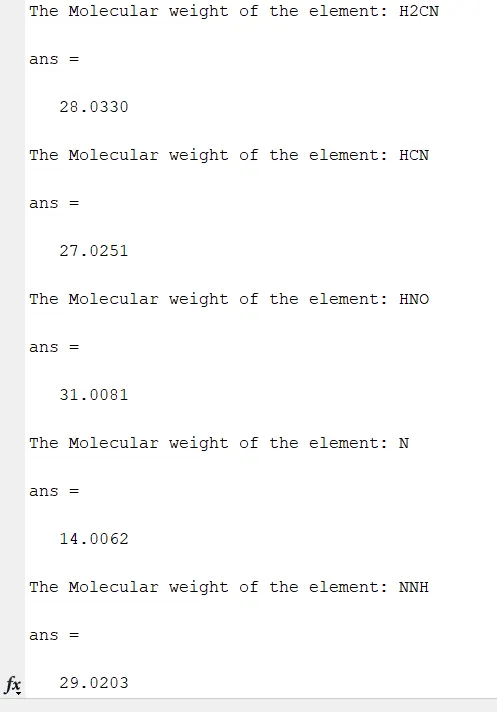
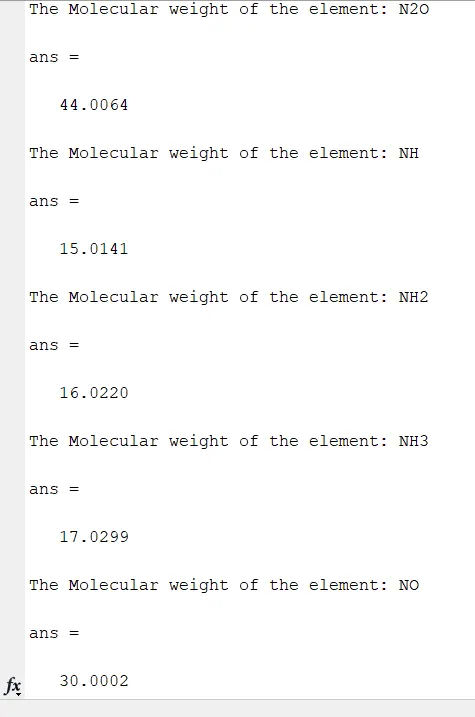
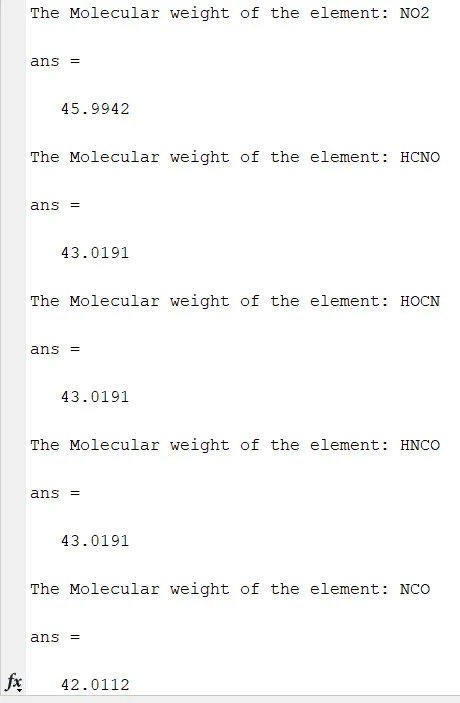
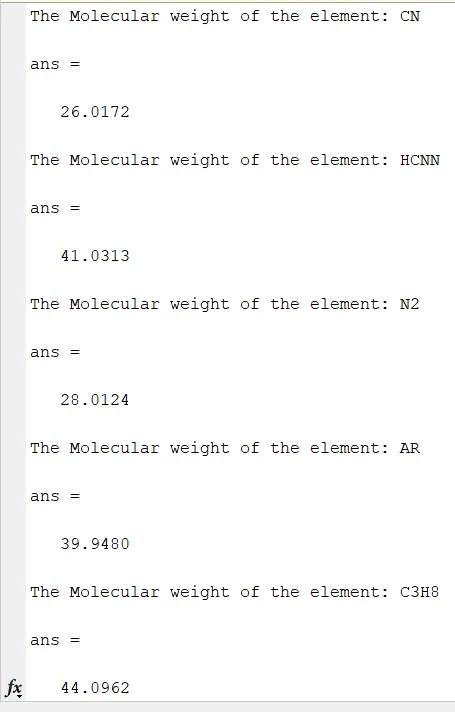
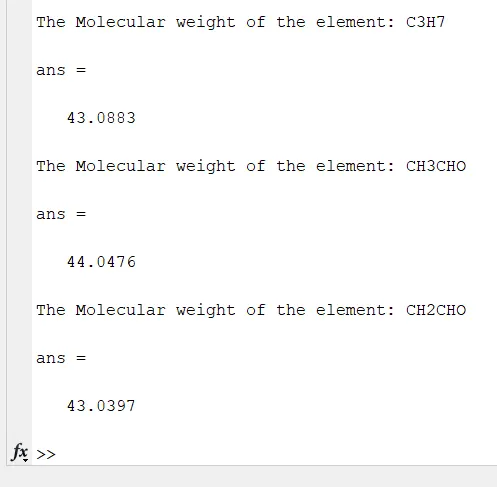
2. The molecular weight of each species is obtained and displayed in the command window.
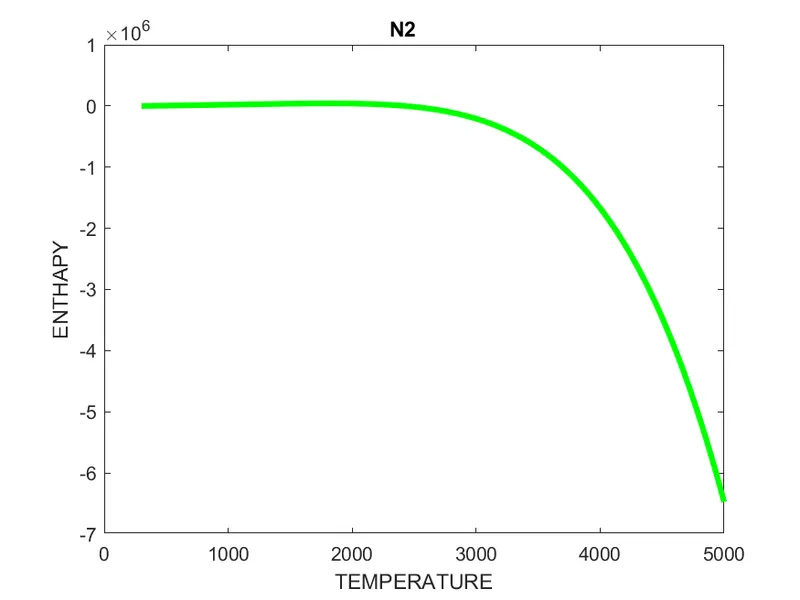
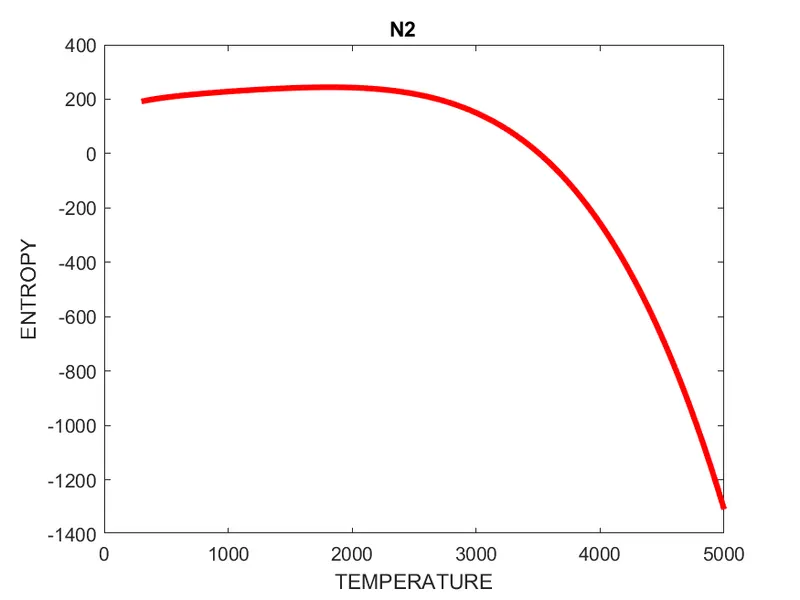
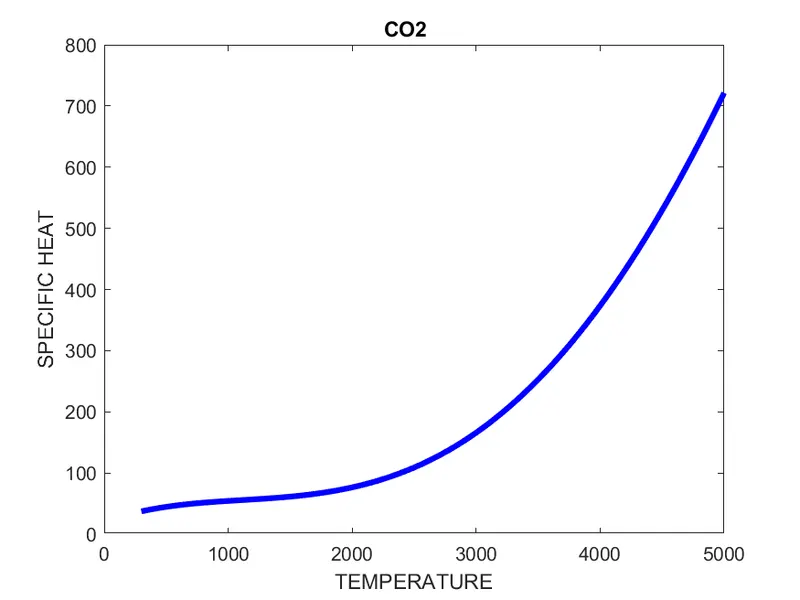
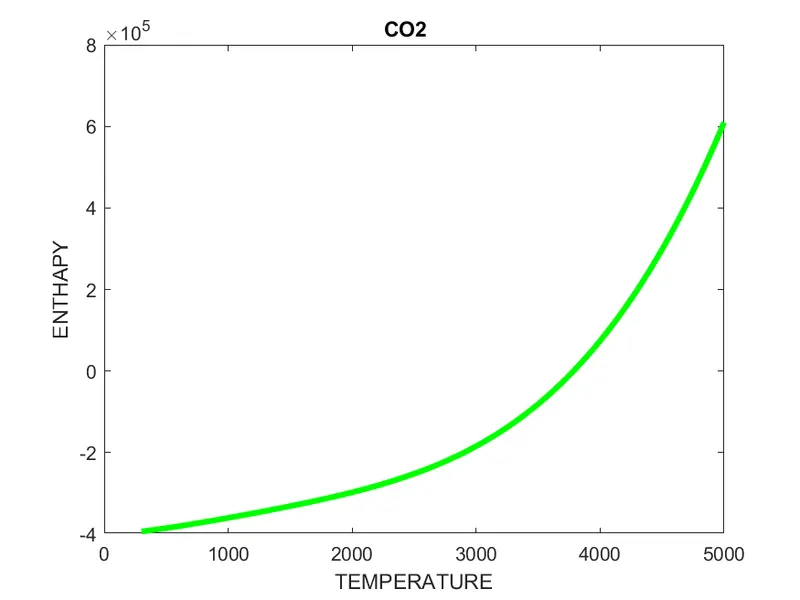
3. Plots for varying specific heat, enthalpy, and entropies with temperature for each species are successfully obtained.
4. The plots as images with appropriate names saving them in separate folders for each species with suitable names are generated automatically. A screenshot of the window where all the folders are saved is to be submitted. o Plots for o2, N2, and Co2 species are to be submitted.
COMMAND WINDOW OUTPUT FOR MOLECULAR WEIGHT:
POST EXECUTING THE PROGRAM THE PLOTS FOR DIFFERENT SPECIES ARE STORED IN SEPARATE FOLDERS:

THERMODYNAMIC RELATION FOR DIFFERENT SPECIES IN A PLOT:
1. FOR O2: The below plot represents the temperature versus specific heat (cp), Enthalpy (H) and Entropy (s)
2. FOR N2: The below plot represents the temperature versus specific heat (cp), Enthalpy (H) and Entropy (s)
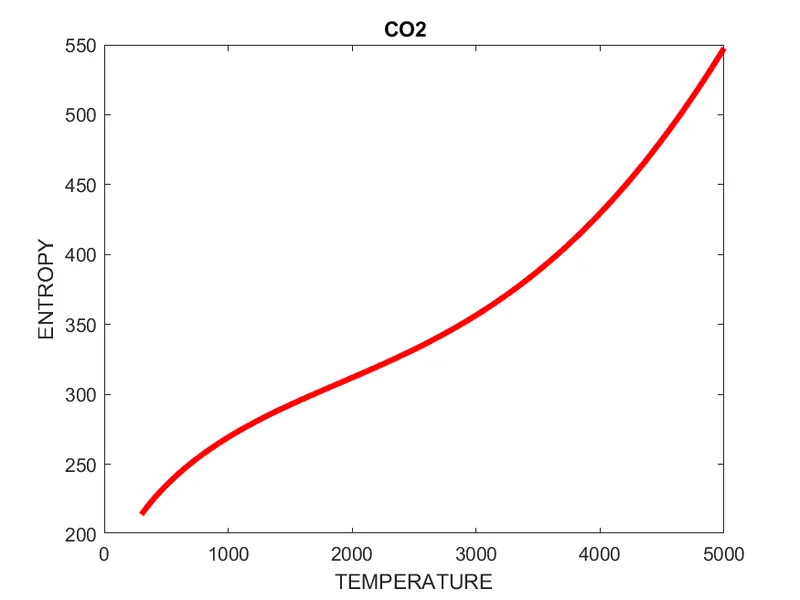
3. FOR CO2: The below plot represents the temperature versus specific heat (cp), Enthalpy (H), and Entropy (s)
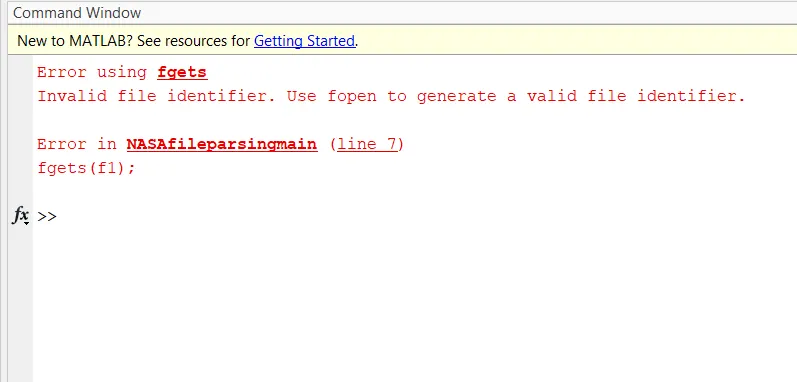
ERRORS WHILE PLOTTING:
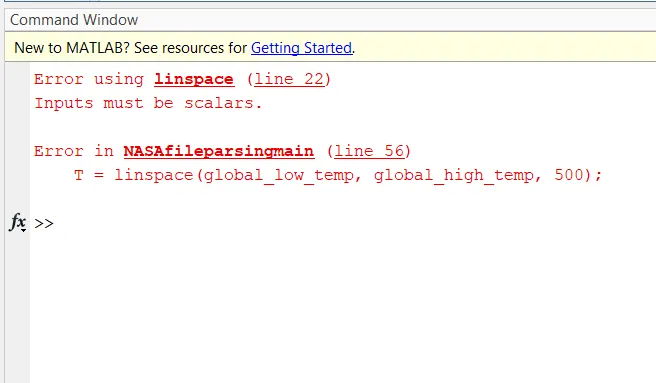
1. Error without using in str2double command:
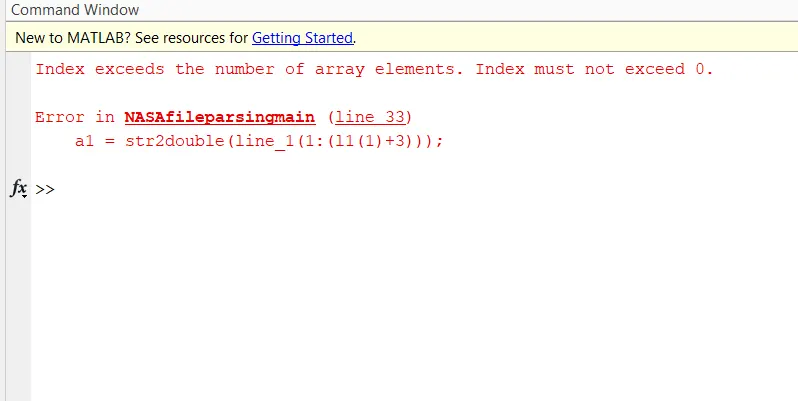
2. Error while extracting coefficient in line without calling fgetl command:
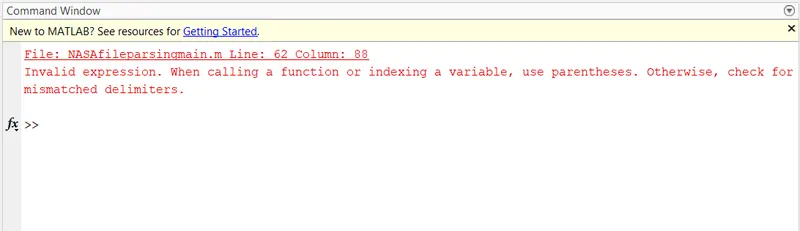
3. Error in mdir command due to mismatched delimiters:
4. Error in cd command without changing directory:
CONCLUSION:
We have developed a MATLAB CODE for parsing the NASA thermodynamic data about species, extracting the 14 coefficients of the individual species, determining the specific heat, enthalpy, entropy of species, and calculating molecular weight of the species from the given data file.
REFERENCES:
https://in.mathworks.com/help/matlab/ref/fopen.html
https://in.mathworks.com/help/matlab/ref/fgetl.html
https://in.mathworks.com/help/matlab/ref/strsplit.html
https://in.mathworks.com/help/matlab/ref/str2double.html
https://in.mathworks.com/help/matlab/ref/ischar.html
https://in.mathworks.com/help/matlab/ref/char.html
https://in.mathworks.com/help/matlab/ref/strcmp.html
https://in.mathworks.com/help/matlab/ref/strfind.html
https://in.mathworks.com/help/matlab/ref/mkdir.html