Week 7 State of charge estimation
https://in.mathworks.com/matlabcentral/fileexchange/72865-design-and-test-lithium-ion-battery-management-algorithms
1.Simulate the 3 test cases from harness dashboard and write a detailed report on the results
2.What is coulomb counting? Refer to the above model and explain how BMS implements coulomb counting for SOC estimation ?
Hint :(Download the file from the link and go to SOC estimation model-ECU block)
Answer:-
BMS is used to protect the rechargeable cell (battery or battery pack) from running outside its safe operating area, monitors its state, calculates secondary data, reports that data, controls its surroundings, authenticates it, and/or balances it.
A BMS can track the state of the battery using several indicators, such as:
Voltage- Total voltage, individual cell voltages, or periodic tap voltages
Temperature - Average temperature, coolant intake temperature, coolant output temperature, or specific cell temperatures
Coolant flow - For air or fluid cooled batteries, coolant flow is important.
Current - the amount of electricity flowing into or out of the battery.
A BMS may also calculate values based on the items listed above, such as:
Minimum and maximum cell voltages, State of charge (SOC) or depth of discharge (DOD), to show the battery's charge level State of health (SOH), a differently defined measurement of the battery's remaining capacity as a percentage of its original capacity,The amount of power available for a particular time frame given the current power usage, temperature, and other factors is referred to as the state of power (SOP).
Safety Condition (SOS)-As a charge current limit, the maximum charge current is used (CCL)As a discharge current limit, the maximum discharge current (DCL)Energy provided [kWh] since the last charge or charge cycle,
A cell's internal impedance (to determine open circuit voltage)
Delivered or stored charge [Ah] (sometimes this feature is called Coulomb counter)
Total amount of energy delivered since the first use
Total amount of time spent in operation since the initial use
Number of cycles in total
A BMS may protect its battery by preventing it from operating outside its safe operating area, such as:
- Over-current (may be different in charging and discharging modes)
- Over-voltage (during charging), especially important for lead–acid and Li-ion cells
- Under-voltage (during discharging)
- Over-temperature
- Under-temperature
- Over-pressure (NiMH batteries)
- Ground fault or leakage current detection (system monitoring that the high voltage battery is electrically disconnected from any conductive object touchable to use like vehicle body)
The BMS may prevent operation outside the battery's safe operating area by:
- Including an internal switch (such as a relay or solid state device) which is opened if the battery is operated outside its safe operating area
- Requesting the devices to which the battery is connected to reduce or even terminate using the battery.
- Actively controlling the environment, such as through heaters, fans, air conditioning or liquid cooling
Main Matlab Model is shown below
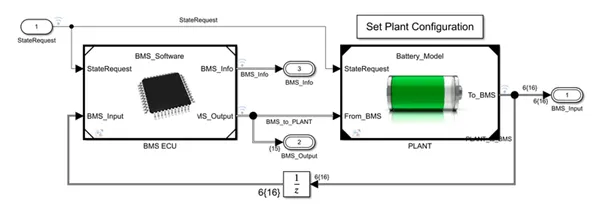
In this BMS the controller is BMS ECU and the plant is the battery pant is battery pack with Charger and load. The output of the battery pack is feed back to the controller, and control signals send to the plant.
Subsystems are shown below
BMS ECU
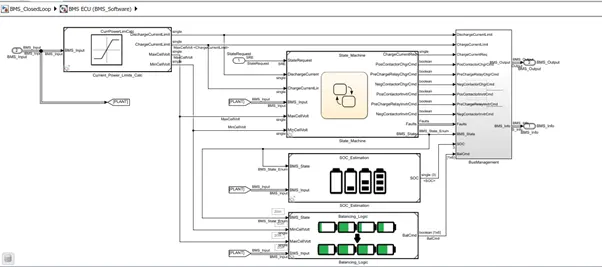
it contains numerous subsystems such as current power limitations calculation, balancing logic, state machine, and bus management.
Current_Power_Limits_Calc
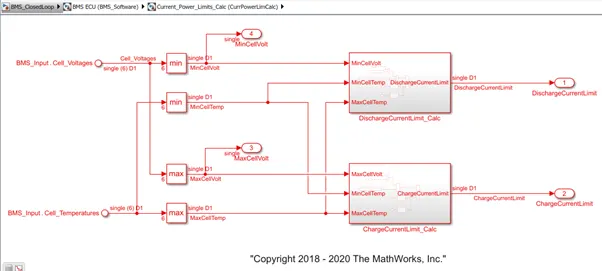
there are two discharge current limits and one charge current limit are there in the subsystem. The cell voltage and temperature are accepted as inputs, and the cell minimum and maximum voltage and temperature are determined using the min and max blocks.
DischargeCurrentLimit_Calc
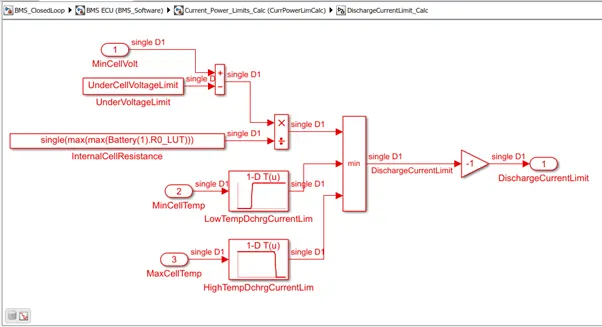
The minimum cell voltage and maximum cell temperature are used as input. The manufacturer's cell specification determines the under cell voltage limit. The cut-off voltage is critical during discharging. The difference between the minimum cell voltage and the cut-off voltage is calculated, and the current limit is derived using the V/R equation. This computed current ensures that the cell does not discharge below the safe depth of discharge. This discharge current limit is communicated to the load, and the battery is discharged in accordance with it.
ChargeCurrentLimit_Calc
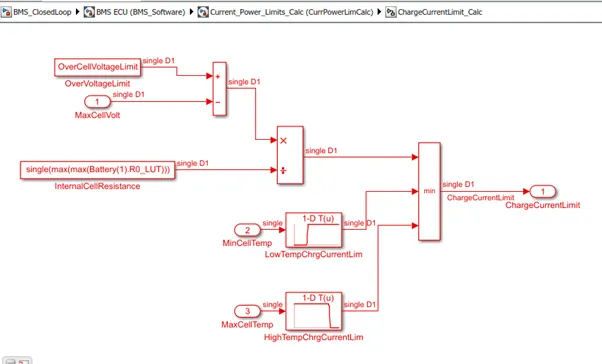
The charge current limit calculation block works in the same way as the discharge current calculation block, but it considers the maximum cell voltage from the manufacturer's specifications and tapers down the current so that the charge current is not sufficient to charge the battery beyond the maximum cell voltage
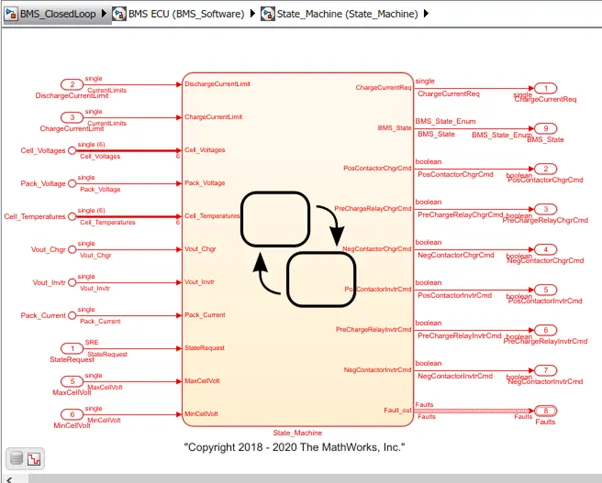
State_Machine
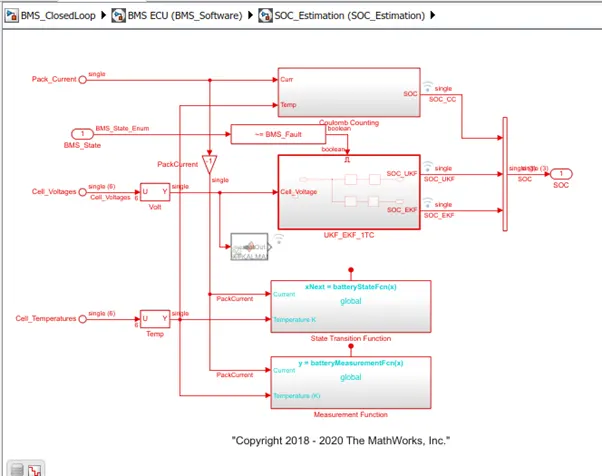
SOC_Estimation
In this Battery SOC is calculated by the help of Coulomb Counting methode
Plant subsystem is shown below
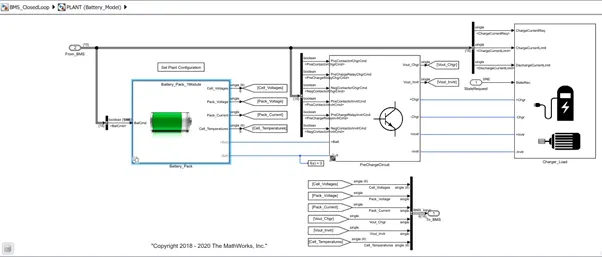
The battery pack connected to the PreChargeCircuit with the charger_load. Because the battery pack is at a higher voltage than the charger_load, when both components are directly connected by the main connector, there will be a high current inrush in the transient phase due to the very high potential difference, which will taper down as the potential on both sides to equalise .This large transient current might produce a meltdown at contactors, which leads to the contactors being permanently welded. Parallel PreCharge circuit prevents this.
Battery Pack Subsystem-
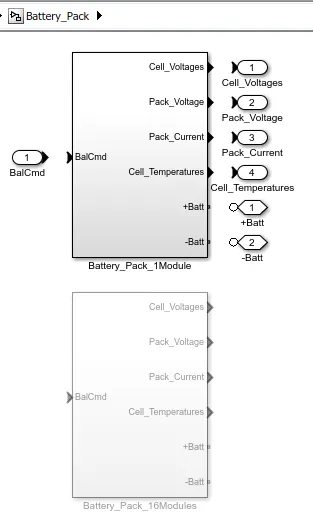
Two modules are there in the model one is Battery_Pack_1Module and the Battery_Pack_16Module is the other, here we are using Battery_Pack_1Module
PreChargeCircuit
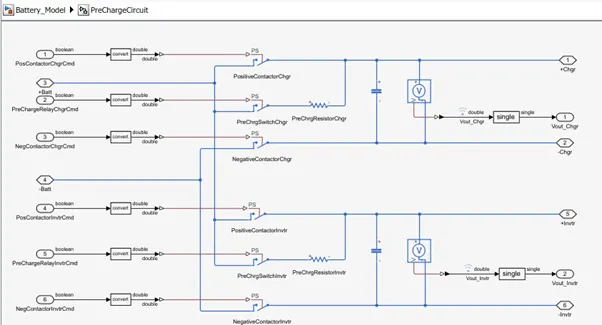
The terminals of the battery are linked to the charger and load terminals. Between the battery and the charger/load lies a filter capacitor. A switch and a resistor control the current flow on either side of the Precharge circuit. A small current flow to the load side is permitted by the PreChargeCircuit. This allows the load side to match the voltage level of the battery pack and avoids high current flow when the contactor is in on State.
Charger_Load
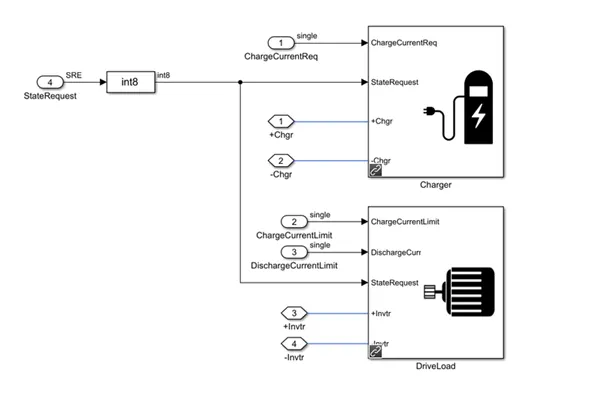
This subsystem is sub divided in to another two subsystem one is charger and another one is DriveLoad.
Charger
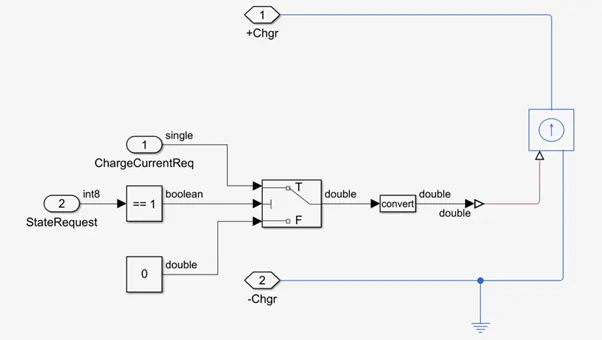
DriveLoad
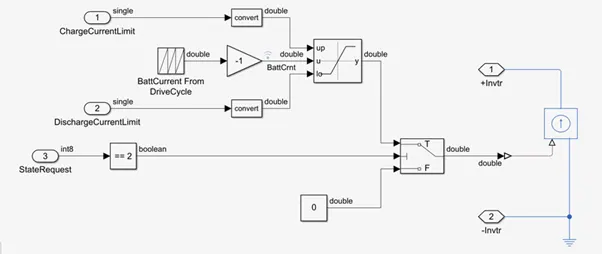
- Simulate the 3 test cases from harness dashboard and write a detailed report on the results
Harness Dashboard
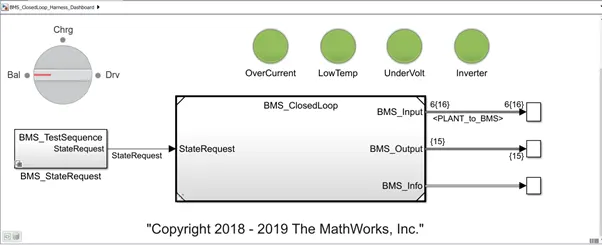
In this Dashboard we can do the simulation and can validate the BMS response. It mostly features two simulation variants: Variant of the test sequence: Predefined simulation circumstances in which Charging, Driving, and Balancing situations are ordered sequentially for a set amount of time. There are three test sequences, each of which is a one-of-a-kind combination of charging, driving, and balancing. Manual mode: The simulation settings can be changed while the system is running by adjusting the knob between balancing, charging, and driving.
Test 1
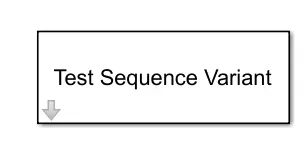
To select the test case we hav to double click the block then a we can see one popup window
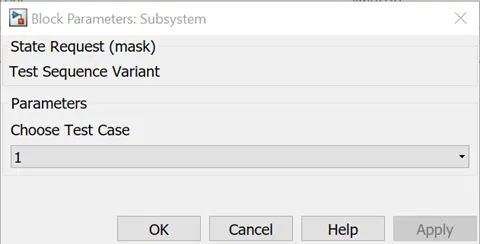
from this window we have to select 1then apply then ok should be clicked.
after that we have to double click the BMS state request from the harness dash board
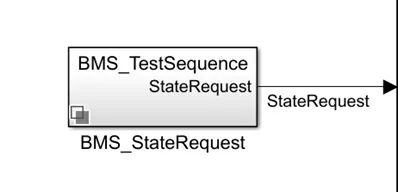
After clicking on it a popup window we are getting
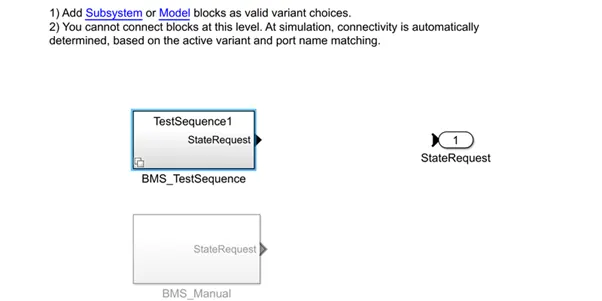
In that we have to select BMS test sequence then the subsystem will open
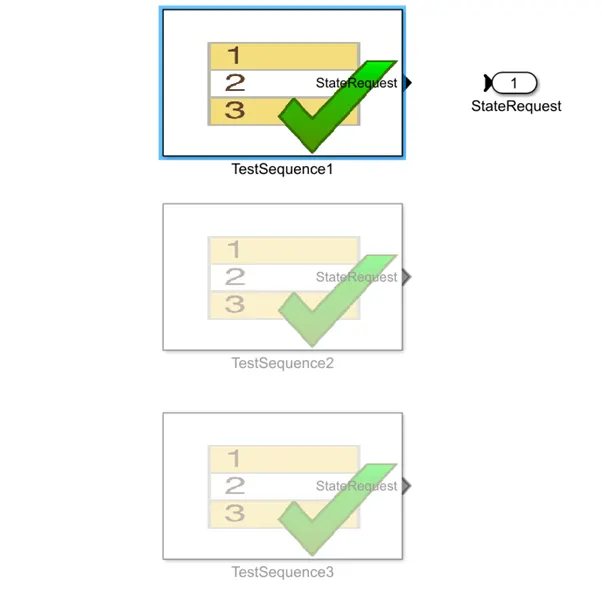
From this we can confirm that the test case 1 is open.then we have to double click on it to confirm its configuration.
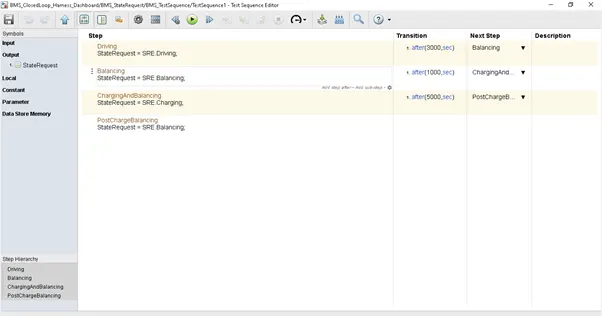
Result-
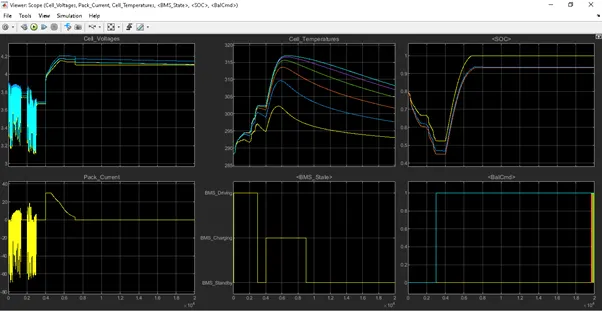
The BMS state plot reveals that the BMS is in driving mode for the first 3000 seconds.The cell voltage varies with the current drawn from the load, as indicated in the pack current figure. The cell temperature figure demonstrates that the cell temperature, As the battery discharges, the temperature rises from 288 K to greater levels. Because cell 6 is the first to be exposed to ambient heat and cell 1 (yellow line) is the last cell to be exposed to convective heat transfer, cells react to convective heat transfer sequentially from cell 6 to cell 1. As a result, cell 6 heats up faster, while cell 1 heats up slowly. During this driving phase, the battery SOC drops from 80 percent to 70 percent. The charge imbalance between the cells grows as the discharge advances, and various cells end up having differing capacities at the end of the driving phase. Balancing over the next 1000 seconds, as indicated by the BMS state plot. During this time, the pack current is zero and the cell voltages are stable at 3.7 V. The temperatures of the cells are reduced, but the SOC remains constant, indicating that there is no activity. The BMS state graphic depicts charging from 4000 to 9000 seconds. At 5000 seconds, the cells reach a peak voltage of 4.2 V, and a constant pack current of 30 A is delivered (Constant-Current Charging). When an overvoltage condition occurs while maintaining a fixed maximum voltage, the pack current is shown to taper down gradually and eventually decrease to zero (Constant voltage charging). The temperatures of the cells grow at various rates. Cell 6 reaches 317 K, while cell 1 reaches 303 K. Because cell 1 has a greater charge level, its SOC grows to 100% faster than the other cells. Other cells achieve 93 percent SOC. The BMS state plot indicates that the battery is in standby mode for the remaining period of time. The pack current is zero, and the cell voltages remain constant. Cell SOC is inactive. The cells begin to cool at the same pace.
Test 2
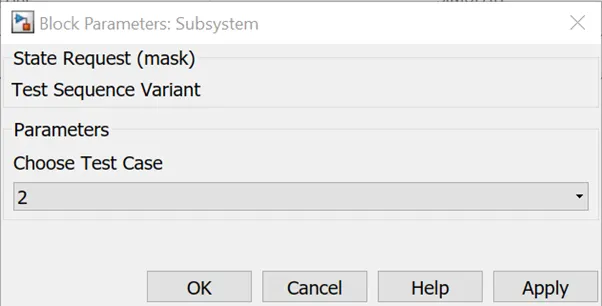
By the harness dash board we want to select the test two
Have to repeat the same procedure what we did for case1,instead of case 1 we have to select case 2 and have to run the simulation
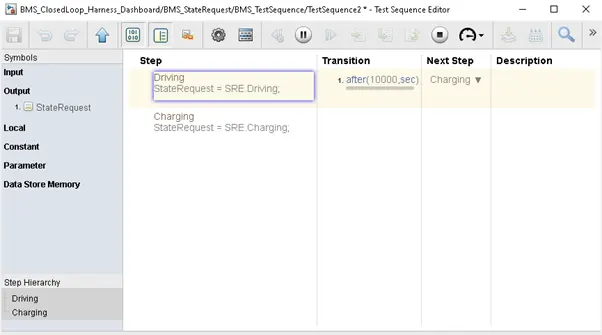
in here there are two state are there which is Driving state: The battery is depleted for the first 10000 seconds because the vehicle is simulated to be driven.
Test case2 result
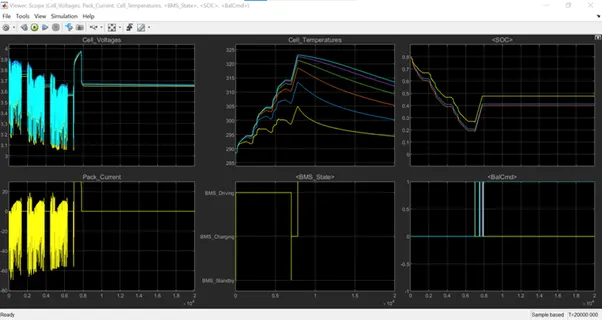
BMS state plot confirms driving state for 7000 seconds During this time, cell 6 reaches 315 K and cell 1 reaches 300 K from an initial temperature of 288 K. The cells' SOC falls from 80 percent to a range of 20-25 percent. The BMS status graphic depicts the charging condition from 7000 to about 8000 seconds. The cells' SOC climbs to a range of 40-50 percent. The battery clearly stops charging before the overvoltage situation is reached. Cell 6's temperature rises to 323 K, while cell 1's temperature rises to 305 K.
Test Case 3
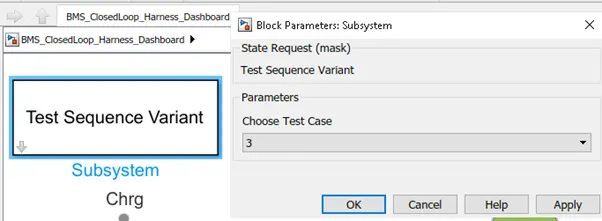
Same like other test case selection test case 3 also selected from the test sequence variant block
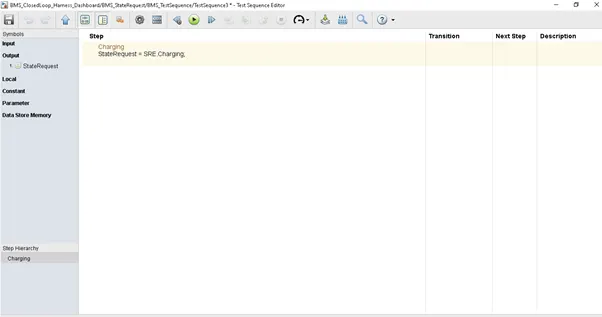
After selecting the test case 3 repeating the procedure of testing and configuring the test case as shown below
Test case 3 Result
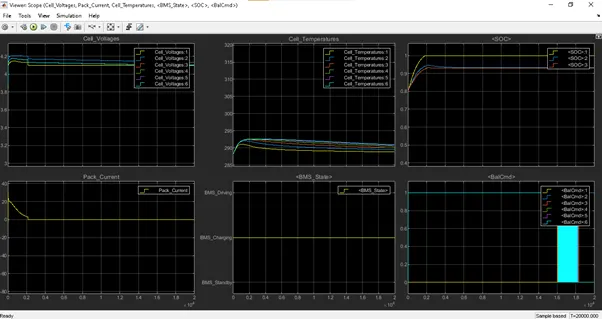
During charging SOC increases from 80% to 100% temperature increases during charging and is reduced in the standby state of BMS
2.What is coulomb counting? Refer to the above model and explain how BMS implements coulomb counting for SOC estimation ?
Coulomb counting is the technique used to determine or estimate the battery's current state of charge. In general, a battery's state of charge (SOC) is defined as the ratio of its current capacity (Qt) to its nominal capacity (Qn). The manufacturer specifies the nominal capacity, which is the maximum amount of charge that can be held in the battery.In order to estimate SOC, the Coulomb counting method analyses a battery's discharging current and integrates it over time. The Coulomb counting method is used to calculate the SoC(t), which is calculated using the discharging current, I(t), and previously calculated SOC values, SoC(t-1). The following equation is used to determine SOC(t)=Q(t)QnSOC(t)=Q(t)Qn
SOC(t)=SOC(t−1)+I(t)Qn⋅ΔtSOC(t)=SOC(t-1)+I(t)Qn⋅Δt
modified Coulomb counting method is developed to improve the Coulomb counting method. The corrected current is used in the modified Coulomb counting approach to increase estimation accuracy. The corrected current is proportional to the discharging current. The corrected current and battery discharge current have a quadratic connection.
In modified Coulomb counting method, SOC is
SOC(t)=SOC(t−1)+Ic(t)QnΔtSOC(t)=SOC(t-1)+Ic(t)QnΔt
The Simulink model used to determine the SOC using coulomb method in the model is shown below
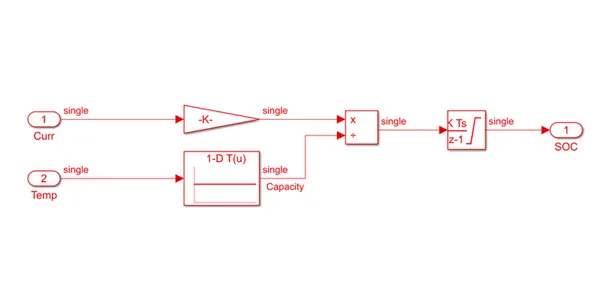
Working:- The current leaving from the cell enters the Coulomb counting block. The gain block multiplies the current by (1/3600), effectively converting it from ampere to ampere hour. The temperature has an effect on current, and this effect is accounted for utilising 1-D equations. The lookup table here does a 1-dimensional interpolated table lookup, including index searches. To make a, use an integrator block finally, the divide block characterises the effect of temperature on current. In order to estimate SOC, the Coulomb counting method analyses a battery's discharging current and integrates it over time. The integrator block handles this task. To develop a totally discrete model, the Discrete-Time integrator block is used instead of the Integrator block.
Conclusion:- Matlab model of lithium ion battery is tested successfully.