Week-4 Challenge WOT Condition Part-2
Week-4 Challenge WOT Condition Part-2
1) a.The difference between the mapped and dynamic model of motor, generator, engine
Mapped Model: - Also known as a static model, runs the simulation based on the data saved on a lookup table.
|
Mapped /Static Model |
Dynamic Model |
|
runs the simulation based on the data saved on the lookup table. |
Runs the simulation based on the actual components such as motor and accessories, generator and accessories, or Engine or its accessories. |
|
Runs fast compared with the Dynamic model |
Consumes time due to the calculations at real-time activates |
|
It is used if we have the engine data from a dynamometer or a design tool like GT Power |
It is used when we need a more detailed dynamic model and has component level data |
|
It is used for engine quasi-steady-state engine simulations. |
It is used to analyze the impact of individual engine components on the overall performance |
1b). Steps to change the model type
To change from dynamic model to mapping model or vice versa of a motor, generator, the engine has to open the model file
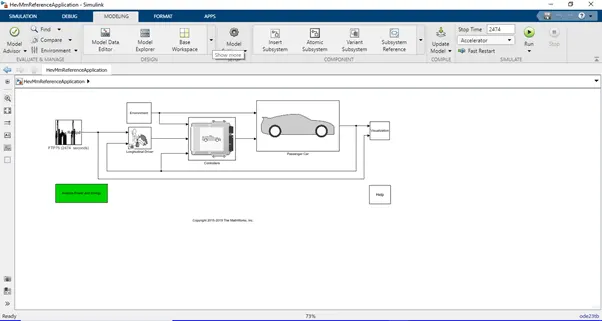
From the Simulink functions we have to open the Modeling function and have to select the variable manager from the design function 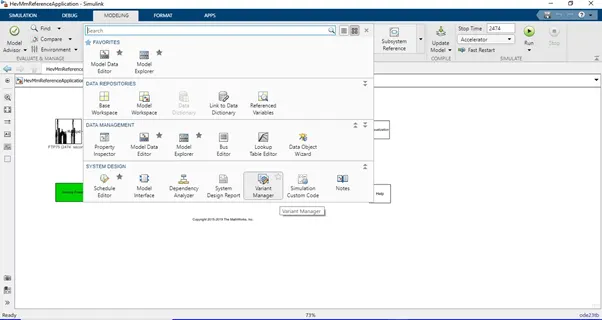
In the variable manager window, we have to open the passenger car

From the variant blocks, the Passenger car is selected, the passenger car consists of three sub-blocks. here we are going to convert the generator model type from dynamic to mapped model

To convert the dynamic model to a mapped model have to select the inactive mapped model and right-click on it to get options and have to select the option “Set as Label Mode Active Choice”

Once the mode is changed we have to refresh it by clicking activate the key from the base workspace then the change in the model will be reflected in the variant manager window.

The model change reflected in the Simulink block diagram also.
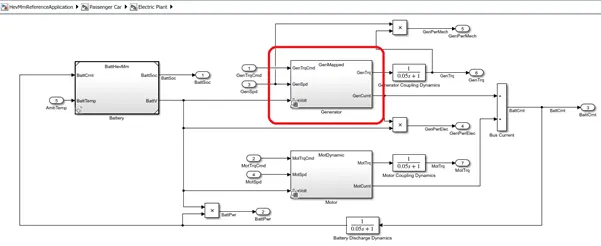
2). The calculation for miles per gallon and the factors are considered to model the fuel flow.
MPG or miles per gallon is the distance measured in miles, that a car travels per gallon of fuel. Miles per gallon also the primary measurement of a car’s fuel efficiency. In the HEV powertrain model, the miles per gallon is kept inside the block performance calculations.
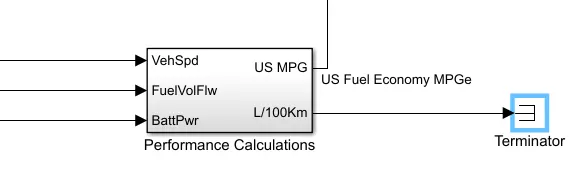
Three inputs are there in the performance calculation block ( Vehicle speed ,Fuel volume and Battery power)and two output (US MPG ,L/100KM) Simulink block diagram to convert MPG is as shown below
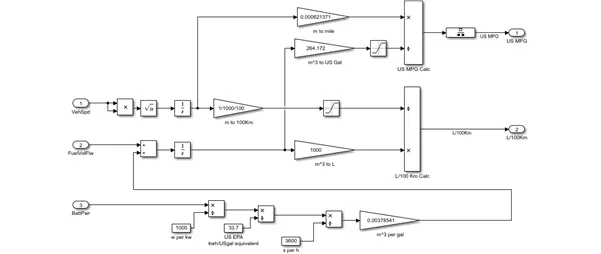
From the image shown above the first input vehicle speed is integrated with respect to time to get the distance traveled (in meter) this value is converted to mile by multiplied with the value 0.00062137, the value received after calculation is divided with the value of fuel in US Gallon is US MPG. In this case, there are two sources of power is there one is a battery and another one is convert fuel to battery power into gallon the kwh value of the battery is divided by 33.7(one-gallon fuel value is approximately equal to 33.7kwh) to convert it into seconds the obtained value is divided with 3600 and multiplied with 0.00378541 to convert into m3 per gallon, the m3 per gallon value is added with fuel volume flow to calculate the overall volume of fuel consumed by integrating the fuel flow value this value is multiplied with 264.172 and used to divide this from mile traveled to get US MPG.
3). Run the HEV Reference application with WOT drive cycle & Change the grade and wind velocity in the environment block
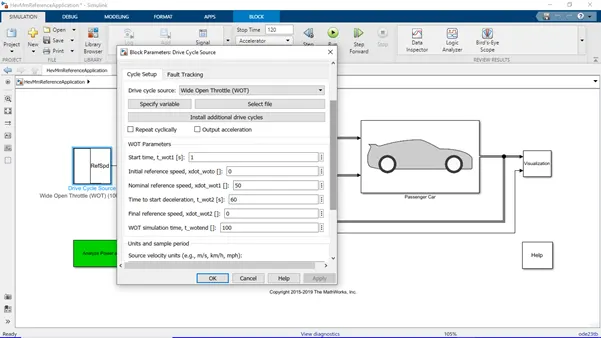
From the block parameter of the Drive Cycle, the Drive Cycle source is changed to Wide Open Throttle(WOT) from FTP75 and other parameters such as start time kept as 1sec, nominal reference speed set to 50, time to start deceleration set as 60, and WOT time set as 100 all other parameter kept as same in the block.
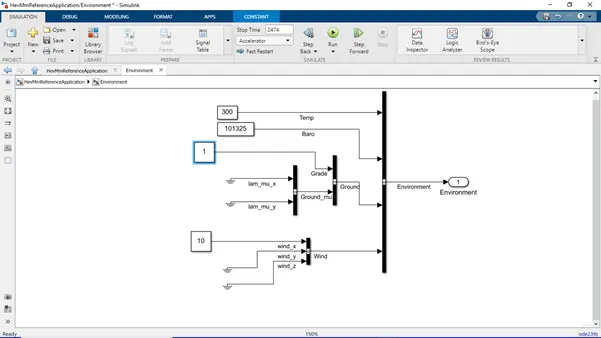
In the environment block grade and wind velocity value changed to 1 and 10 from zero as shown below.
Run the simulation with a stop time of 120 and got the output plot, its shown below
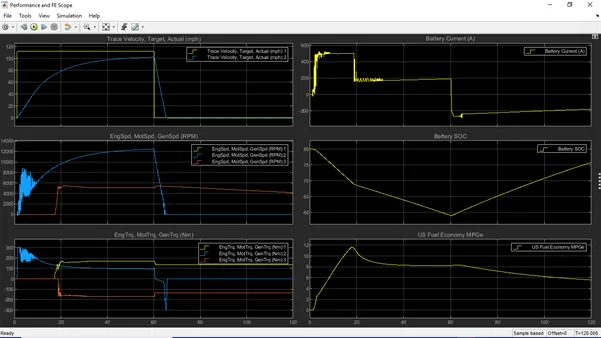
Six plots are there in the output scope plot, first one indicates the trace velocity target, actual (mph) plot, The second Plot represents the speed curve of the Engine, motor, and Generator, the third one is for plotting the torque curve of the motor, engine, and generator, the fourth Plot represents the battery current(A), then the fifth one represents the state of charge of the battery and the final one 6th one represent the US Fuel economy MPGe.
In the First plot blue color line indicate the actual trace velocity and the yellow indicates the targeted path .in the targeted path the increase in velocity happens suddenly but in actual the velocity increases slightly as shown in the blue color path, and then it will decrease slightly and reaches to zero once it completed its drive cycle. The maximum value of the trace velocity target is 111.8 mph in the time of 1.0 seconds but in the actual condition, the vehicle takes 60seconds (time) to reach a velocity of 102.3mph. the actual velocity of the vehicle reaches zero after 65seconds. From the second plot the maximum motor speed is 12450rpm and the engine and generator start after 17 seconds it’s because the battery state of charge reaches below 70 and after 60.7 seconds the motor starts deceleration then the battery starts charging and the engine runs at an rpm of 5373.8. from the 3rd plot of torque of the engine, motor and generator the maximum engine torque is 171Nm, after 60.7 seconds its runs at a torque of 135Nm. From the 4th plot, the maximum battery current is 525Amphere, and the minimum battery current is -286 the negative value indicates that the battery starts charging .from the 5th plot battery state of charge shows that the SOC reaches below 70 then the engine starts running and the motor stops when the battery SOC reaches below 60. The 6th plot shows that the vehicle gets its maximum fuel efficiency of 11.6 at 18th sec that time only the engine getting started.
4)Comparison of the simulated result of hybrid and pure electric powertrains with all parameters kept in the same condition
Simulink model of Powertrain block set of Electric Vehicle and hybrid electric vehicle is shown below in those powertrains the drive cycle selected is FTP75 and the grade value and wind velocity selected as zero and all parameters kept as same
HEV Model is shown below
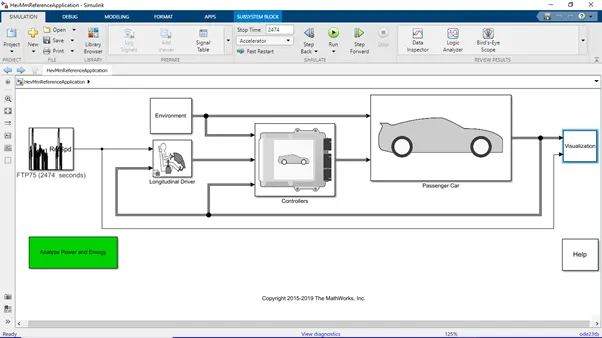
Hybrid Electric Vehicle has both an electric motor and a fuel engine to run the vehicle. the electric motor runs the vehicle up to the value of the state of charge of the vehicle reaches below 70 suddenly the engine starts to run the vehicle and once the SOC reaches to its value 80 then the engine stops and the electric motor starts working
Output Plot of the HEV is shown below
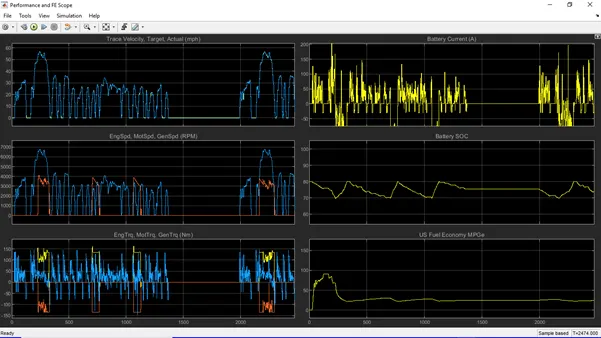
From the plot, the trace velocity actual and target are almost in the same value, in the second plot of the engine, motor, and generator speed. The speed of the generator is the same as that of the engine and the torque of the generator shown as a negative value in the plot it's just because of regenerative braking.HEV gives an RMS value of US Fuel MPG efficiency of 33.
Simulink model of EV Powertrain is shown below
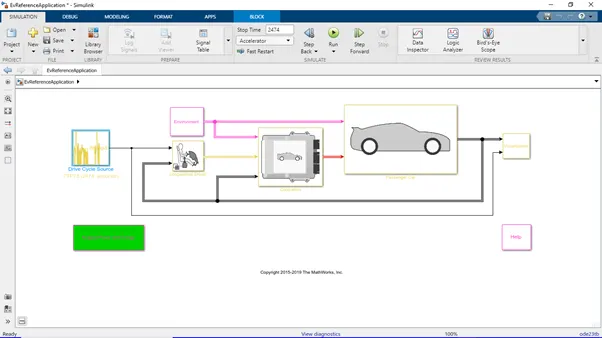
Pure electric vehicle runs by the electric motor in it .The vehicle runs up to certain level of battery charge it recharges by regenerative braking
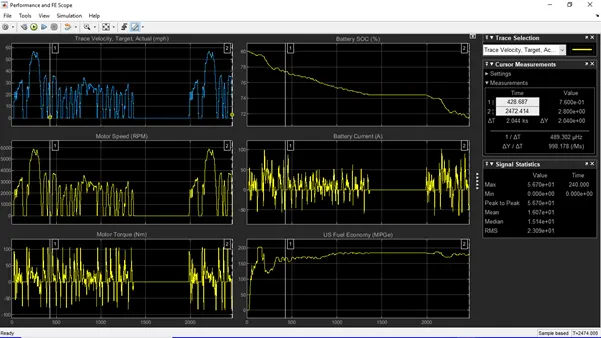
Comparison of Output Values
|
S.No |
HEV |
EV |
Unit |
|
|
1 |
a)Maximum Velocity |
56.4 |
56.51 |
mph |
|
b)RMS Velocity |
23.01 |
23.09 |
mph |
|
|
2 |
a)Engine Speed Maximum |
4121 |
NA |
RPM |
|
b)Engine speed RMS |
1285 |
NA |
RPM |
|
|
3 |
a)Motor Speed Maximum |
6771 |
5872 |
RPM |
|
b) Motor Speed RMS |
2759 |
2391 |
RPM |
|
|
4 |
a)Engine Torque Maximum |
161.9 |
NA |
Nm |
|
b) Engine Torque RMS |
47.58 |
NA |
Nm |
|
|
5 |
a)Motor Torque Maximum |
146.8 |
106.9 |
Nm |
|
b)Motor Torque RMS |
39.58 |
31.57 |
Nm |
|
|
6 |
a)Battery SOC Maximum |
80.2 |
80.00 |
% |
|
b)Battery SOC Minimum |
69.7 |
71.48 |
% |
|
|
C)Battery SOC RMS |
75.24 |
75.43 |
% |
|
|
7 |
a)Battery Current Maximum |
214 |
101.3 |
A |
|
b)Battery Current RMS |
49.81 |
21.04 |
A |
|
|
8 |
a)US Fuel Economy (MPGe) Maximum |
91.33 |
203.4 |
|
|
b) )US Fuel Economy (MPGe) RMS |
33.04 |
174.3 |
Conclusion
Difference between Mapped model and dynamic model stated. In the US MPGe calculation battery power also considering. Pure EV Provides more US MPG efficiency than HEV.
Reference: -
https://in.mathworks.com/help/autoblks/ug/electric-vehicle-reference-application.html
https://in.mathworks.com/help/autoblks/ug/hev-multimode-reference-application.html