Week 7 State of charge estimation
1.Simulate the 3 test cases from harness dashboard and write a detailed report on the results.
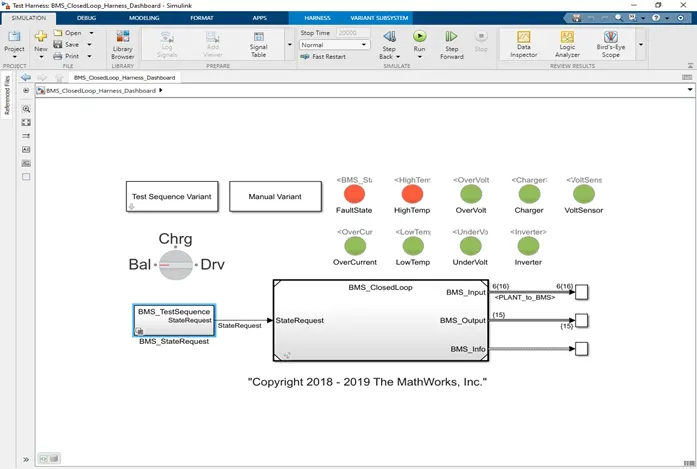
For simulating the three test harness dashboard of different driving conditions the BMS closed loop harness dashboard is been opened. The model is as shown below :-
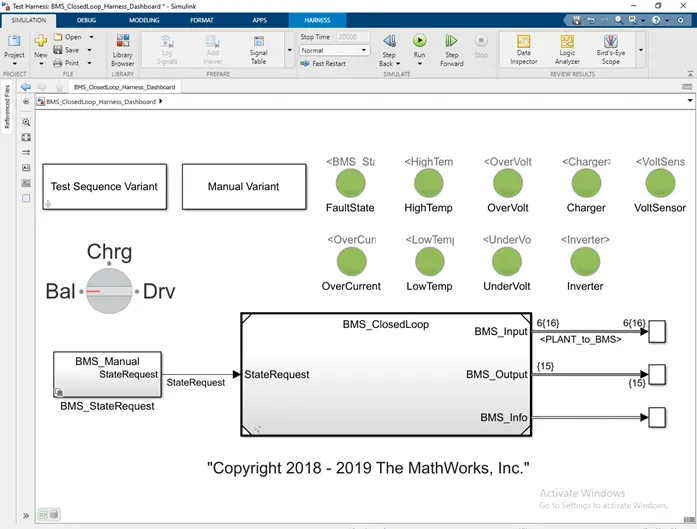
For simulating all three test click on the test sequence variant and from that select the test to be simulated , there are 3 different test.
Here now the first test is been selected :-
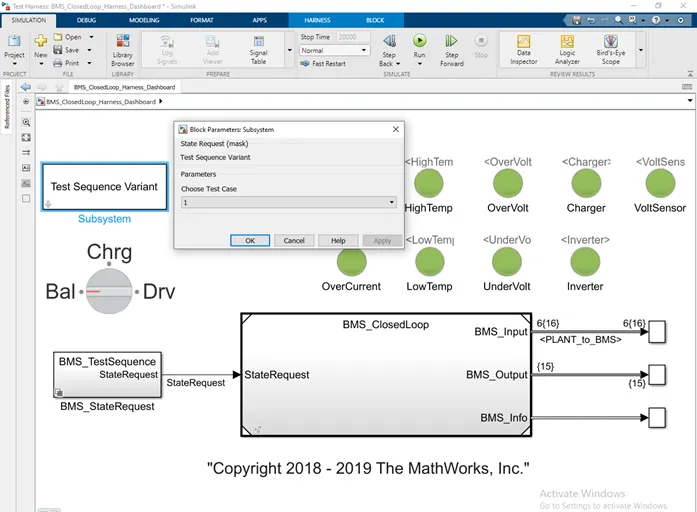
The test 1st is having following conditions :-
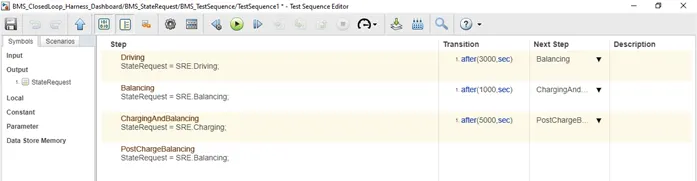
There is driving of the vehicle for the first 3000 sec and after that there is balancing mode for the next 1000 sec than it is followed by charging and discharging for the next 5000 sec and at the end post charge balancing is been carried out till the end of the simulation.
After running the simulation we can see that there is no any fault detected as all the indicators are green in colour.
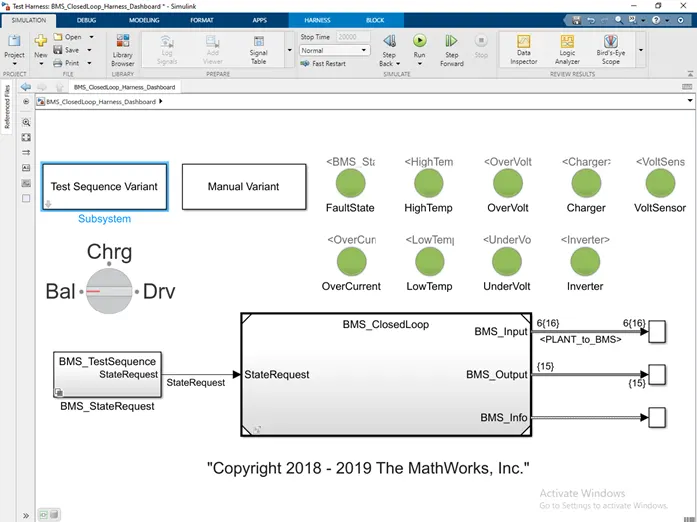
The results obtained after simulation are as follows :-
Overview of the result :-
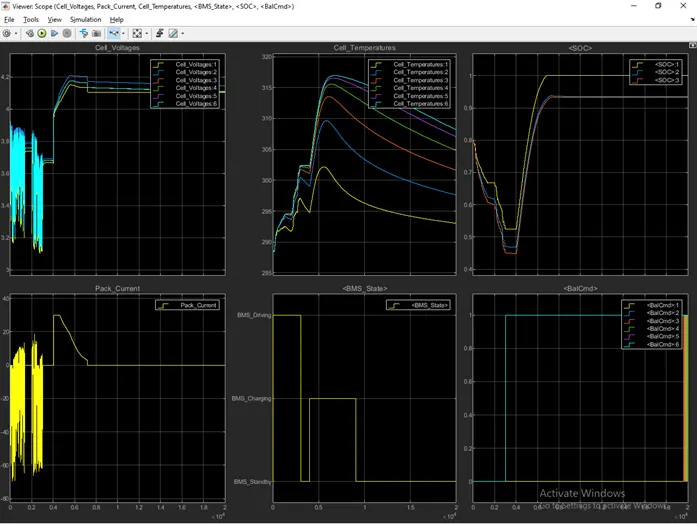
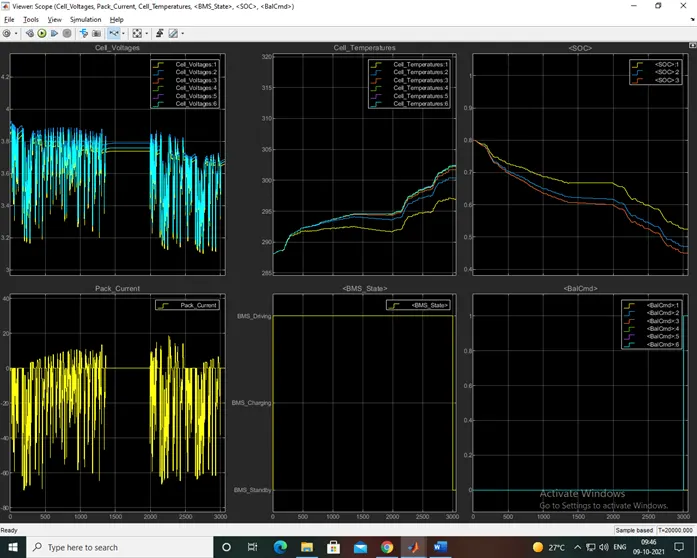
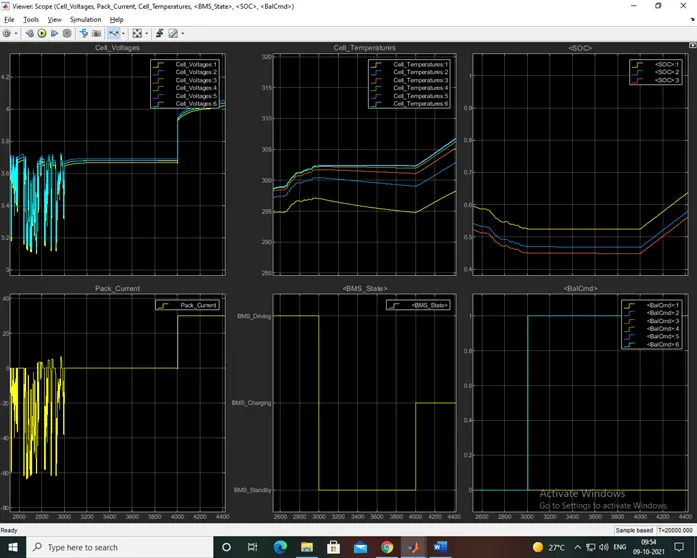
Here we can see that at the beginning of the test there is driving mode and at that time there is lot of fluctuations in the voltage as well as current for the first 3000 sec and the cell temperature is been increased from 287 deg cel to 303 deg cel , the soc is been dropped from 80% to 45% and in this BMS state is showing driving state , for the next 1000 sec there is balancing / standby for 1000 sec where we can see there is some stability in current , voltage and temperature and even the soc and in this state the temperature of cell is been increased upto 317 deg cel , for the next 5000 sec the charging and balancing mode is been activated and where we can see the charging is been done by constant current method first and after than its followed by constant voltage the SOC is been increased from 45% to 100% and the BMS state is charging for the next remaining simulation the voltage is been maintained near about 4.2 voltage and the soc is been at 100% the temperature of the cells is been starting decreasing and there Is decrease in the current and the BMS state is indicated as standby.
Test 2
Here noe the second test is been selected :-
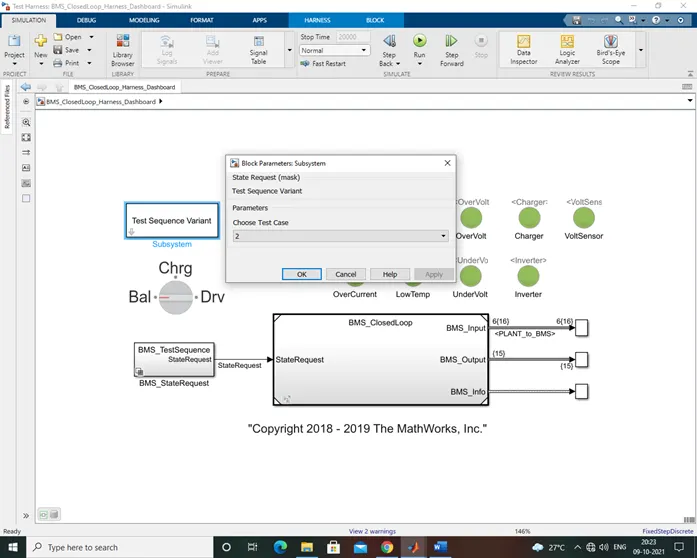
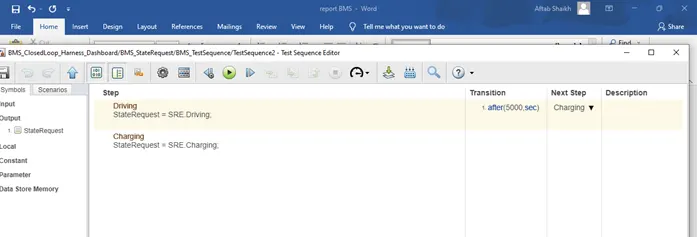
In this test only two different conditions are been tested that are driving and charging the driving is been carried for first 5000 sec and for the rest of the simulation the charging is been carried out.
The results that we get after the simulation are as follows :-
Dashboard for test 2:-
Simulation for 0 to 5000 sec :-
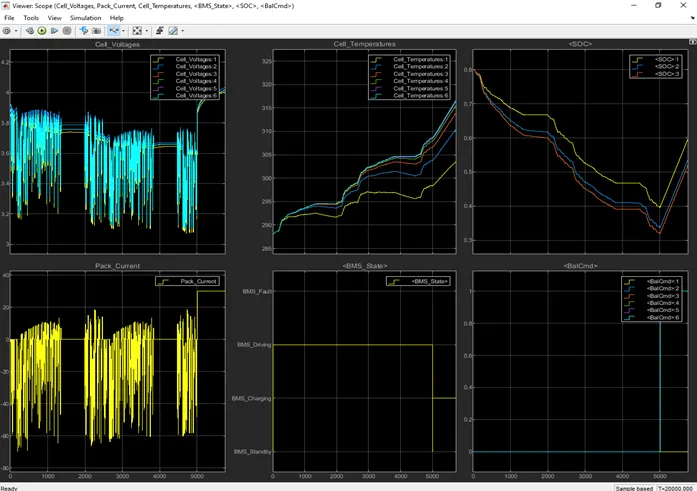
Simulation from 5000 to 20000 sec :-
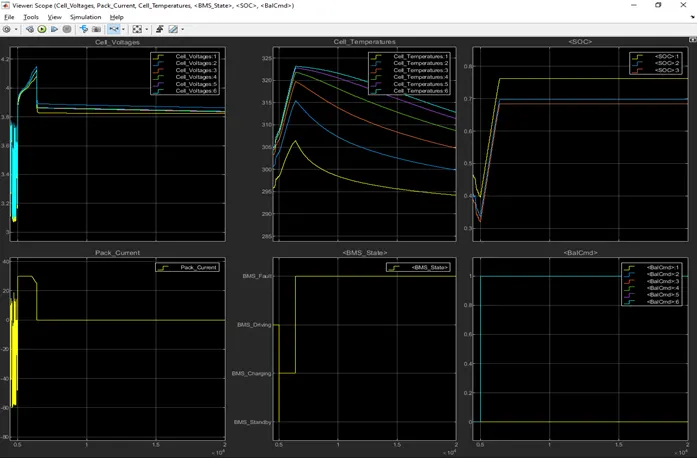
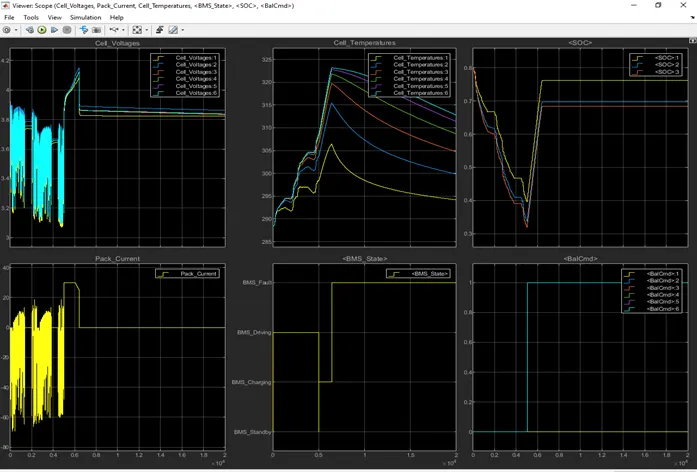
As for the first 5000 sec the driving is carried out we can see there that there is lot of fluctuation at the start of the simulation from 0 to 5000 sec and the cell temperatures is been increased from 290 deg cel to 308 deg cel at time period of of 5000 sec and the SOC is been dropped from 80% to 32% and the BMS state is indicated as driving after this the next condition is been simulated and its shifted from driving to charging state after 5000 sec , here we can see there is charging of the battery first by constant current and after that its followed by constant voltage but we can see here that there is tremendous rise in the temperature of the cell the cell temperature has been reached its high 323 deg cel because of this there is warning for temperature indicator on the dashboard but at 6500 sec the fault is been detected and the BMS state is indicated as fault instead of charging , when the fault is been detected the charging is been stopped and we can see as the charging is stopped the cell temperature have started decreasing the SOC is been increased to 76% at the end of the simulation.
Test 3 :-
Here now the test 3 is been selected :-
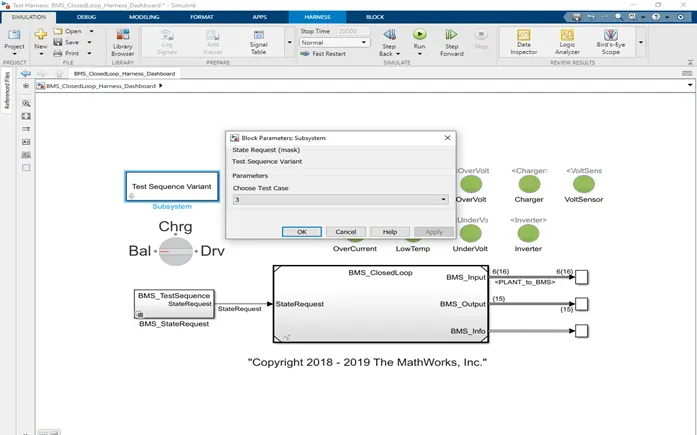
In this test only charging is been carried out ,

After running the simulation for the test 3 the result are as follows :-
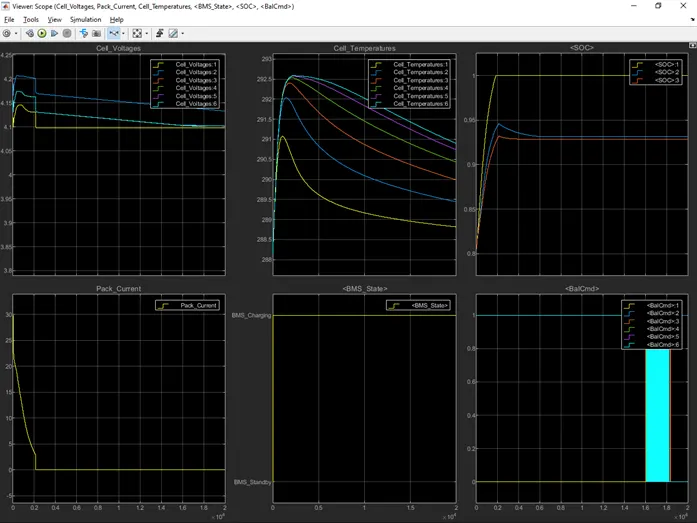
As in this simulation only the charging condition is been selected during charging the the cell voltage is been reached to 4.2 voltage and cell temperature is near about 293 deg cel when the battery pack is fully charged the SOC is been reached to 100% 1800 sec and after that the cell temperature have started to decreasing and finally the cell voltage is been set between 4.1 and 4.15 voltage and the balancing is been carried out . There is no any warning on the dashboard .
Conclusion :-
For the first test four conditions are been carried out there they are driving , balancing , chargingandbalancing and post charging balancing and there is no any fault detected during the simulation
For the second test only two conditions are been simulated and they are driving and charging but in this simulation the fault is been detected during charging state as the cell temperature is been increased beyond the limit.
And in the third test only one condition is been simulated that is charging and in this there is no any fault or warning detected on the dashboard.
2.What is coulomb counting? Refer to the above model and explain how BMS implements coulomb counting for SOC estimation ?
Coulomb Counting Method
The Coulomb counting method measures the discharging current of a battery and integrates the discharging current over time in order to estimate SOC. Coulomb counting method is done to estimate the , which is estimated from the discharging current, , and previously estimated SOC values, . SOC is calculated by the following equation:
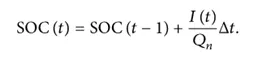
But there are several factors that affect the accuracy of Coulomb counting method including temperature, battery history, discharge current, and cycle life.
Modified Coulomb Counting Method
To improve the Coulomb counting method, a new technique called modified Coulomb counting method is proposed. The modified Coulomb counting method uses the corrected current to improve the accuracy of estimation.
The corrected current is the function of discharging current. There is a quadratic relationship between the corrected current and discharging current of battery. By practice of experimental data, corrected current is calculated by the following form:
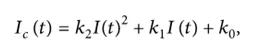
where , k2, k1 and k0 are constant values obtained from the practice experimental data.
In modified Coulomb counting method, SOC is calculated by the following equation:
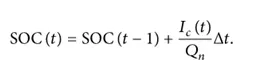
The BMS closed loop model is as shown below ,
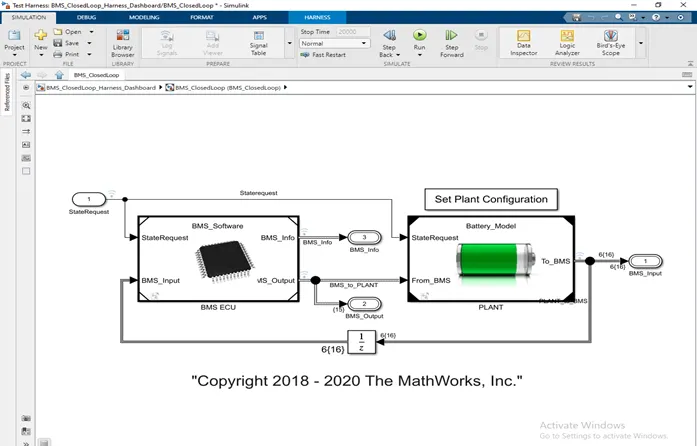
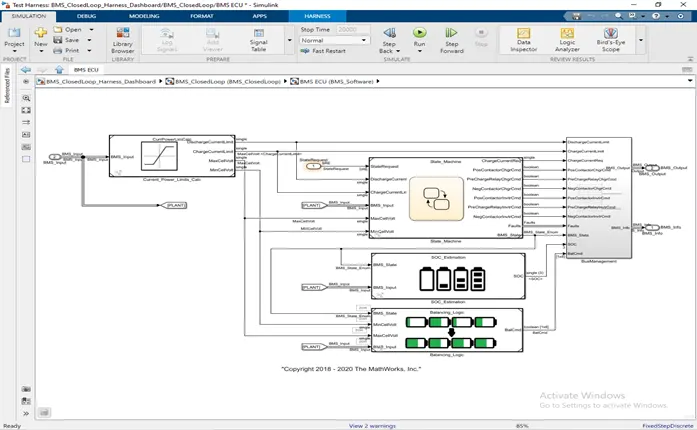
It consists of the state machine , SOC_Estimation and balancing logic subsystem if we double click on SOC Estimation there we can find coulomb counting subsystem :-
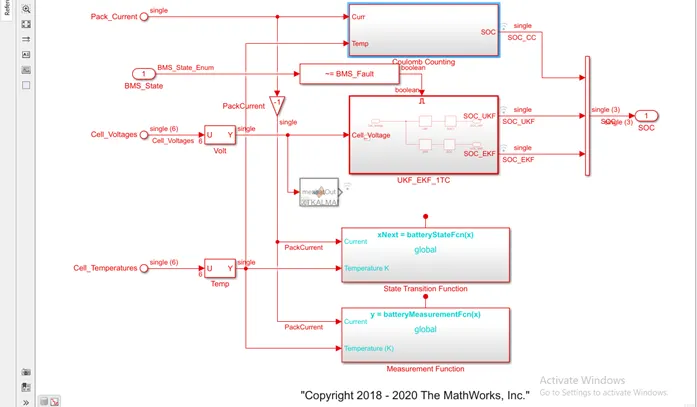
The coulomb counting subsystem is as shown below :-
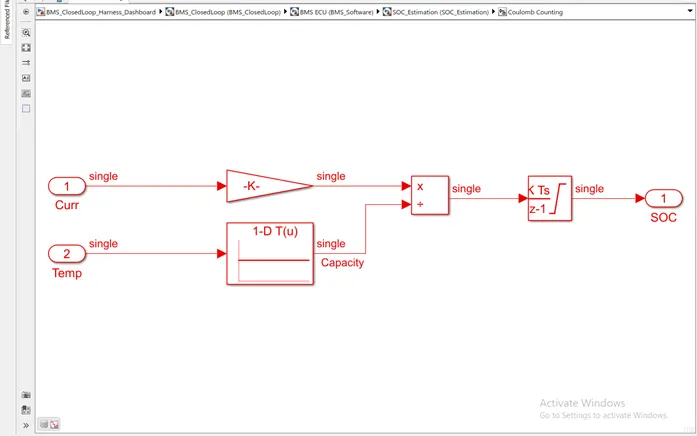
The coulomb counting method has followimg blocks
Gain , capacity integrator , etc
The system is given two inputs the current and temperature , the current input is given to the gain block and the temperature input is given to the capacity and after integrating the SOC is estimated.
here the SOC calculation are been calculated from the above the mebtioned formula and implimented in the simulink model.