Week-4 Challenge WOT Condition Part-2
- What is the difference between mapped and dynamic model of engine, motor and generator? How can you change model type?
Ans :-
In mapped model we have the parameters related to the block in the form of look up tables ( list or tables ) In mapped models the values related to block is been taken from the observations which are done in lab and then this values are been taken into consideration for further simulation , they are generally as a reference for modelling while in Dynamic model the actual model is been simulated by modelling it in the MATLAB itself. The dynamic model is the actual model on which we are simulating the actual system.
Mapped engines represent macro engine behavior as a set of lookup tables (brake torque, fuel flow, air mass flow, exhaust temperature, efficiency, and emissions) as functions of commanded load and measured engine speed. Dynamic engines decompose engine behavior into individual component models that account for engine dynamics, most notably intake airflow and turbocharger dynamics.
How can you change model type?
For changing the model type from mapped to dynamic , follow the steps as mentioned below:-
Method one:-
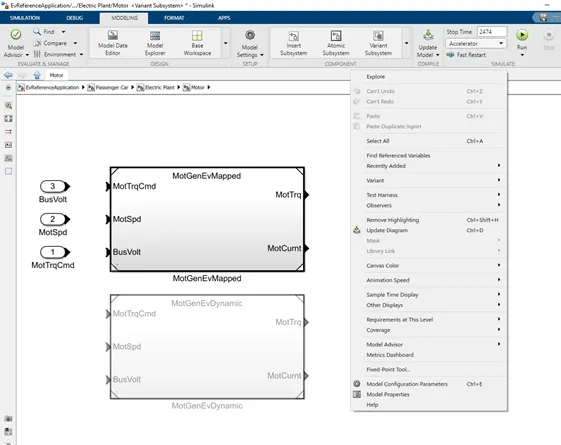
- Open the passenger car subsystem block – electric plant – motor
- Open the motor block
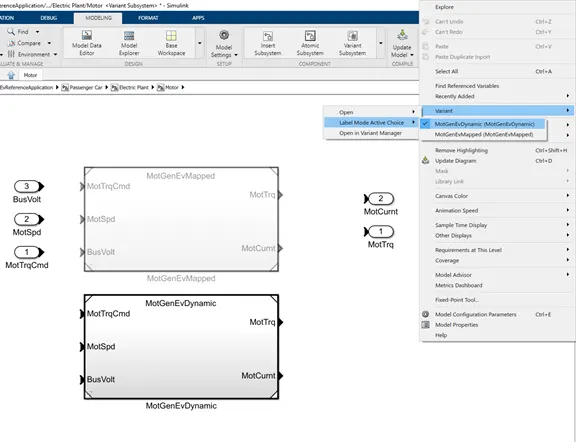
- There are two models shown – mapped and dynamic
- For changing the model type right click the mouse button – click on variant – label mode active choice – then select the dynamic model
2. How does the model calculate miles per gallon? Which factors are considered to model fuel flow?
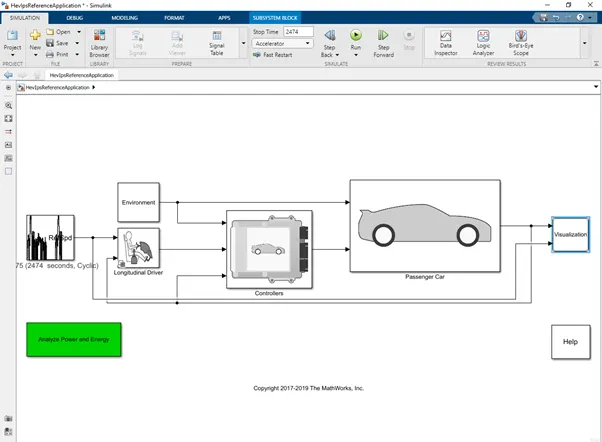
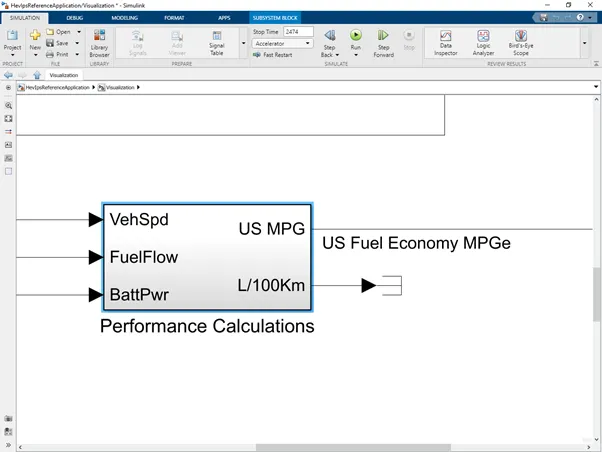
- For calculating the miles per gallon we need to open the HEV powertrain block > open the visualization block > open performance calculation block .
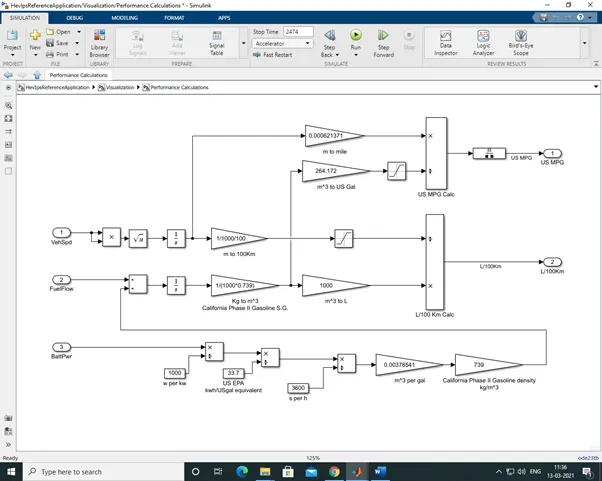
2.The miles per gallon are calculated as follows :-
1.The battery power is been taken in watts and the its converted in kilowatts by dividing it by 1000w , after this the energy or power in kilowatts is converted into USgal equalent by dividing it by 33.7 , then this value is converted in hours by dividing by 3600 sec and this value is multiplied or gain by 0.00378541 to convert m^3 per gallon
2.This gallon is then multiplied by the gasoline density i.e- 739
3.The fuel flow is taken as the second input and added with the density of fuel after this the required integration is been done and the value is converted from kg to m^3 and then again from m^3 to USgal .
4.The third input is taken as vehicle speed and its converted into miles
5.For obtaining the miles per gallon the final miles of vehicle travelled is been divided by the gallons of fuel .
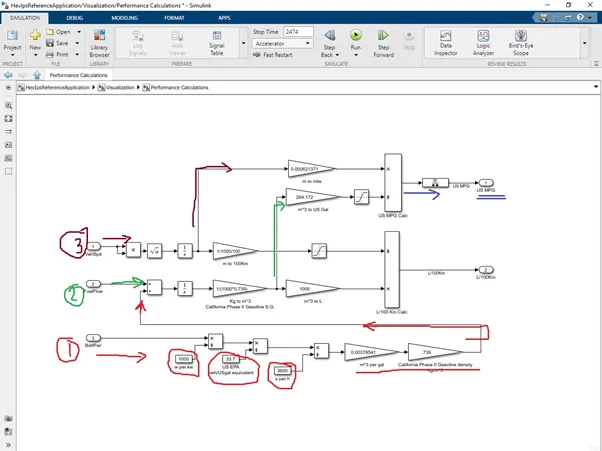
3.Run the HEV ReferenceApplication with WOT drive cycle. Change the grade and wind velocity in the environment block. Comment on the results.
- For running the HEV reference application open the model
- Open the driving cycle block
- Change the driving cycle from that and set it to WOT
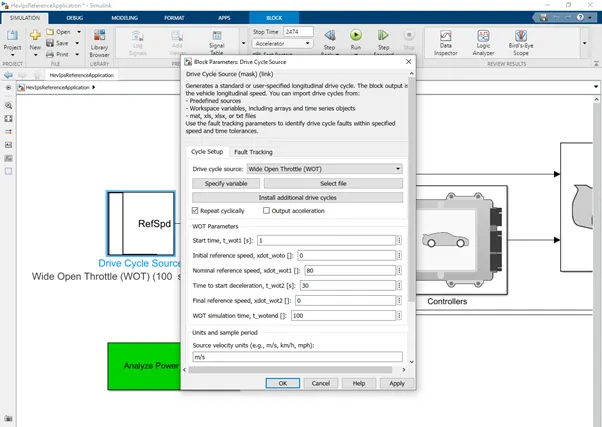
- Set the WOT parameters as per requirements and apply it .
- Run the simulation.
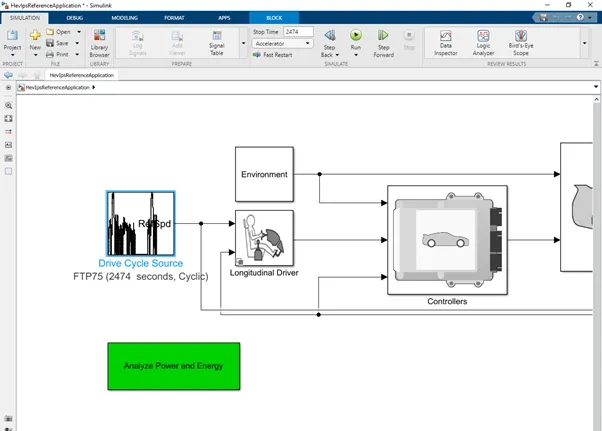
Select the driving cycle as shown in below fig-
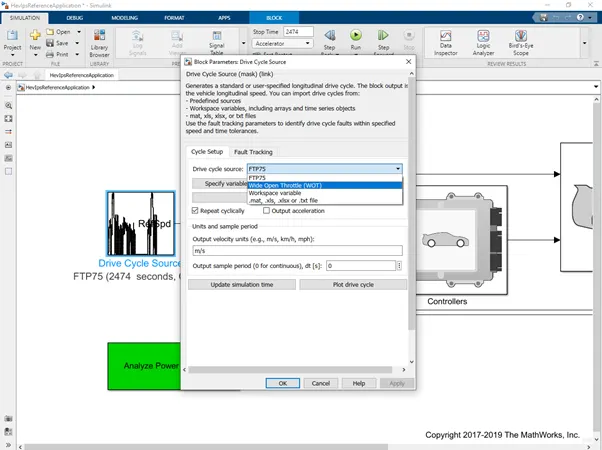
Set the parameters of WOT –
4.Change in grade and velocity for WOT test-
- For running the HEV reference application open the model
- Open the driving cycle block
- Change the driving cycle from that and set it to WOT
- Set the WOT parameters as per requirements and apply it .
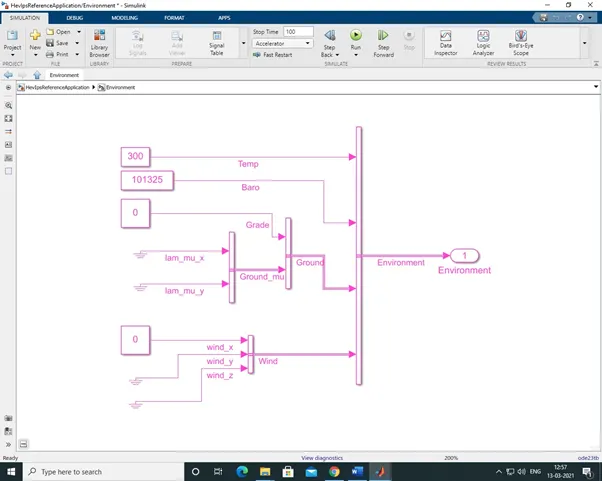
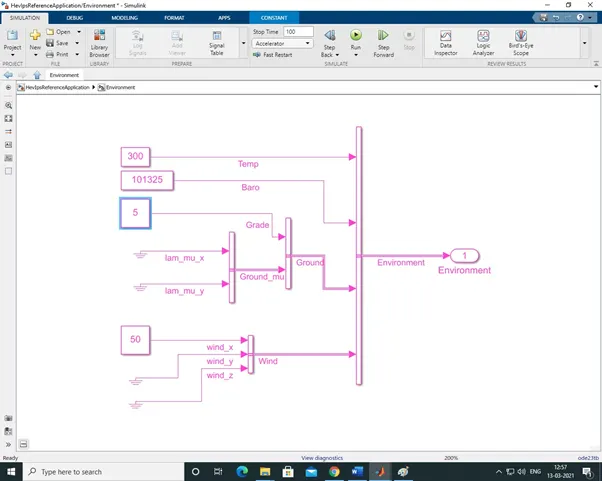
- For changing the grade and velocity open the environment block and there make necessary changes in grade and velocity block .
The original grade before changing the grade and velocity paramerters -
After making the changes in grade and velocity , the grade is set to 5 degree and velocity is set as 50 –
The results of default WOT and WOT changes made in grade and velocity are discussed below-
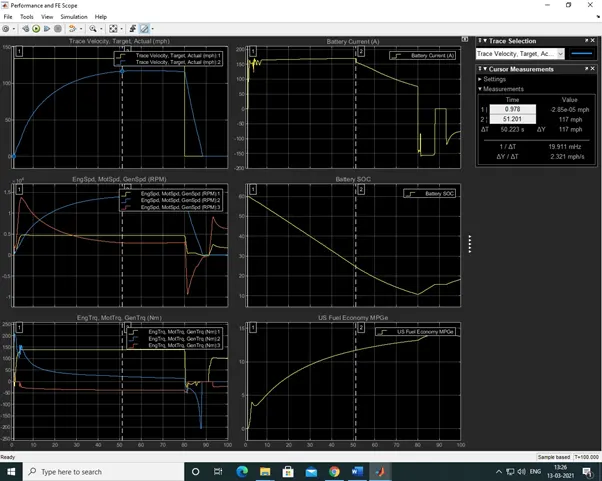
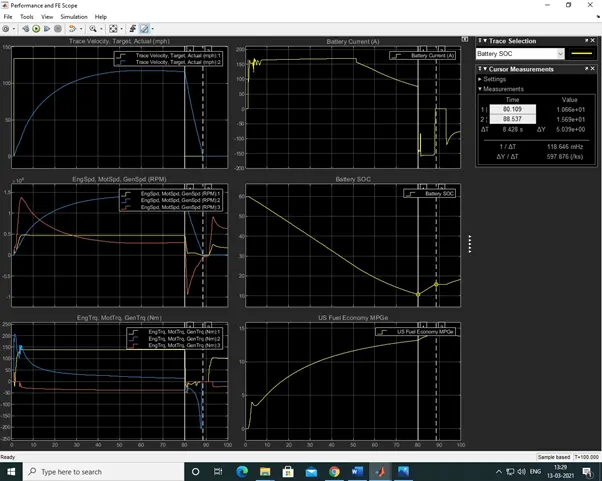
- When the wide open throttle test are carried out for 0 grade and 0 velocity the results are as follows –
- The top speed which the vehicle can achieve is about = 117 mph in 50 sec
2.Change in soc while deacceleration –
There is an increase in soc of battery by 5.039% during deacceleration from 117 mph to 0 mph
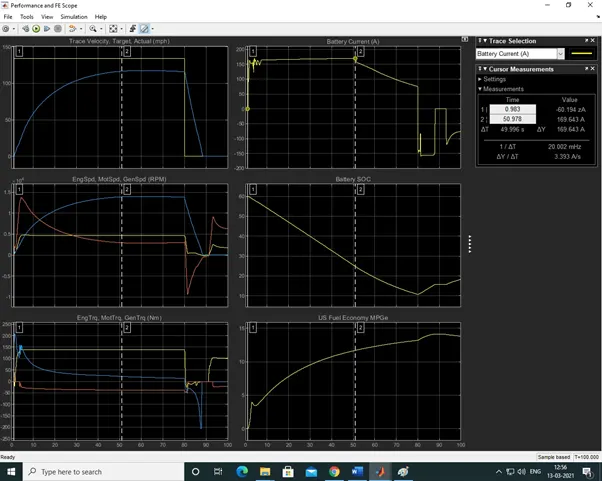
3.Current requirement –
To acchive the top speed during WOT test the current which is drawn to peak is about 169.6 A.
B.When the wide open throttle test are carried out for 5 degree grade and 50 velocity the results are as follows –
- The top speed which the vehicle can achieve is about = 51.8 mph in 41.8 sec , the top speed is been decreased from 117 mph to 51.8 mph
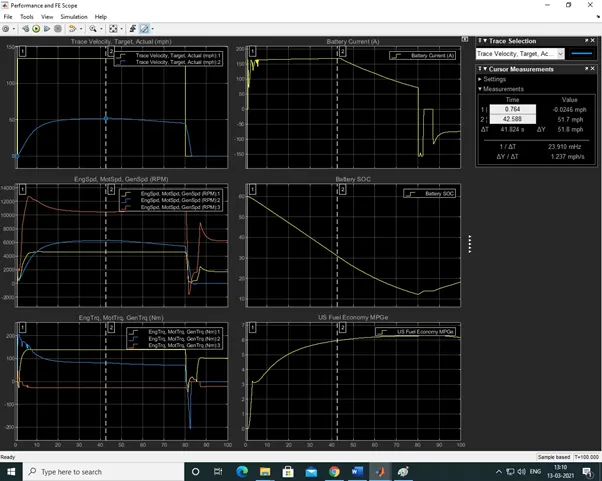
2.Change in soc while deacceleration –
There is an increase in soc of battery by 1.529% during deacceleration from 51.8 mph to 0 mph
- Current requirement –
To acchive the top speed during WOT test the current which is drawn to peak is about 169.6 A. there is no difference between the current drawn from battery before and after changing the parameters of grade and velocity.
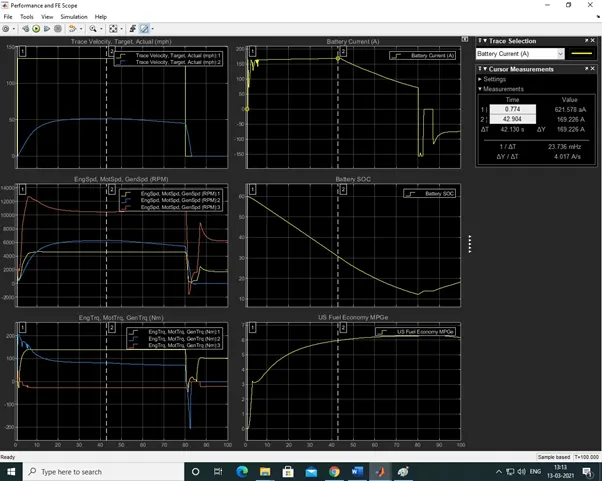
Table showing the results for both WOT test :-
|
Parameters |
No change in grade & velocity |
Changes made in grade(5 degree) & velocity (50m/s) |
|
Top speed achieved |
117 mph |
51.8 mph |
|
Time require to achieve top speed in wot |
50 sec |
41.8 sec |
|
SOC increaser during deacceleration |
5.030% |
1.529% |
|
Current required to achieve top speed |
169.643 A |
169.643 |
Q4. Keeping all other parameters same, compare the simulated results of hybrid and pure electric powertrains.
The pure electric vehicle is one which runs purely on an electric propulsion system and there is no any assistance provided by any other fuel source.
While the hybrid electric vehicle is one which uses two or more fuel sources to propel the vehicle , in this model an engine along with an motor and generator is been used .
Pure electric vehicle and Hybrid electric vehicle are been compared with each other by keeping all the parameters same and using the similar driving cycle for both the models . the driving cycle which is been used for this simulation is FTP75 .
Hybrid electric model:-
- The hybrid electric model consists of driving cycle block , environment subsystem , longitudinal subsystem , control subsystem , passenger subsystem and visualization subsystem.
- This each subsystem consists of many blocks inside it which are been used for modelling the system.
Pure electric model:-
- The pure electric model consists of driving cycle block , environment subsystem , longitudinal subsystem , control subsystem , passenger subsystem and visualization subsystem.
- This each subsystem consists of many blocks inside it which are been used for modelling the system.
The results of both the system are as follows :-
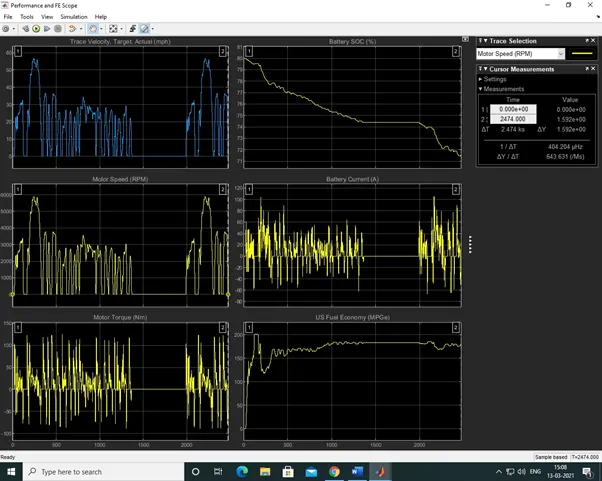
Pure electric model results:-
- Max motor speed (RPM) = 5900 RPM
- Max Motor torque (Nm) = 125.8 Nm
- Max battery SOC at start of driving cycle was = 80%
Min battery SOC at the end of driving cycle = 71.55%
Total decrease of battery SOC after complete driving cycle = 8.45%
- Battery current:-
Max current = 105 A
Min current = -64..4 A
Mean current = 7.9 A
- US fuel economy (MPGe) :-
Mean economy = 172 MPGe
Pure electric model results:-
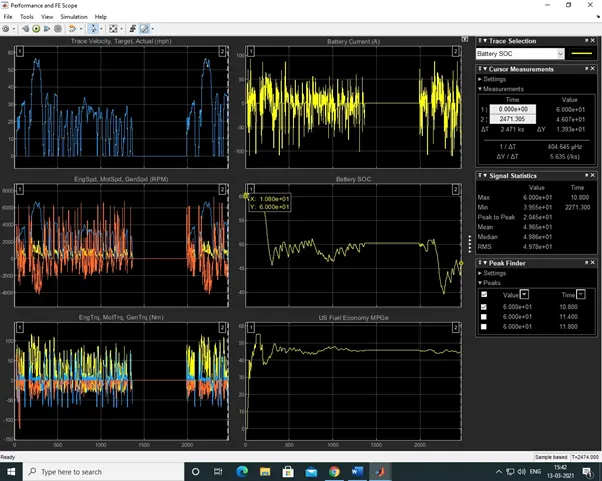
Hybrid Electric model Results :-
- Max Speed (RPM):-
Engine = 2414 RPM
Motor = 6700 RPM
Generator = 7350 RPM
- Max Torque (Nm):-
Engine = 117 Nm
Motor = 73 Nm
Generator = 67 Nm
- Battery current :-
Max current= 94 A
Min current = -110 A
Mean current = 1.3 A
- Battery SOC :-
At start of driving cycle = 60%
At end of driving cycle = 46%
Total fall of SOC = 14%
- US Fuel economy (MPGe)=
Mean economy = 44.95 MPGe
Hybrid Electric model Results :-
conclusion of result:-
the fuel economy of pure electric vehicle is better than the hybried electric vehicle .