Week - 4
- Implement control logic of a “washing machine” using Stateflow as per given sequence:
- If the power supply is available, the system gets activated
- If the Water supply is not available, stop the process & indicate through LED
- Soaking time should be 200s followed by Washing time of 100s.
- Then rinsing happens for next 20s & dryer runs for 50s
After all the processes have completed turn on the finished LED
Ans:-
- For implementing the control logic of washing machine using stateflow we have to open the Simulink model in matlab,
- After opening the Simulink model , for opening the finite stateflow machine search for chart block.
- Double click on chart mode/block, The chart mode is different then Simulink environment and it appears to be light yellowish in colour.
- So for creating the control logic in stateflow , first we have to define the state as per given conditions in challenge , for this we use ‘state’ to create chart.
- We will use first state as supply after that supply state we will be creating the second state of power supply , so we will use default transition to connect power supply after supply state
- For this default transition we will apply condition that if the supply is on then only the logic will simulate further and if its off then it will stop, so the conditions are given in this manner-
[power_supply==1] this means the supply is on
[power_supply==0] this means the supply is off
In this. if the power supply is on then an only it will pass on to next step/check is water supply on or not.
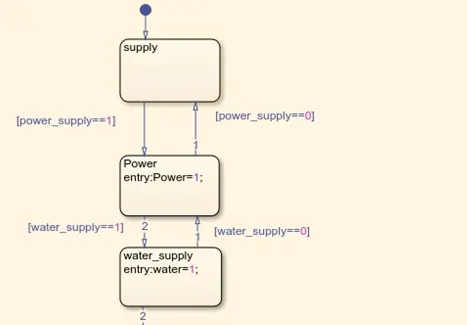
In state we have to provide a key for it so for that in power state a key is provided as Power=1 , so if it get this as a key the it will work further.
7.In this manner we will create next state of water supply by using state function and give transition to it from power supply to water supply. The conditions are as follows:-
[water_supply==1] here the water supply is on
[water_supply==0] here the water supply is off
Similarly as mentioned earlier here to we have to provide the key for water supply state –
For this the key is water=1
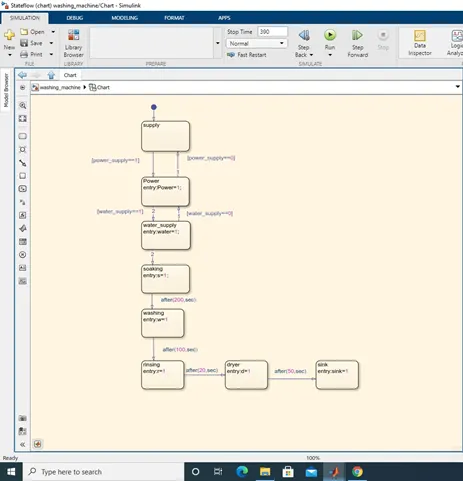
8.After this we have to create the next state as mentioned in the challenge , so the next states are soaking , washing , rising , drying and sink , so we will be creating this following states as per sequence In chart and assign the keys s=1, w=1, r=1, d=1, sink=1 respectively.
9.Here for the states as mentioned above we will be providing delays as given in challenge. For giving delay we have to define in transition as eg:- after(20,sec)
how the delays are been provided for respective states is shown in below fig.-
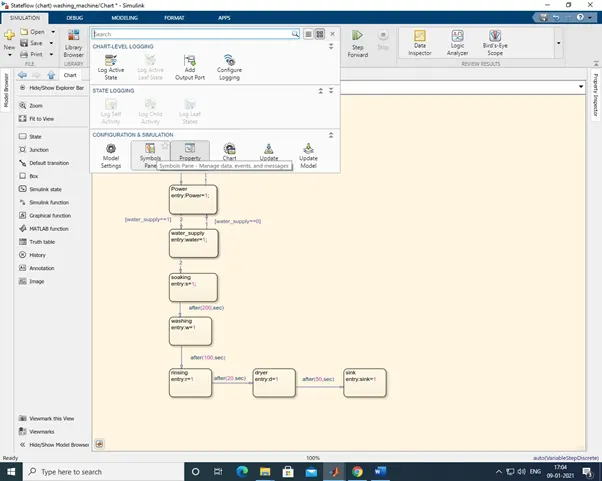
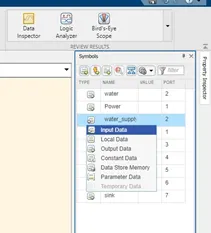
10.After building the chart as per logic we have to specifi the keys as inputs or the outputs for this we use symbol pen
11.After opening symbols pen symbols menu will get open in that all the keys will be displayed , here we have to just specify them as input data or the output data.
Symbols menu will look like this –
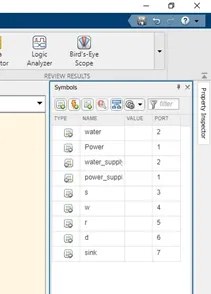
Specify as input or output data:-
12.Here the chart work is over , Come out of the stateflow chart and connect the constant blocks to the power_supply and water_supply input ports respectively.
13.After this use the knob block for dashboard library and connect to the respective input data ports of power & water supply. Therefore we will be requiring two knobs .
14.For connecting the respective knobs to the constant blocks double click on knobs , then one dialogue box will open , in it there is option as connect click on it and select the constant block with which its to be connected.
15.Connect displays to the output ports.
16.After connecting the displays to the output ports link the lamp with it so the lamp will light on when that specific condition gets on.
17. As we have connected the knob block with the constant block in similar manner we have to connect the display with the lamp respectively .
18. The last thing is to simulate the model for some greater no. of sec then the sum of delays given to the states.
19.In final the Simulink model will look like below-
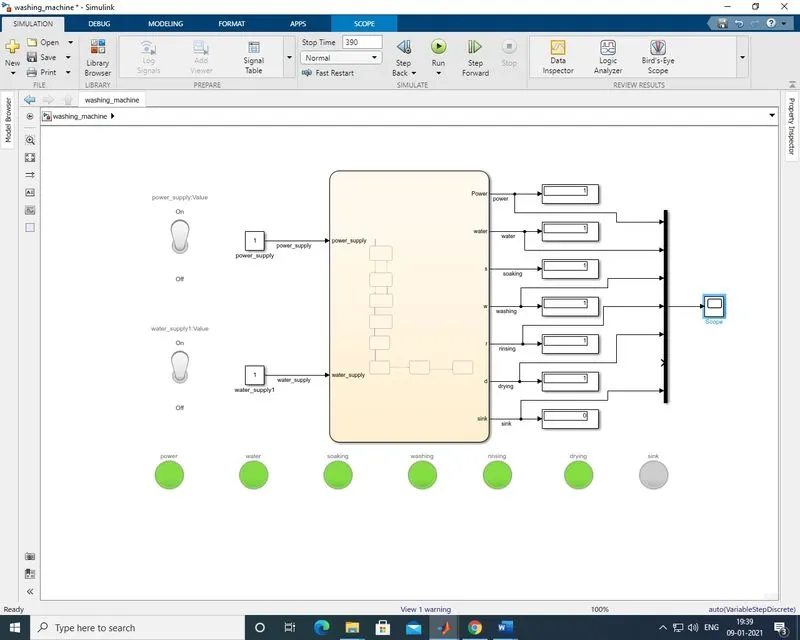
in above fig i have just connected all the output ports to the scope by using mux block.
this are the results which are displayed in scope-
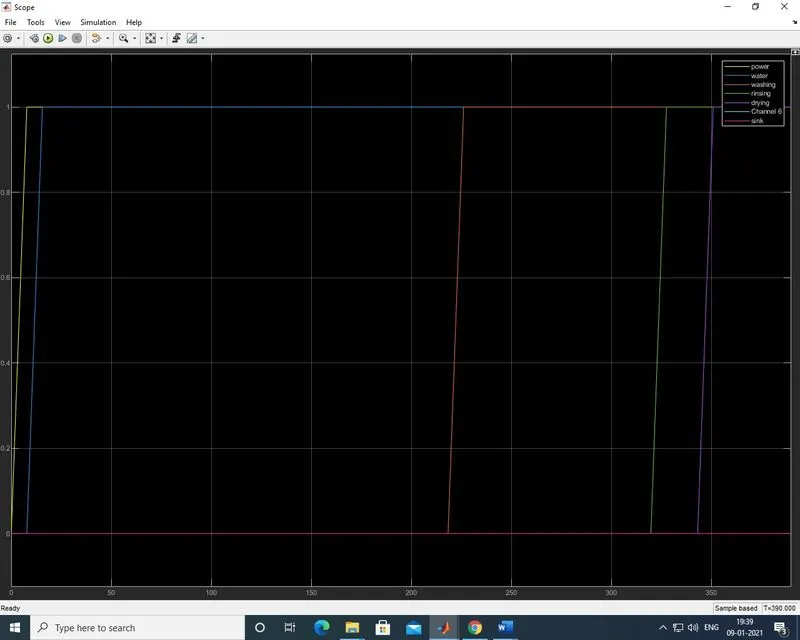
from the scope result it is clear that all the conditions are performed as per time intervals
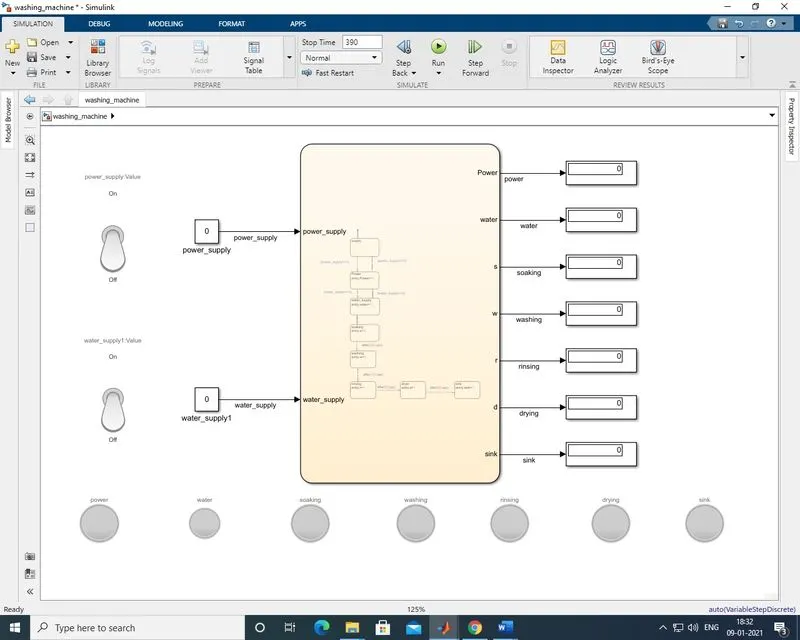
if power is off and water supply is off then the washing machine will not start, the simulation is shown in below fig, in this fig all the lamps are off which means the further conditions are not performed.
if power is on and water supply is off then only first lamp off power is be lighted green and rest of will be off .its shown in below fig-
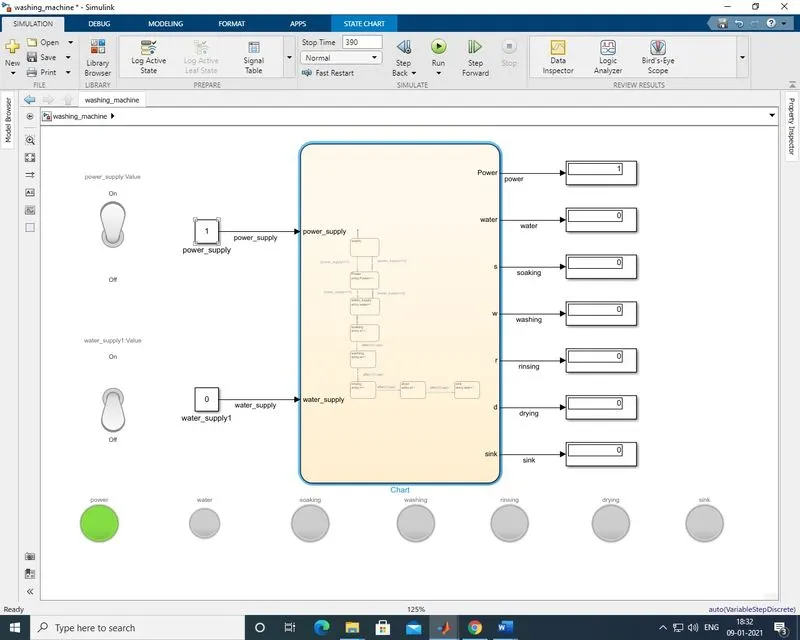
if both power and water supply is on then only the system will perform in full cycle , its shown in below fig- , here all the conditiions are performed so the lamps are turned green.
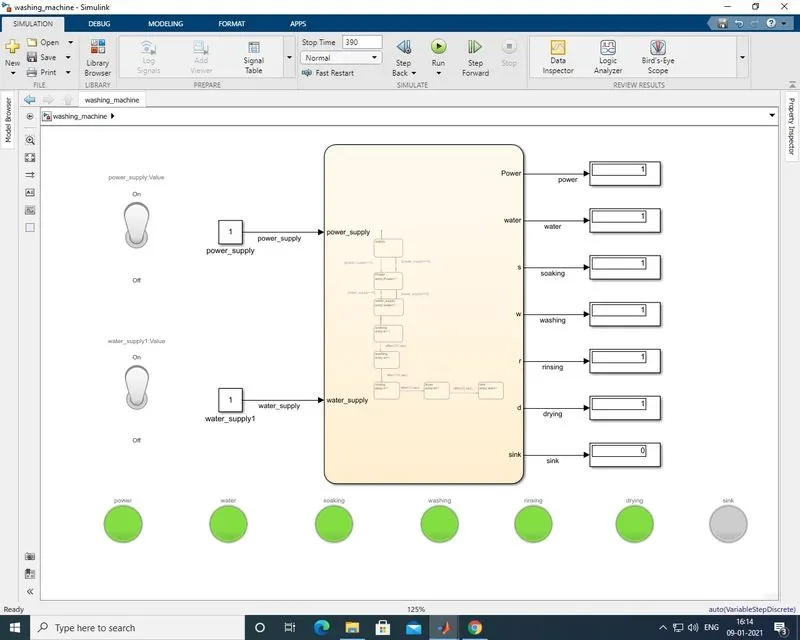
NOTE- I have attached the slx. file of washing_machine pls go through it and simulate all the three conditions.
- Make a Simulink chart for the “Gear shift” logic as per below conditions:
Speed Range(kmph) Gear
0 to 15 1
16 to 25 2
26 to 40 3
41 to 60 4
Above 61 5
Give speed input while the simulation is running & display the gear number.
Ans- for modelling this I have used following blocks :-
- Chart
- state
- Constant
- Slider
- dispaly
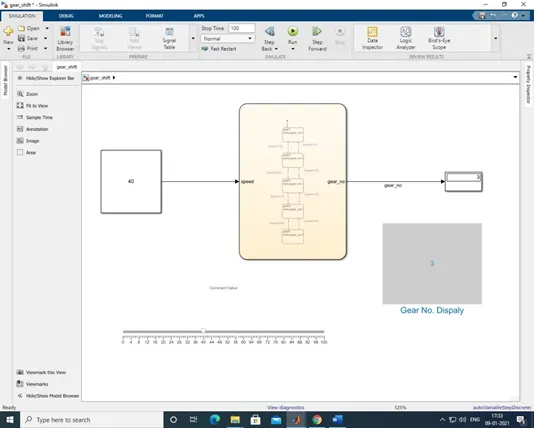
- For implementing the control logic of washing machine using stateflow we have to open the Simulink model in matlab,
- After opening the Simulink model , for opening the finite stateflow machine search for chart block.
- Double click on chart mode/block, The chart mode is different then Simulink environment and it appears to be light yellowish in colour.
- So for creating the control logic in stateflow , first we have to define the state as per given conditions in challenge , for this we use ‘state’ to create chart.
- So for given condition we will be building the states as followes:-
Speed Range(kmph) Gear
0 to 15 1
16 to 25 2
26 to 40 3
41 to 60 4
Above 61 5
after building the states we will have to give conditions as above mentioned
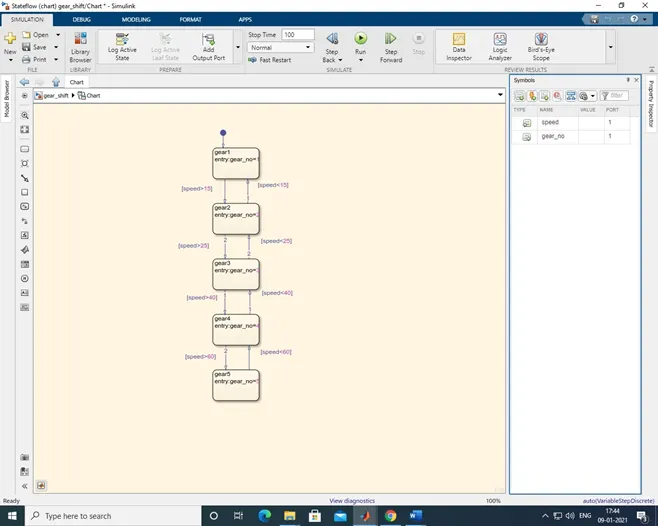
6.After giving conditions , specify the input and output ports by using symbols pen and specify speed as input data and gear_no. as output data.
7.Here the chart work is over , Come out of the stateflow chart and connect the constant blocks link this constant block with the slider.
8.Connect the display to the output port to gear_no.
9.Link the dashboard display with the Simulink display and run the simulation.
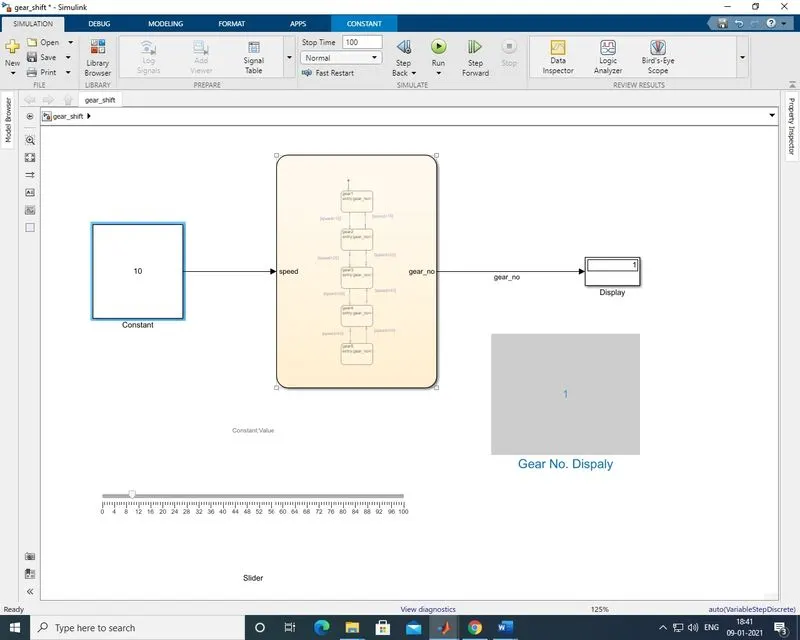
here if the speed is between 0-15 kmph then it has to work in 1st gear or display 1st gear, so i have set speed to 10 then the car will be in first gear -
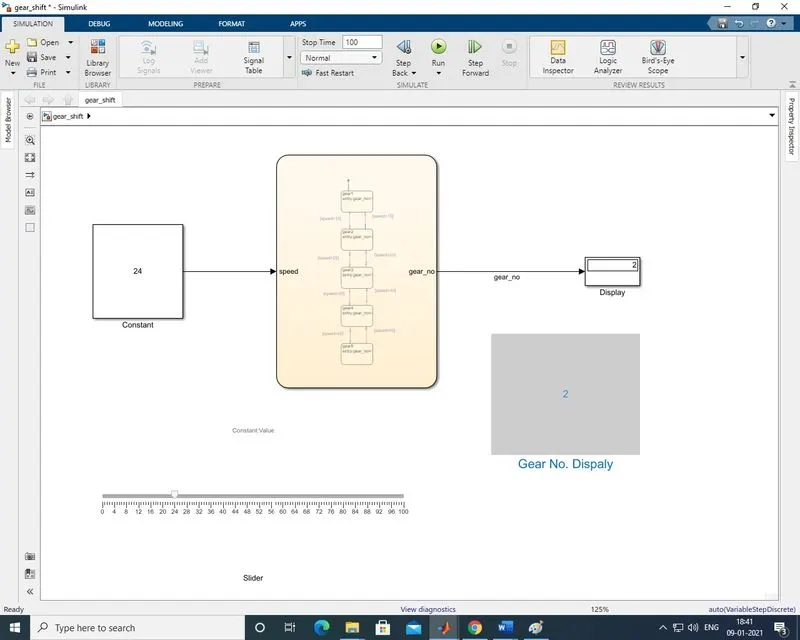
here if the speed is between 16-25 kmph then it has to work in 2nd gear or display 2nd gear, so i have set speed to 24 then the car will be in 2nd gear-
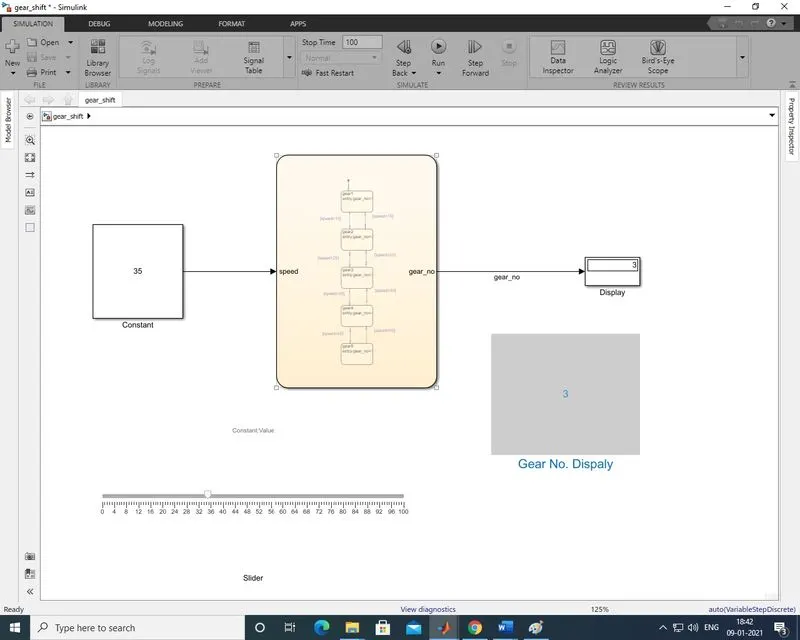
if the speed is between 26-40 kmph then it has to work in 3rd gear or display 3rd gear, so i have set speed to 35 then the car will be in 3rd gear-
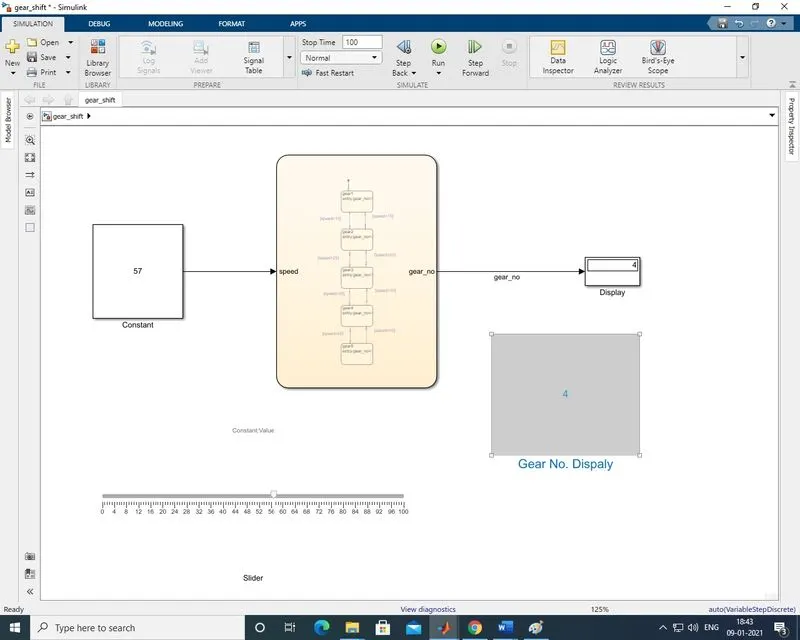
if the speed is between 41-60 kmph then it has to work in 4th gear or display 4th gear, so i have set speed to 57 then the car will be in 4th gear-
if the speed is above 61 kmph then it has to work in 5th gear or display 5th gear, so i have set speed to 90 then the car will be in 5th gear-
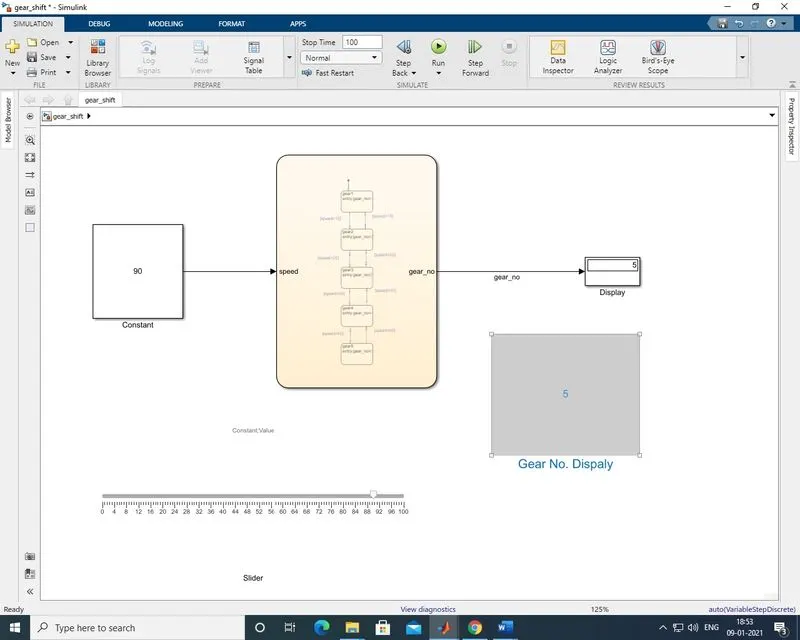
in this manner the simulink model is been modeled correctly as per given conditions.
NOTE- I have attached the slx. file of gear_shift pls go through it and simulate all the 5 gear conditions.