Week 7 State of charge estimation
AIM: To estimate the State Of Charge
OBJECTIVE:
1. To simulate the 3 test cases from harness dashboard and to write a detailed report on the results.
2. To explain about coulomb counting and refer the model to explain how BMS implements coulomb counting for SOC estimation.
SOLUTION:
1. To simulate the 3 test cases from harness dashboard and to write a detailed report on the results.
Ans. Battery Management System plays a vital role in the battery pack performance. The following figure shows the BMS working and its interface with various other systems.
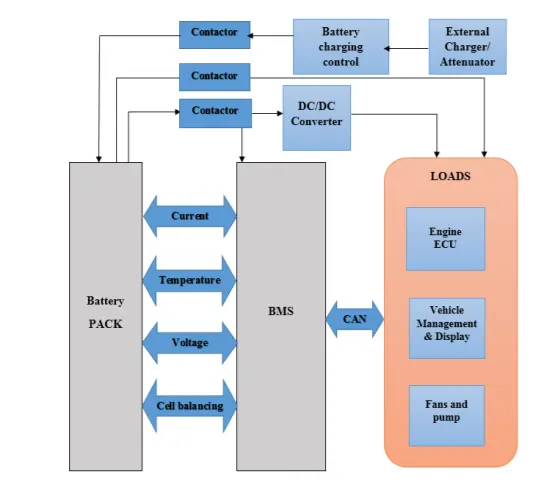
Cell balancing is done by BMS to get maximum from battery pack. CAN bus is used to communicate with user or dashboard of vehicle with ECU's etc. All the parameter readings are reviewed by the battery pack, to ensure the performance.
This is the model of BMS and plant(battery system)
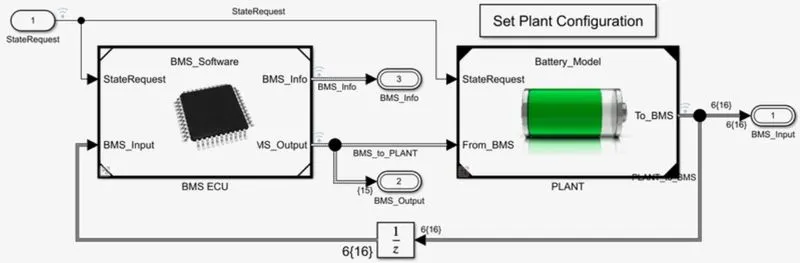
BMS ECU is a subsystem, from this model we have to simulate 3 test cases from Harness dashboard for finding the fault condition in BMS.
The following figure shows the Harness Dashboard
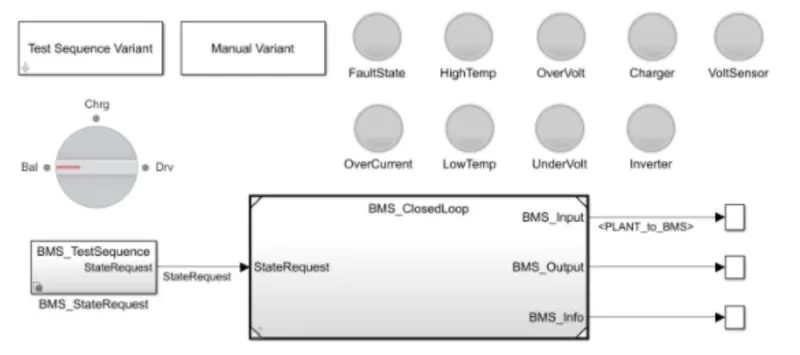
Indicators are used to indicate any abnormality, i.e different faults are indicated as indicators - Hightemp, Lowtemp, Overcurrent, etc. When any of these failure occur then the indicator will be in red color to show the danger, otherwise all indicators will be green color so the system is safe. Battery charging mode, balancing mode, discharging mode all can be indicated according to the operation.
From the Test Sequence Variant block, we can implement the different test conditions.
Test case:1 - Charging-Balancing-Discharging/ BMS level test condition for driving and charging:
Select the test case as '1'
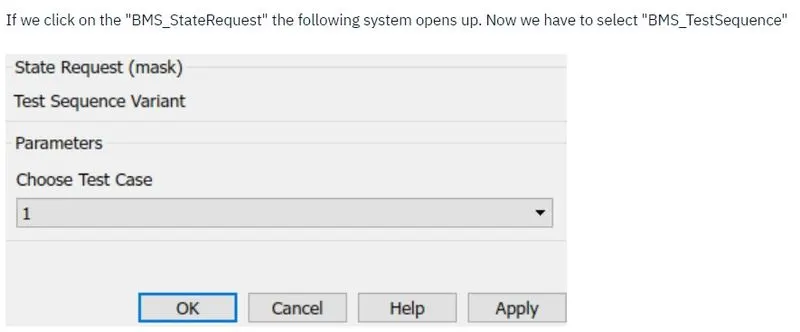
Following shows the test sequences
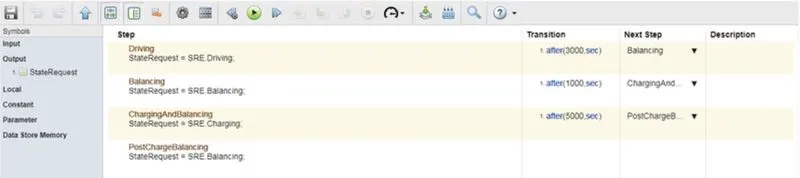
When we simulate the model for test case1, then the model will be as follows:
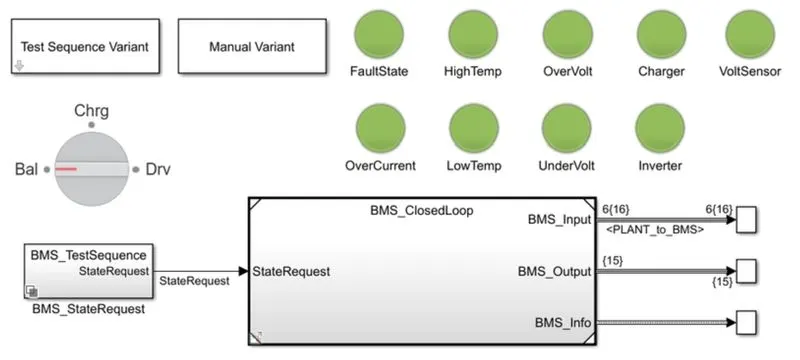
Here no fault occured, so all indicators are in green color. And the system is safe. The output plots are as below:
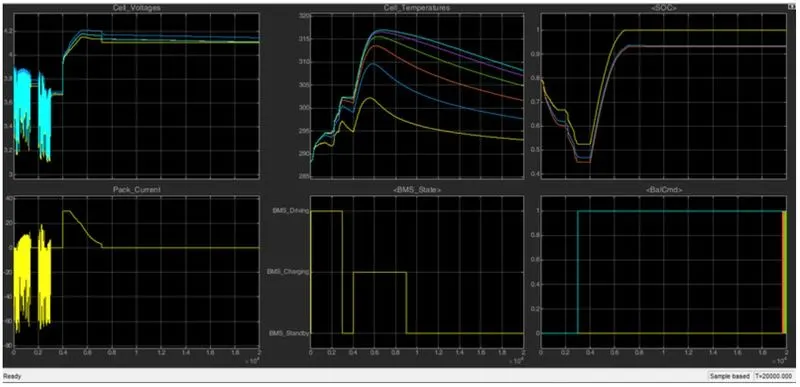
i. Discharging mode from 0 sec to 0.4 sec:
- Cell voltages varies from 4.2V to 3.2V as cells are discharging
- Current is also around 0.
- SOC is 80% at starting and it is gradually reduced to 30%
- Cell temperatures are increased from 280k to 300k
- During discharging, cell balance is 0
ii. Charging mode from 0.4 sec to 0.9 sec:
- When cell voltage reaches 4.2V, then it became constant which is constant voltage(CV) method.
- Current reaches to around 30A in constant current(CC) method, when cells reached 80% SOC then constant voltage (CV) method came into picture, so current slowly reduces in CV method
- SOC reached from 30%(initially) to 100%
- Temperature reaches from 290k to 320k, after cells are fully charged then the temperature reduced gradually.
- Cell balancing is done where all cells gave their maximum output.
iii. SOC:
SOC is estimated using different methods:
a. Coulomb counting:
- Yellow line represents coulomb counting, where SOC reached to 100% within a span of 0.7sec
b. UKF Kalman filter:
- Red line represents UKF kalman filter where SOC is around 94% within a span of 0.7sec
c. EKF Kalman filter:
- Green line represents EKF kalman filter, where SOC is around 94% in 0.7sec time.
Test case - 2 - Discharging and no Balancing/At BMS level test condition for driving
Select the test case as 2:
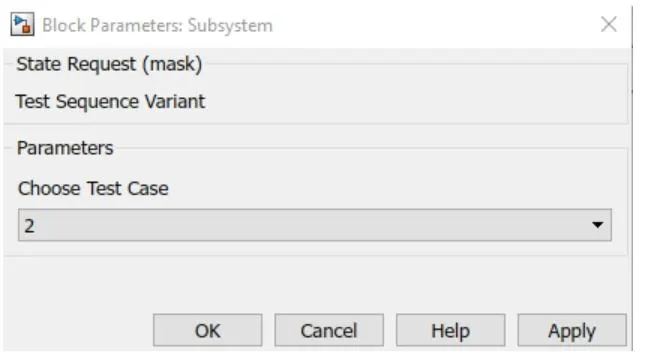
The test variant sequence conditions are as below, in this only driving is set.

The model after simulation is as below:
In this case also, there are no faults and the system is safe
The output plot is as below:
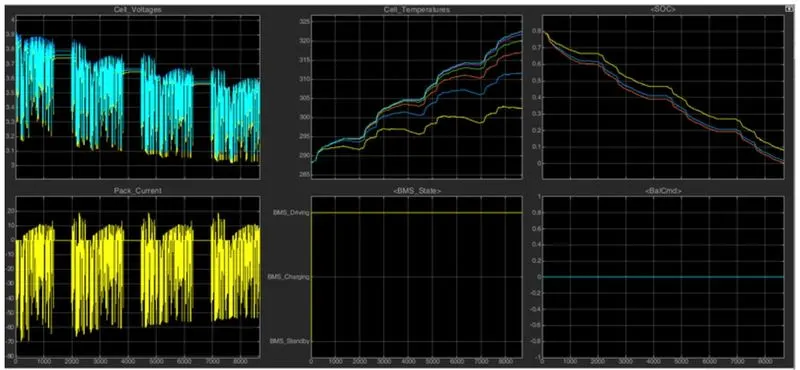
i. Discharging mode from 0 to end of simulation:
- Cell voltage is around 3.9V and later it reduced to 3.2V
- Current is 0
- SOC also reduced to 0% from 80%
- Temperature raised from 280k to 320k
- As battery is discharging, cell balancing is 0
Test case -3: Balancing and Charging/BMS level condition for charging:
Change the test case as 3
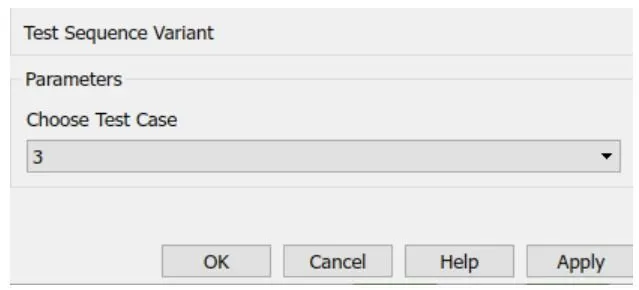
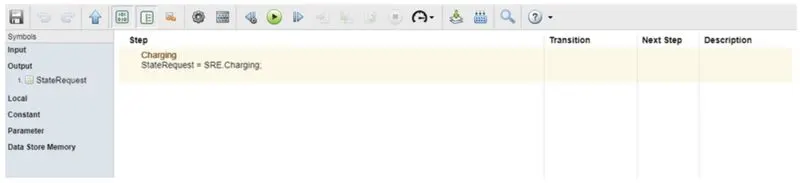
The model is
There is no fault condition in this
The output plot is
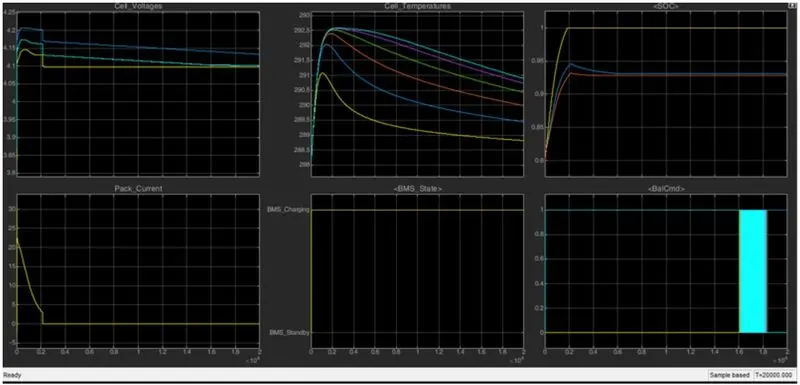
- As only charging mode is there, we can see CC and CV modes
- In CC(constant current) mode, current rises to 30A and then slowly decreases, CC mode is from 0 to 0.2 sec.
- In CV(constant voltage) mode, voltage maintains at 4.2V, right from 0.2sec it started.
- Temperature changes from 292k to 288k
- As batteries are charging, the balancing is always 1
- For coulomb counting(yellow) the SOC is 100% at 0.2sec
- For UKF Kalman filter(blue) the SOC is 94% at 0.2sec
- For EKF Kalman filter(red) the SOC is 93% at 0.2sec.
2. To explain about coulomb counting and refer the model to explain how BMS implements coulomb counting for SOC estimation.
Ans.)
The most important function of the BMS is to provide an estimate of the SoC. In vehicle applications, SoC acts as a constraint on how the energy management system optimizes the overall performance in terms of fuel economy and drivability. Knowing the SoC is very important in determining the best operating strategy of the vehicle.
Estimating the SoC is a difficult problem. The mathematical definition tells us that the SoC is the ratio of available ampere-hour (Ah) in the battery to the total Ah available when the battery is fully charged (namely, the capacity). By this definition, the SoC can be calculated from the current through the cell via current integration.
Coulomb counting:
Coulomb counting is a technique used to track the State of Charge of a battery pack. It works by integrating the active flowing current (measured in amps) over time to derive the total sum of energy entering or leaving the battery pack. This produces a capacity that is typically measured in Amp-hours.
The coulomb counting method, also known as ampere hour counting and current integration, is the most common technique for calculating the SOC. This method employs battery current readings mathematically integrated over the usage period to calculate SOC values given by
The Coulomb counting method measures the discharging current of a battery and integrates the discharging current over time in order to estimate SOC. Coulomb counting method is done to estimate the SOC(t) , which is estimated from the discharging current I(t) , and previously estimated SOC values, SOC(t-1). SOC is calculated by the following equation:

The Coulomb counting method is one of the most general and simple methods of estimating the SOC. We use it for a baseline comparison for more advanced methods. The Coulomb counting method measures the current of the battery and integrates the current over time to estimate SOC. Limitations of the method, which lead to other projects along these lines, include the fact that inaccurate current measurements accumulate to large errors, whereas accurate current measurement is expensive. Other factors such as temperature, battery history, initial SOC and cycle life also influence the precision of the SOC estimate. Practically speaking, some phenomena, such as decreasing SOC when the battery is resting, and variations with temperature changes, cannot be captured by the Coulomb counting method.
From the model https://in.mathworks.com/matlabcentral/fileexchange/72865-design-and-test-lithium-ion-battery-management-algorithms,
the SOC estimation block is as follows:
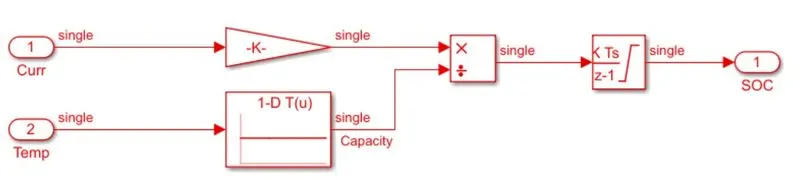
In this block, it accepts two input signals- Current and Temperature, with the current signal going to the gain block and the temperature signal goes to battery time and current lookup tables. Both blocks are linked to the split block, and these signals are sent to the discrete-time integrator to track the charge, which then aids in the calculation of the state of charge.
This method merits are its simplicity and cheap capital cost, while demerits include a buildup of current sensor error and its inability to recover from the erroneous start condition, due to lack of voltage measurement feedback.
CONCLUSION:
State of charge estimation process is explained from the given matlab model and 3 test cases are simulated in the harness board.