Week 7 State of charge estimation
Problem statement:
1.Simulate the 3 test cases from the harness dashboard and write a detailed report on the results of the simulink file: https://in.mathworks.com/matlabcentral/fileexchange/72865-design-and-test-lithium-ion-battery-management-algorithms
2.What is coulomb counting? Refer to the above model and explain how BMS implements coulomb counting for SOC estimation?
Solution:
Theory:
Battery management system:
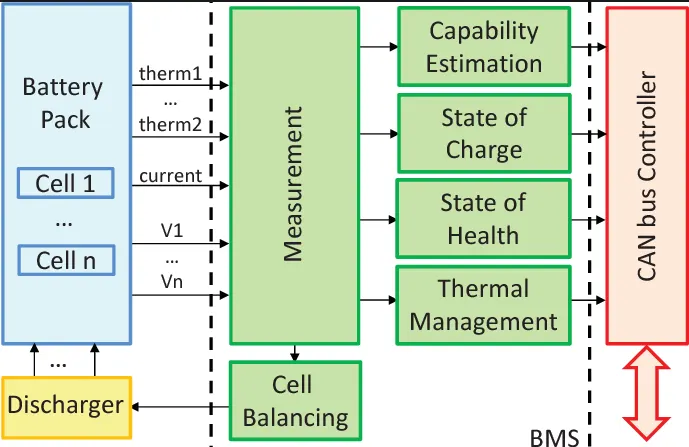
Battery Management System is an electronic device that manages the battery pack for safe and efficient operation. BMS collects parametric data of the overall battery and individual cells and processes this data to generate control signals that ensure safety of the battery is intact and the performance of the battery is efficient.
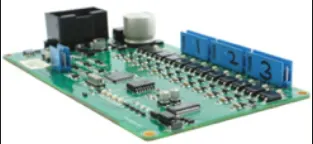
The image shows a BMS; it is an embedded system with various electronic devices on circuit board; It has custom-built electronics and custom-built software for a specific purpose.
Various functions of BMS:
- Safety:
- BMS continuously monitors the voltage, current and temperature of the battery pack and individual cells
- BMS is responsible for the thermal management of the battery. If the temperature is sensed to breach the limits, BMS triggers battery cooling and safety mechanisms.
- Overcharging the battery can lead to thermal runaway and explosion, hence BMS continuously monitors all the voltages and controls the charge rate and discharge rate accordingly while limiting the maximum current flow in and out of the battery
- BMS checks if the vehicle chassis is isolated from the high voltage battery pack all the time for the safety of the passengers.
- Performance:
- For optimal performance, the battery pack needs to be operated in a limited state of charge range specified by the battery manufacturer. If the battery is operated above and below the SOC limits, it results in battery capacity and battery life reduction. Hence, BMS need to calculate the SOC with available voltage data of the battery and cells.
- BMS does not let the battery be charged above the maximum SOC by communicating with Electric Vehicle Supply Equipment/Charger and controlling the current inflow to the battery
- BMS does not let the battery be discharged below the maximum depth of discharge by communicating with the motor controller and controlling the current outflow from the battery
- BMS also controls the charge rate and charge limit from regenerative braking
- Individual cells can develop voltage differences. This amplifies over charge-discharge cycles and causes battery capacity underutilization. Hence, BMS monitors cell voltages and relative capacity imbalance. BMS then activates cell balancing mechanism.
- Health monitoring and diagnostics:
- BMS collects various parametric data from the battery and calculates the state of health of the battery. It indicates the available capacity of the battery compared to the original capacity. SOH helps to determine the suitability of battery for continued application
- BMS stores error codes and logs diagnostic information; trigger failsafe operation when needed.
- Communication:
- BMS communicates with other Electronic Control Units in the vehicle such as an onboard charger for AC charging and motor controller.
- In the case of DC charging, BMS directly communicates with the charger. BMS sends the required output voltage and current levels to charger and instructs when to start and stop the charging.
Simulink BMS model:
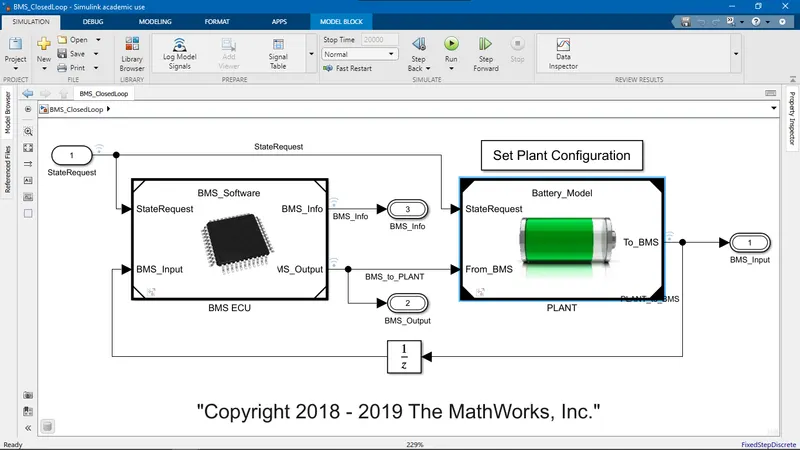
The model is a battery control system. BMS ECU (Battery Management System Electronic Control Unit) is the controller and Battery Pack with Charger/Load is the plant. The battery pack output is feedback to the controller and the control signals are set to the plant.
The Plant subsystem:
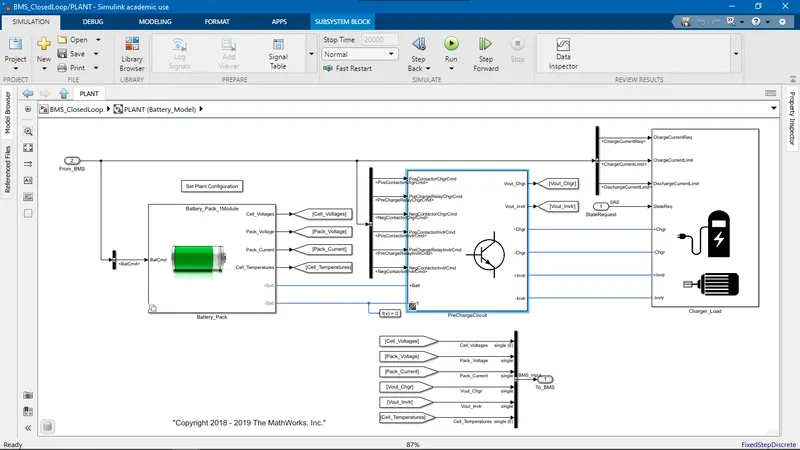
The Precharge circuit is interfaced between the battery pack and charger/load. The battery pack is at a higher voltage compared to the charger/load, so when both the components are directly connected by the main connector, due to a very high potential difference there would be a high current inrush in the transient phase which gets tapered down as the potential on both sides equalize. This high transient current can cause a meltdown at contactors and cause the contactors to be permanently welded. This scenario is prevented by a parallel Precharge circuit.
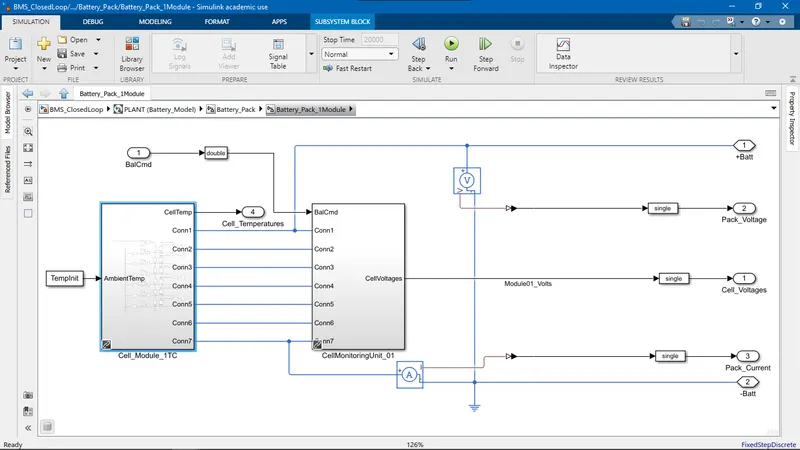
This shows the battery pack subsystem. The cell module subsystem consists of the cells. The Cell Monitoring Unit measures the individual cell voltages. The voltage sensor and current senors in this subsystem measure the battery pack voltage and pack current.
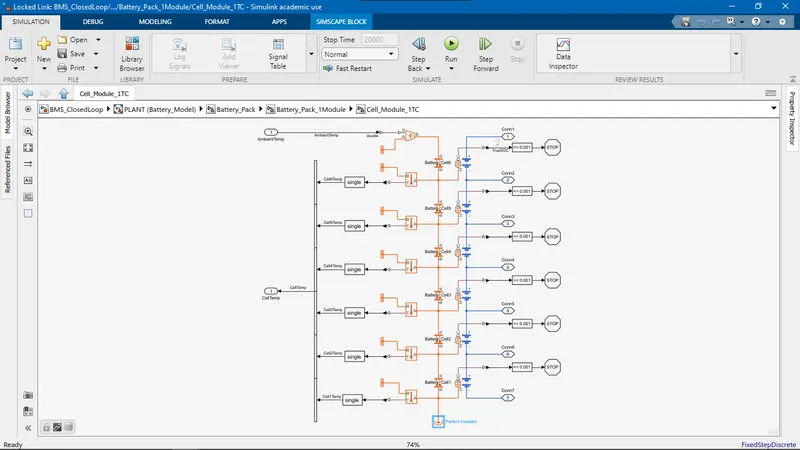
This shows the Battery Pack module. The cells are connected in series. SOC and thermal port of the battery block is enabled. If the SOC of any cell drops below 0.01 % then the simulation stops. The thermal source taking input from Ambient temperature supplies heat to the battery cells.
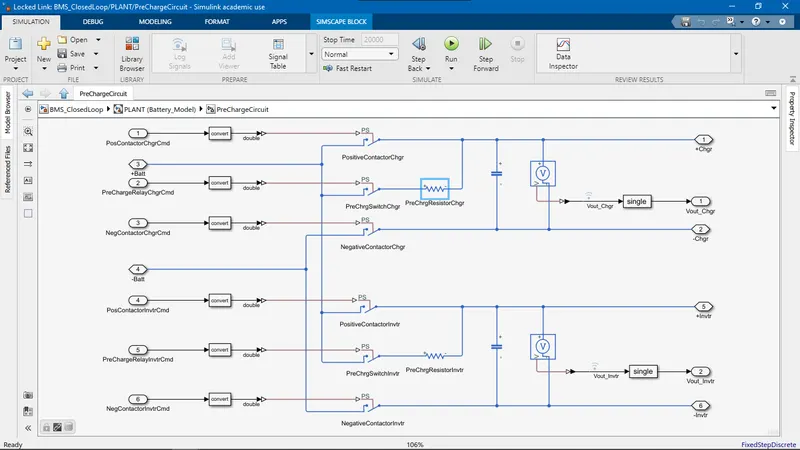
This shows the Precharge circuit subsystem. The battery terminals are connected to charger and load terminals. The filter capacitor is provided between the battery and charger/load. The Precharge circuit consists of a switch and resistor that control the current flow on either side. The precharge circuit allows a small current flow to the load side. This enables the load side to match the voltage level of battery pack and prevents high current flow when the main contactors are turned on.
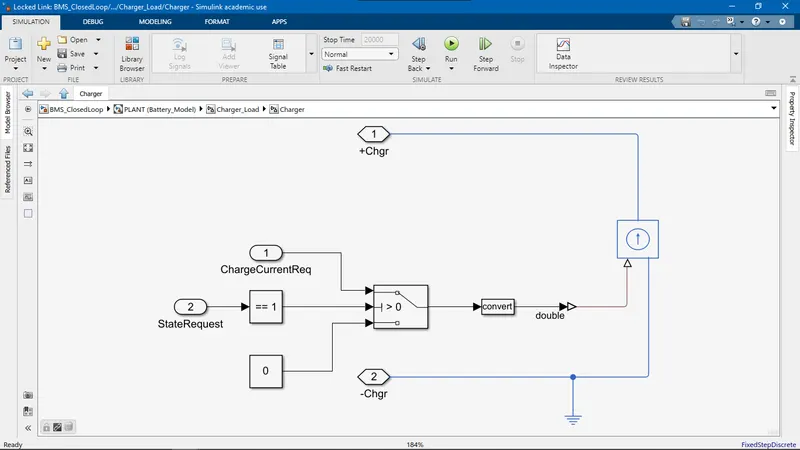
This shows the charger subsystem. It consists of a Controlled Current Source that supplies current to the battery pack and takes input from BMS ECU.
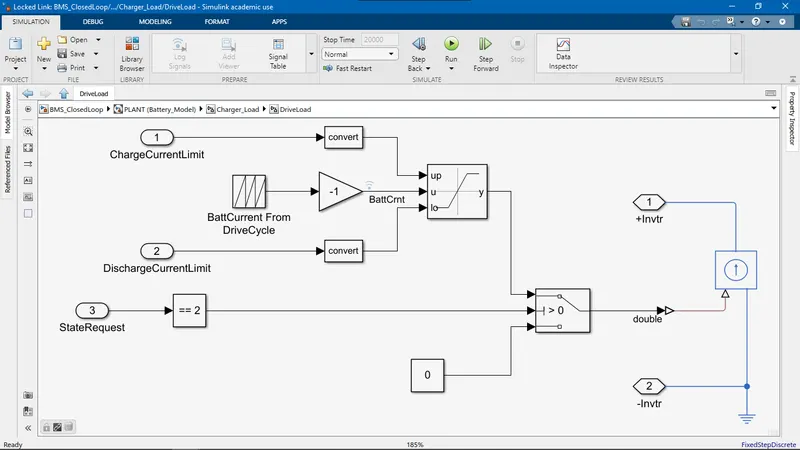
This shows Driver Load subsystem. This subsystem discharges the battery using a Controlled Current Source. The charge and discharge current limit from the BMS is used to set upper and lower limit of discharge current defined by Drive Cycle.
BMS ECU subsystem:
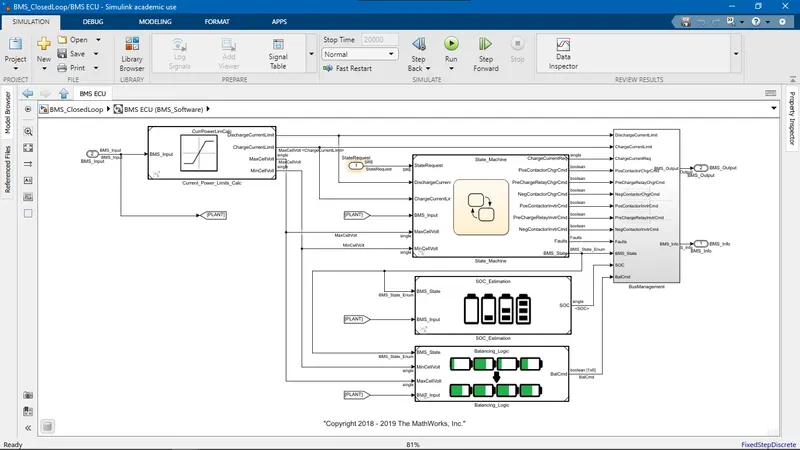
This shows the BMS ECU subsystem. The different subsystems perform different functions as follows:
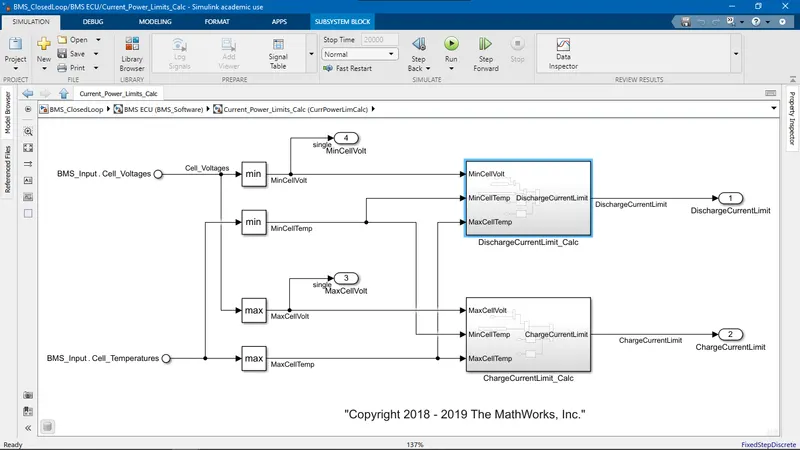
The first subsystem calculates the current limits. It takes cell voltages and cell temperatures as input. The minimum and maximum cell voltage and temperature are determined using min-max block.
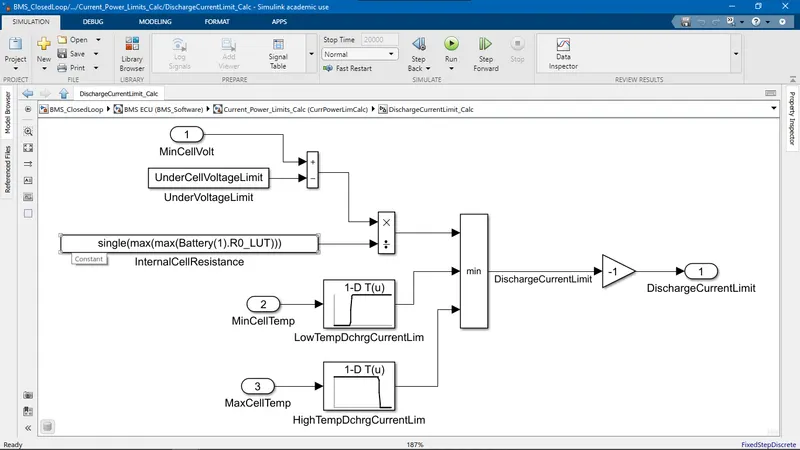
This shows the Discharge current limit calculation block. Minimum cell voltage and max cell temperature is taken as input. The under cell voltage limit is predefined from manufacturer cell specification. While discharging, the cut-off voltage is of importance. The difference between the minimum cell voltage and cut-off voltage is calculated and based on which current limit is determined using V/R equation. This calculated current is such that it prevents the cell from discharging below the safe depth of discharge. This discharge current limit is passed to the load and the battery is discharged accordingly.
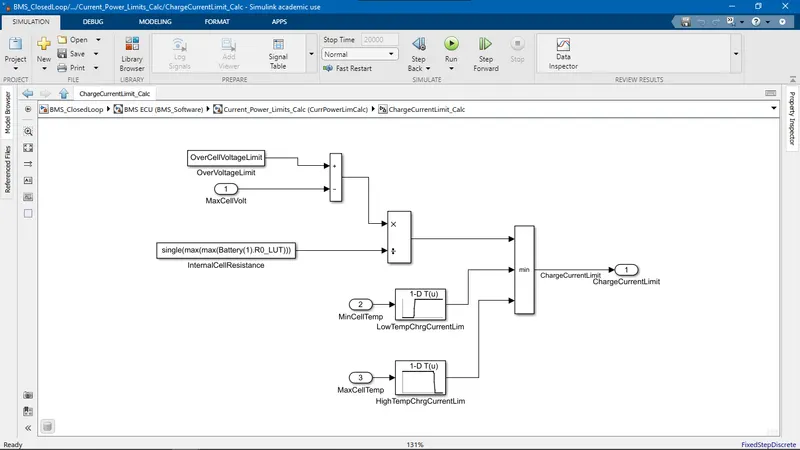
The charge current limit calculation block works the same way but considers maximum cell voltage from the manufacturer's specifications and tapers down the current so that the charge current is not sufficient enough to charge the battery beyond the maximum cell voltage.
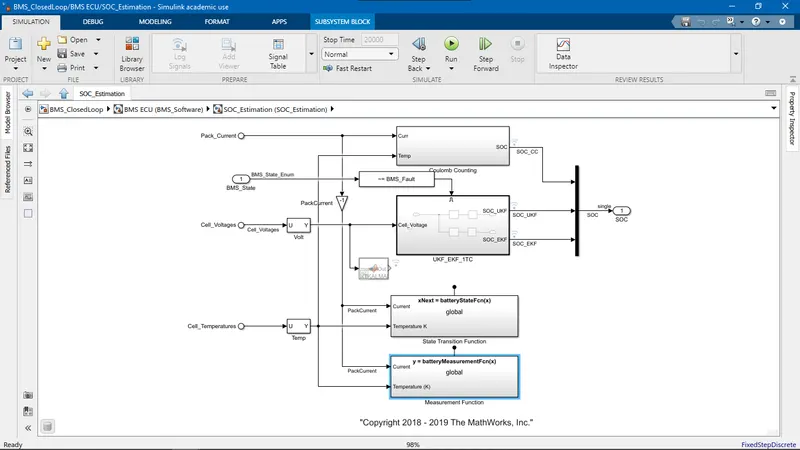
This shows the SOC calculation block. The techniques such as the coulomb counting method and the Kalman Filter method are used to calculate battery SOC.
1. Simulating test cases from Harness Board and reporting the results:
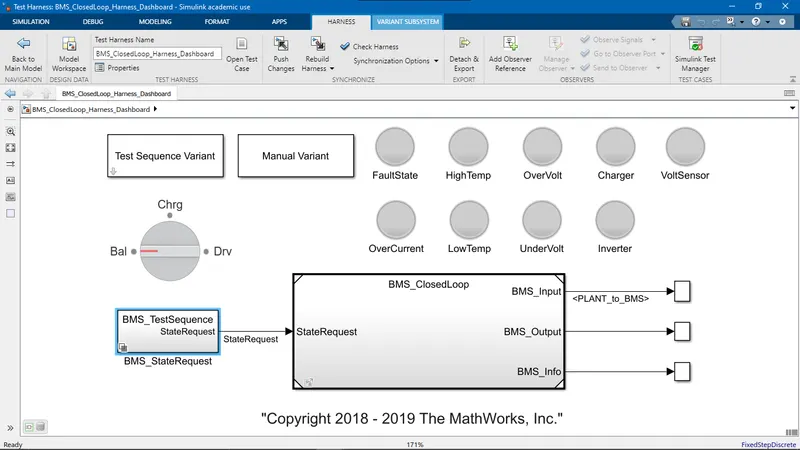
The image shows the Harness Board. The simulation can be set on this board and the BMS response is verified. It has mainly two simulation variants:
- Test sequence variant: Predefined simulation conditions in which Charging, Driving and Balancing situations are sequentially ordered for a defined period. There are 3 test sequences which are unique combinations of charging, driving and balancing.
- Manual variant: The simulation conditions can be customized while running the system by switching the knob between balancing, charging and driving.
Test 1:
Initially, the Test Sequence Variant is selected and the following pop-up window appears:
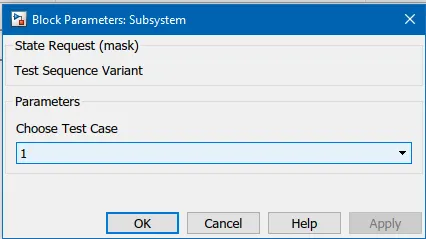
In this case, test-1 is selected and applied. Then double-click on the BMS_StateRequest, then the following subsystem opens up.
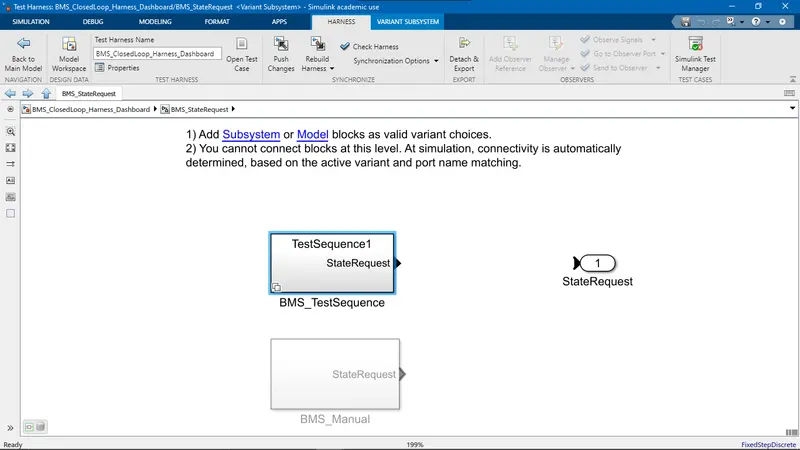
Double-click on the BMS_TestSequence and then the following subsystem opens up.
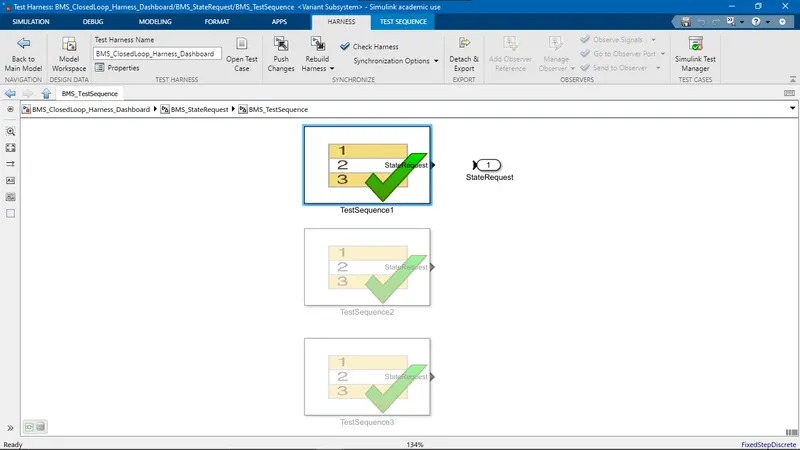
This confirms that Test sequence 1 is selected. Double-clicking on it reveals the following.
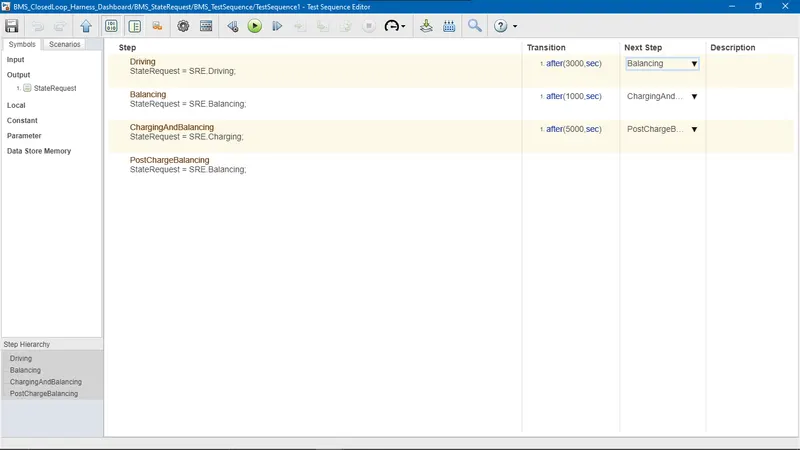
In this test sequence variant, the following conditions are sequentially ordered:
- Driving state: The vehicle is simulated to drive for 3000 seconds. During this period, the battery is discharged according to the pre-set vehicle energy and power requirements.
- Balancing state: For the next 1000 seconds, the battery is in standby mode. During this period, the BMS is activated to balance the cells.
- Charging and balancing state: For the next 5000 seconds, the battery is charged and also balanced by BMS.
- Balancing state: For the rest of the time, the battery is at rest but BMS is actively balancing the cells.
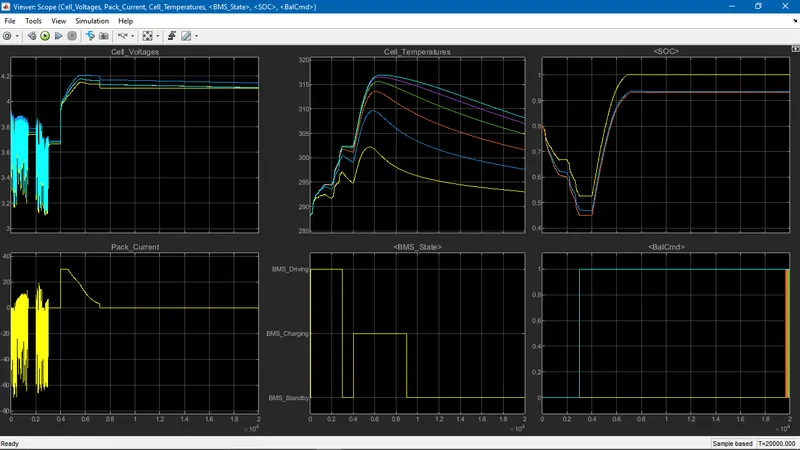
The plot shows the simulation result as follows:
- Driving for the first 3000 seconds:
- The BMS state plot shows that the BMS is in driving state
- Cell voltages vary according to the current drawn from the load shown in the pack current plot.
- Cell temperature plot shows that the cell temperature, initially at 288 K rise to higher temperature as the battery gets discharged. Since cell 6 is the first cell to be exposed to the ambient heat and cell 1 (yellow line) is the last cell exposed to convective heat transfer, cells sequentially react to convective heat transfer from cell 6 to cell 1. Hence, cell 6 experiences more rapid heating and cell 1 experiences slow heating.
- During this driving process, the battery SOC drops down from 80 %. As the discharge progresses, the charge imbalance between the cells expands and different cells end up having different capacities at the end of driving phase. The effect of temperature can be seen on the cells. The cells at higher temperatures are at lower SOC levels and cells with lower temperatures have higher SOC levels.
- Balancing for next 1000 seconds as shown by BMS state plot
- During this time, the pack current is 0 and cell voltages are constant at 3.7 V.
- The cells' temperatures slightly reduce
- SOC remains the same, no activity
- BMS state plot shows, charging from 4000 seconds to 9000 seconds.
- The cells attain a peak voltage of 4.2 V at 5000 seconds up to which constant pack current of 30 A is supplied (Constant-Current Charging). After the overvoltage condition is encountered while maintaining constant maximum voltage the pack current is seen to taper down exponentially and drop to 0 (Constant voltage charging).
- The cells' temperatures rise differently. Cell 6 attains 317 K while cell 1 attains 303 K.
- Since cell 1 had a higher charge level, its SOC rises to 100 % faster than other cells. While other cells attain 93 % SOC. After cell 1 is completely charged at 7000 seconds, charging of the battery stops.
- BMS state plot shows that the battery is in standby mode for the rest of the time
- The pack current is 0 and cell voltages are constant
- Cell SOC has no activity
- The cells start cooling off at the same rate
Test 2:
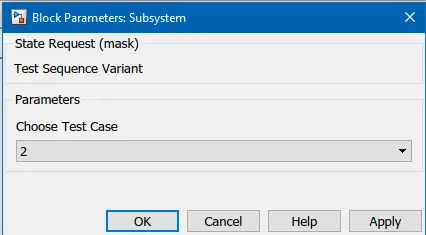
Double-click over the Test sequence variant block and choose test 2.
The Test sequence editor shows the simulation steps:
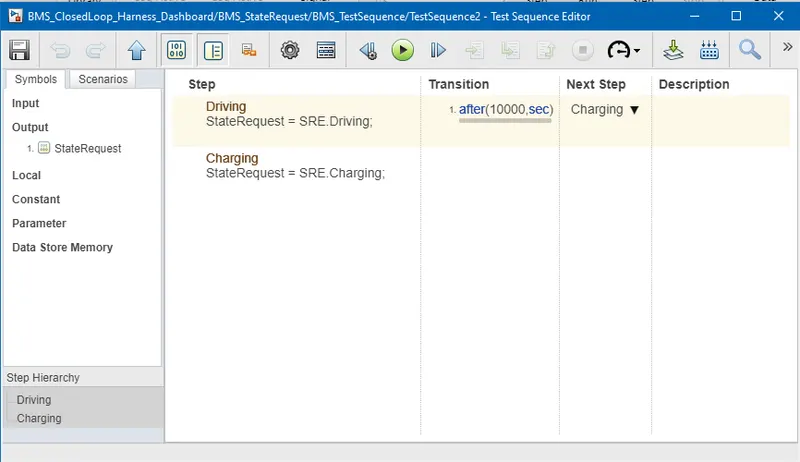
- Driving state: For the first 10000 seconds, the battery is discharged since the vehicle is simulated to be driven.
- Charging state: For the rest of the time of simulation, the battery is charged
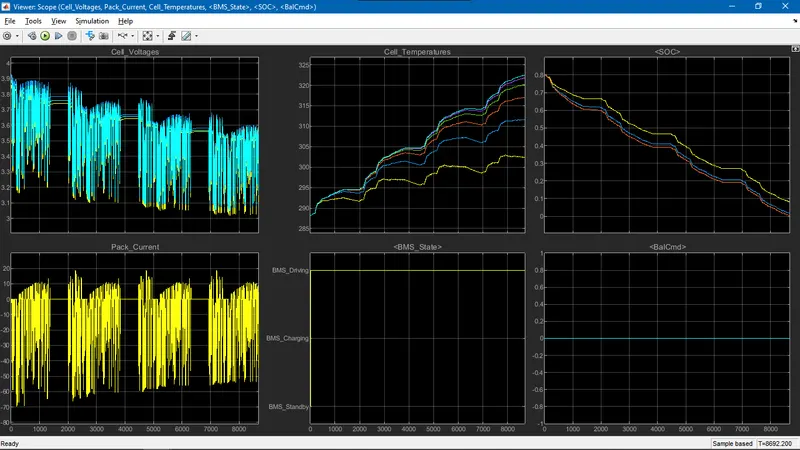
This scope window shows the result of test 2:
- The simulation runs for only 8692 seconds. It can be seen in the SOC plot that few cells hit 100 % depth of discharge before the driving period gets over. Hence the simulation stops.
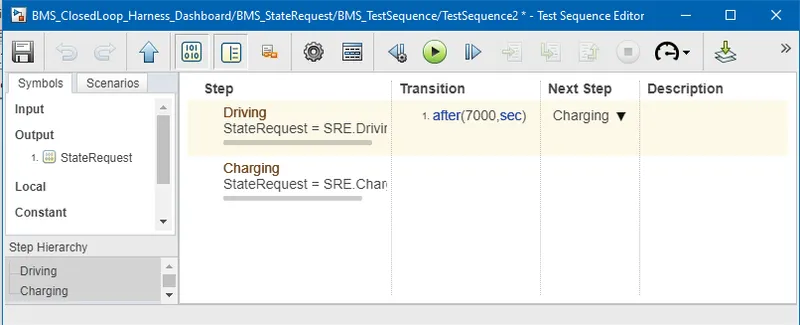
In the test sequence editor window, the driving state period is changed to 7000 seconds since the battery capacity does not permit a drive period of 10000 seconds.
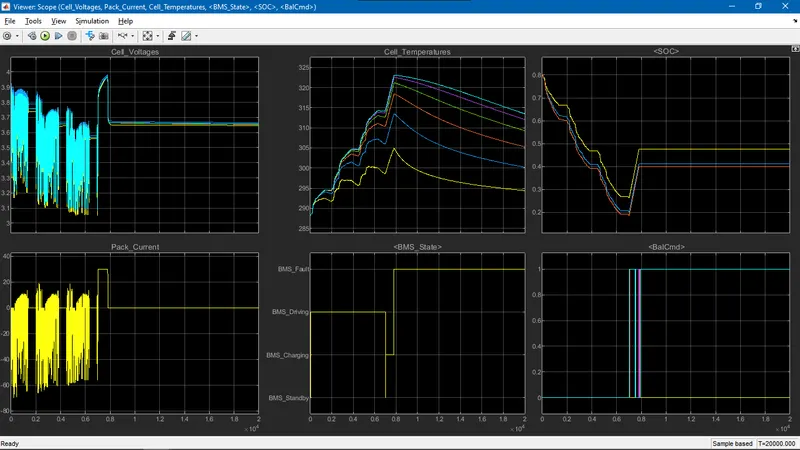
The result of the modified test sequence is shown above
- BMS state plot confirms driving state for 7000 seconds
- During this period, cell 6 attains a temperature of 315 K and cell 1 attains 300 K from initial temperature of 288 K
- The SOC of the cells drops from 80 % to a range of 20-25%.
- BMS state plot shows charging state from 7000 to around 8000 seconds
- The SOC of the cells rises to a range of 40-50%. It is clear that the battery stops charging before the overvoltage condition is attained.
- The temperature of cell 6 rises to 323 K while cell 1 temperature rises to 305 K.
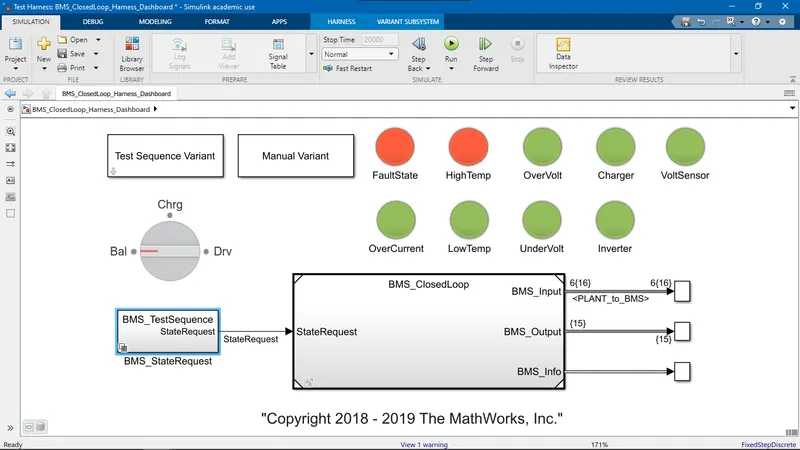
The Harness Board clarifies why charging stopped abruptly. The indicator: Fault state is on; It signifies that the BMS encountered a fault condition and had to put the battery in standby mode for safety concerns. The High-Temperature indicator is also on, this shows that cell 6 in the battery attained maximum permissible temperature. And the charging was stopped to prevent thermal runaway and let the battery cool off.
Test 3:
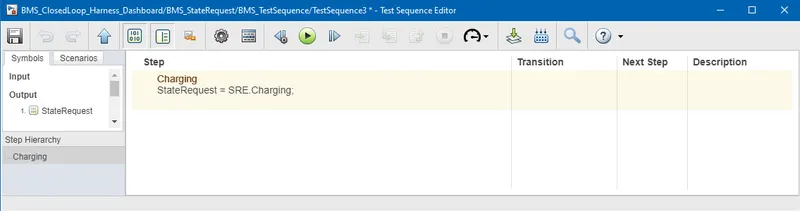
This shows that charging is the only STEP in test 3.
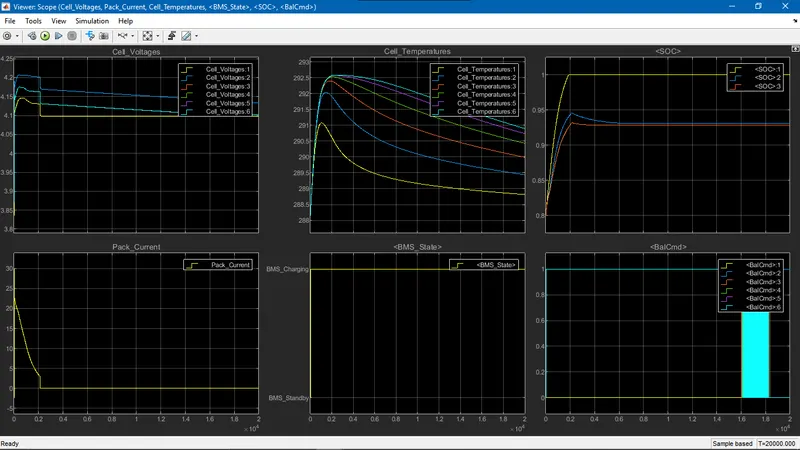
The result shows that:
- Initially, the charge current rises to 30 A. Since the battery is already at 80 % charge level, it cannot be charged with constant current. Hence the charge current shifts to constant volt charging by tapering down the current.
- The battery is fully charged in 2000 seconds since cell 1 is fully charged and encounters an overvoltage condition.
Coulomb Counting method:
It is a method to determine the state of charge of the battery.

In this method, the battery pack current is measured and integrated over time. This integrated current is then divided by the full battery capacity to get the state of charge of the battery. But the battery capacity is not always constant. It is maximum when the battery is new and it reduces over time.
The inaccurate current measurements accumulate to form large errors. The initial SOC, battery state of health, temperature and battery history affect the accuracy of this method.
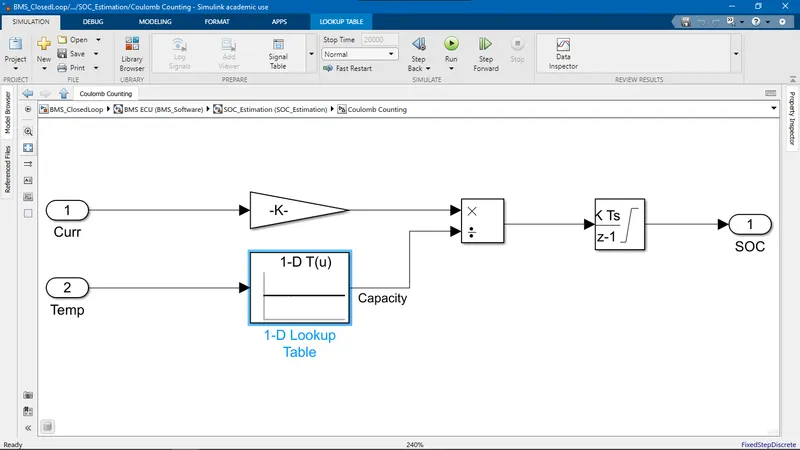
The image shows how the Coulomb counting method is implemented in the model.
- The battery current and temperature is taken as input
- The current is passed through Gain block where it is divided by 3600 seconds to convert the time into hours
- The temperature signal is passed through look-up table which keeps the track of battery capacity at different temperatures and this gives battery capacity at given temperature as output.
- The current signal is then divided by capacity
- This data signal is integrated over time to obtain SOC.