Week 7 - CHT Analysis on a Graphics card
AIM
To perform Conjugate Heat Transfer analysis on a Graphics Card.
OBJECTIVES
- Run the simulation by varying the velocity from 1m/sec to 5m/sec for at least 3 velocities.
- Find out the maximum temperature and heat transfer coefficient attained by the processor.
- Identify potential hotspots on the model.
THEORY
Conjugate heat transfer (CHT) corresponds with the combination of heat transfer in solids and heat transfer in fluids. In solids, conduction often dominates whereas in fluids, convection usually dominates. CHT analysis allows for the simulation of heat transfer between solid and fluid domains by exchanging thermal energy at the interfaces between them. CHT analysis can accurately predict heat transfer by simultaneously solving all the relevant solid and flow field heat transfer processes. It has benefits for those applications where heat transfer is either non-uniform or difficult to calculate empirically. Typical applications of this analysis type are, simulation of heat exchangers, cooling of electronic equipment, industrial machinery, powerplant exhaust systems, etc.
GEOMETRY
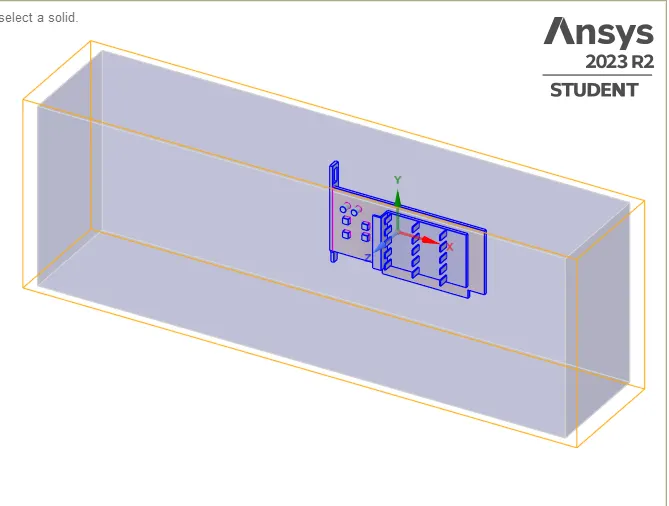
The geometrical model of graphics card with enclosure was imported and shared topology was created in ANSYS SpaceClaim.
BASE MESH
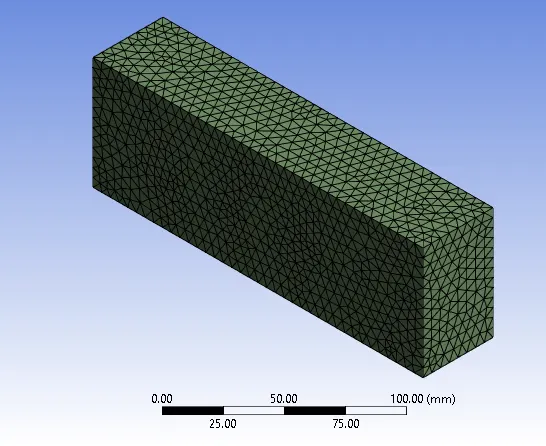
Enclosure
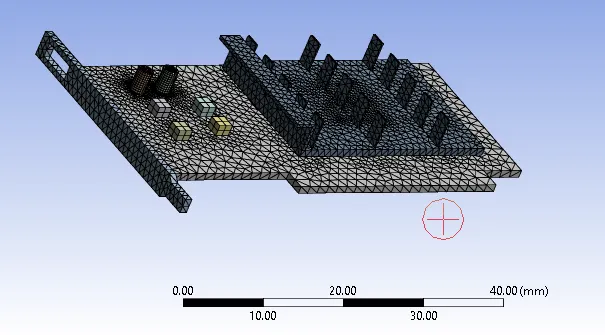
Graphics card
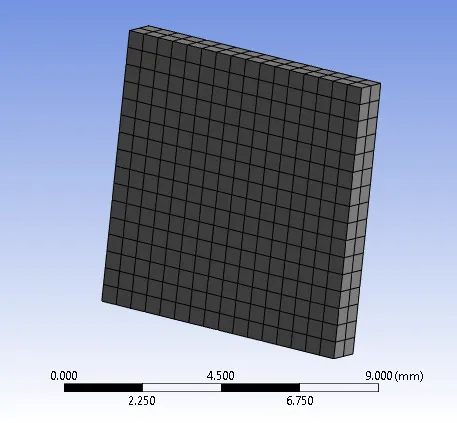
Graphics card Processor
without the fins of graphics card
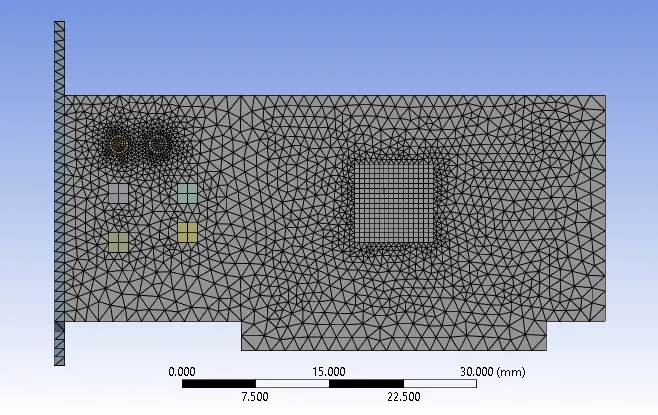
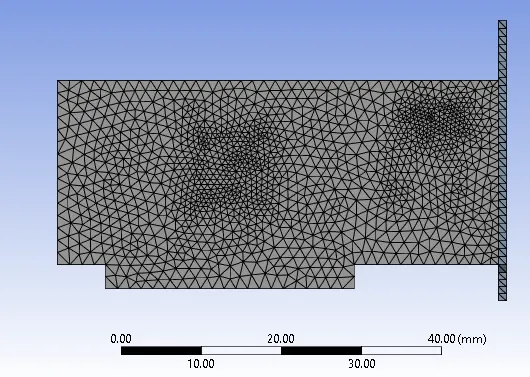
backside of graphics card base
sectional view of domain shows conformed mesh generation
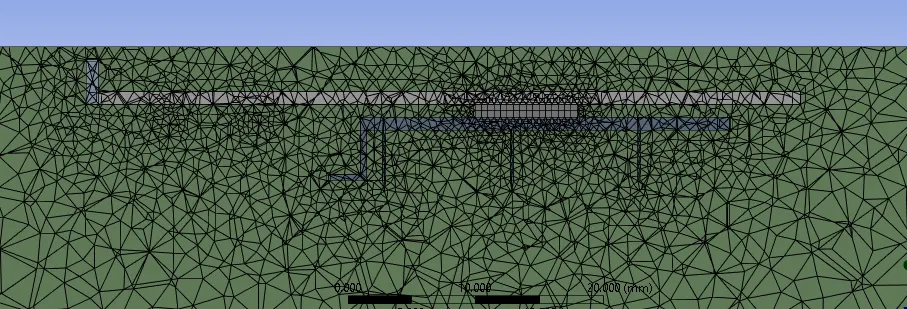
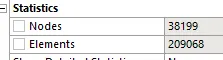
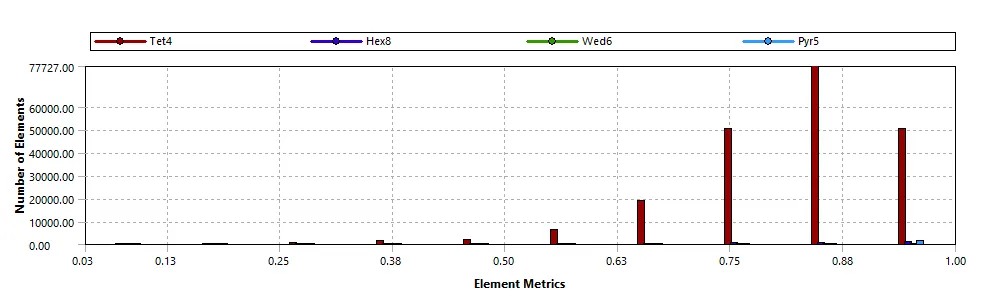
Different body sizings applied and named selections created can be seen below. In the base mesh, the domain is discretized into 209068 mesh elements. The element quality of the mesh is acceptable.
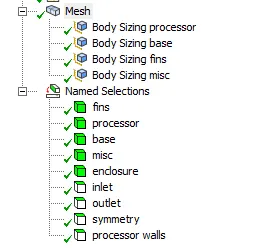
Enlisted below are body sizings provided to the different components
Mesh Element size: 5 mm
Body sizing processor: 0.5 mm
Body sizing base: 1.5 mm
Body sizing fins: 1 mm
Body sizing misc: 1 mm
SOLVER SETUP
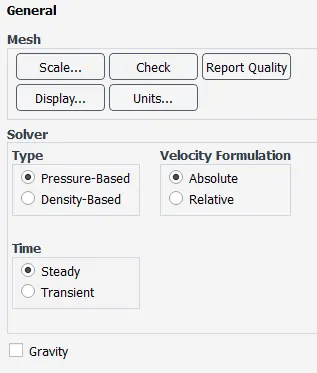
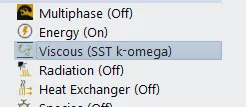
A pressure-based steady state solver with K-omega SST turbulence model was implemented to simulate the problem.
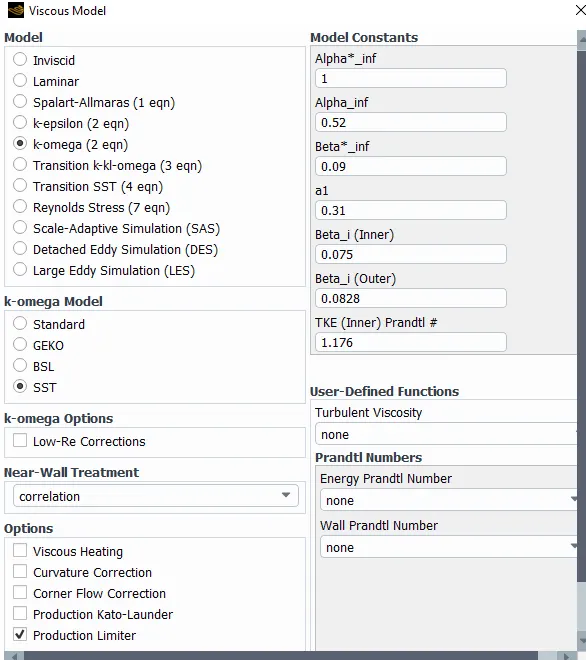
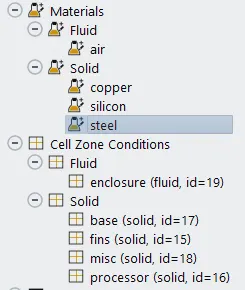
Following are the materials and their properties used for each component of Graphics card and enclosure volume.
- Graphics card base- Steel (properties assigned in ANSYS Fluent database)
- Graphics card processor- Silicon
- Density = 2329 Kg/m3
- Specific heat capacity = 700 J/Kg-K
- Thermal conductivity = 148 W/m-K
- Graphics card fins- copper (properties assigned in ANSYS Fluent database)
- Graphics card miscellaneous electronic components- Steel (properties assigned in ANSYS Fluent database)
- Enclosure volume- air (properties assigned in ANSYS Fluent database)
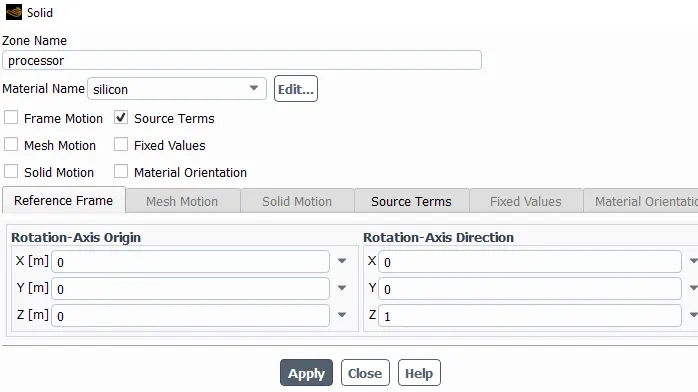
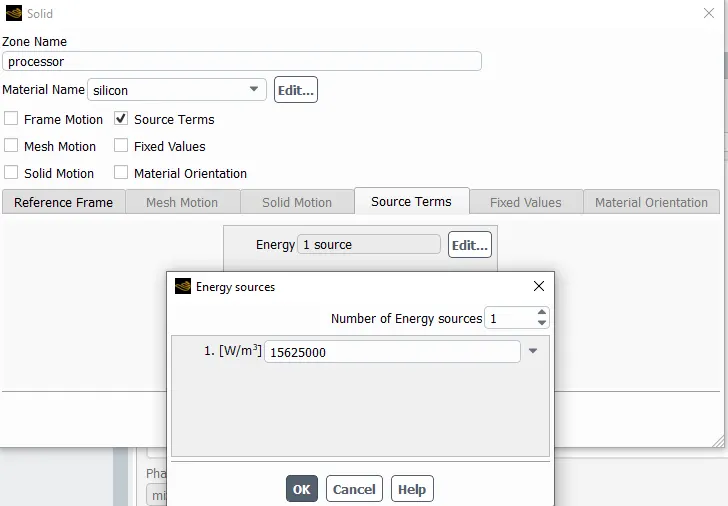
To imitate the heat generation of graphics card processor, a source term for energy source = 15625000 W/m3 was created. Below provided are snapshots of the same.
Inlet velocity was given as 1 m/s initially and later varied for other simulation data. Pressure outlet was ensured and all walls were given coupled boundary condition.
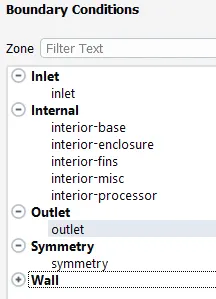
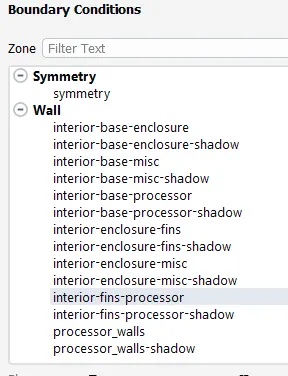
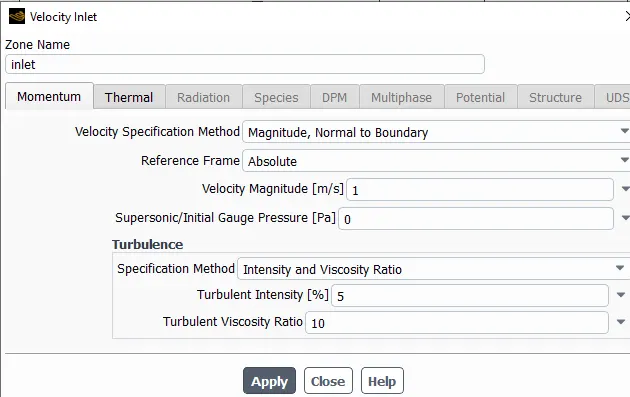
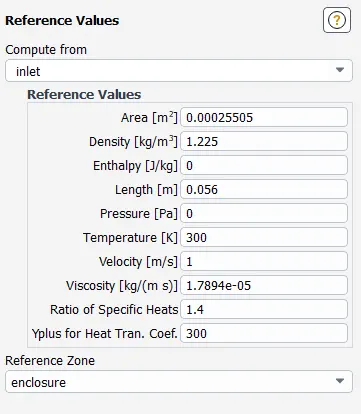
Reference values were modified as follows. Projected area along x-axis was calculated in fluent. Length was measued from SpaceClaim.
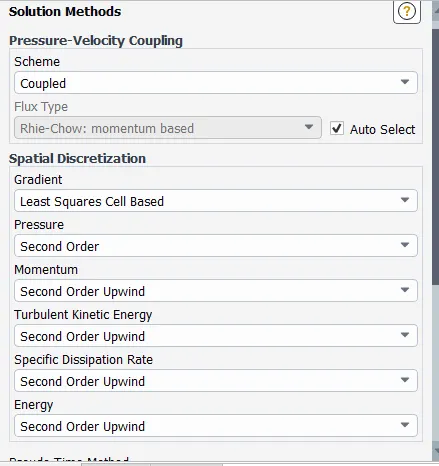
Coupled solution method was used. The whole setup was initialised hybridly and run for 400 iterations initially.
RESULTS using BASE MESH
For 1m/s inlet velocity
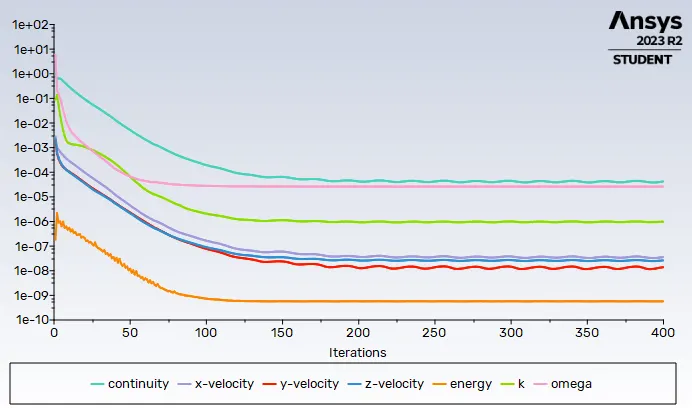
Scaled residuals
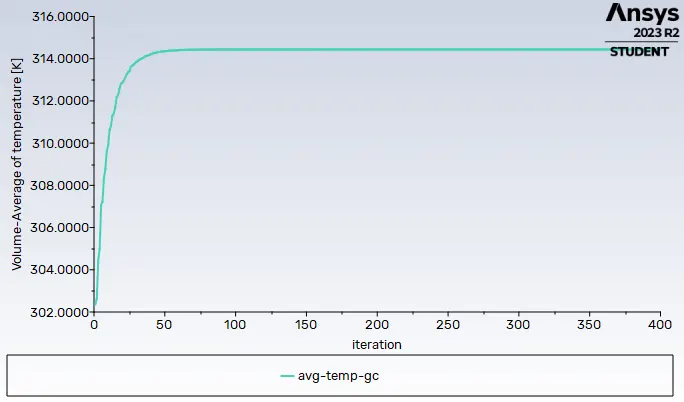
Average temperature of Graphics Card
Average wall HTC of Graphics Card
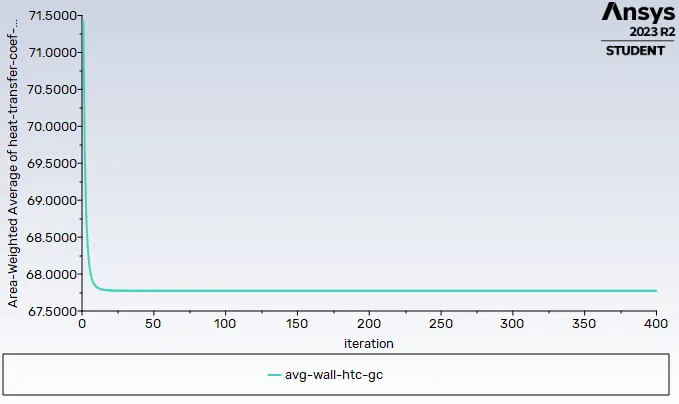
The above graphs along with scaled residuals show that convergence has been achieved.
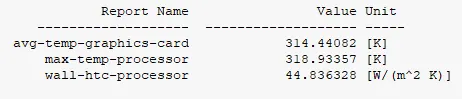
The average temperature attained by the graphics card, maximum temperature attained by the graphics card processor, and wall heat transfer coefficient (HTC) achieved by the graphics card processor are computed from report definitions and enlisted below.
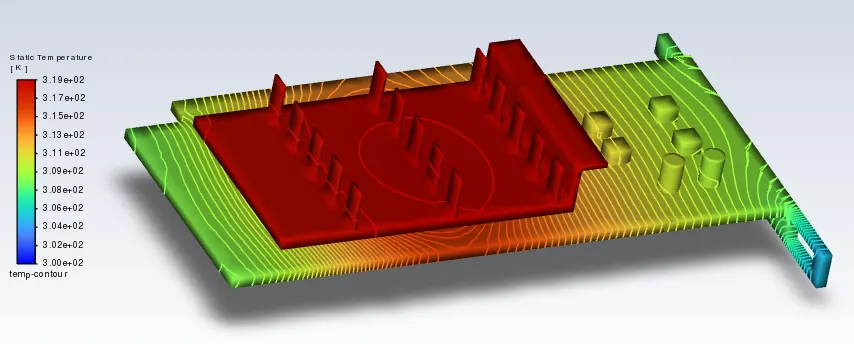
temperature contours of the graphics card
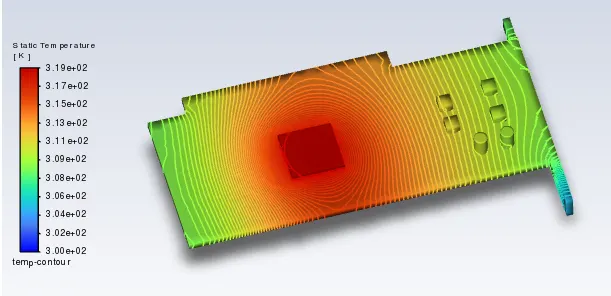
without fins
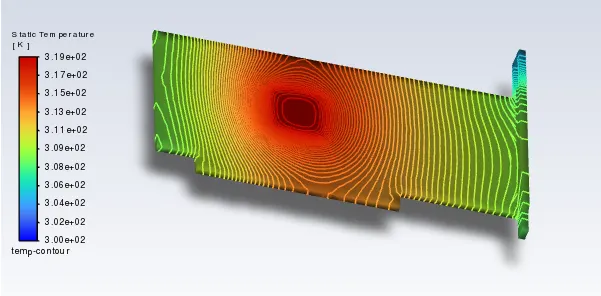
backside
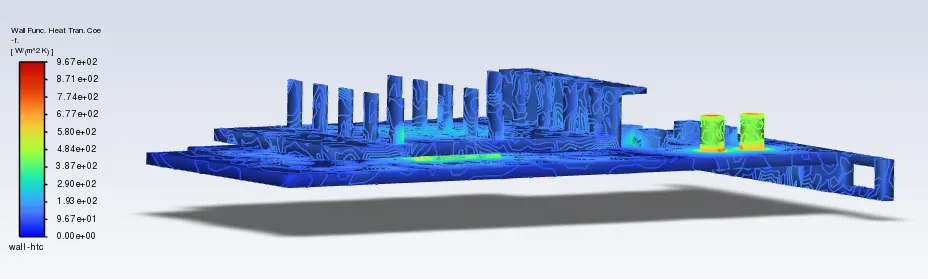
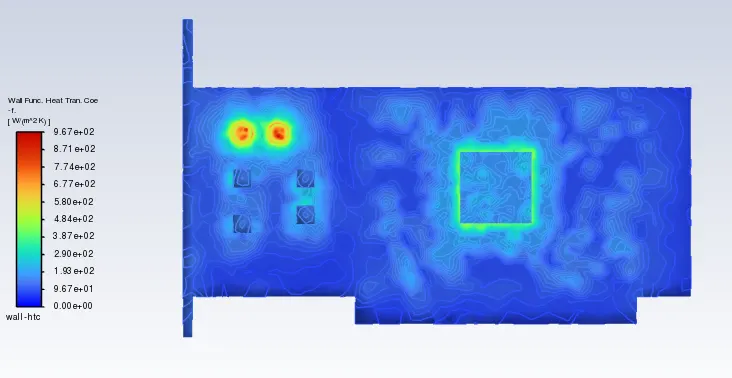
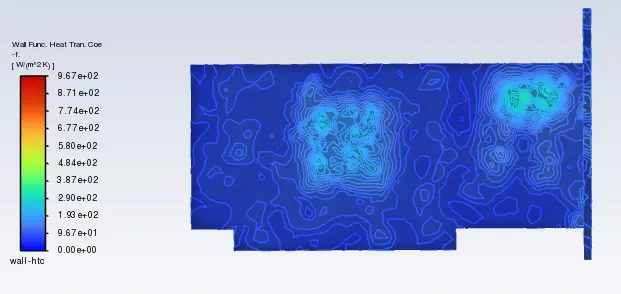
wall HTC contours
processor walls
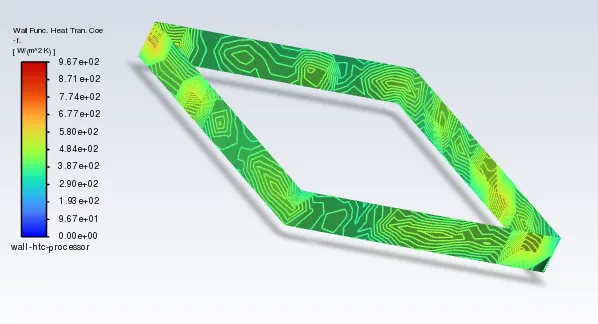
Entire Graphics card
only the base
backside
REFINED MESH
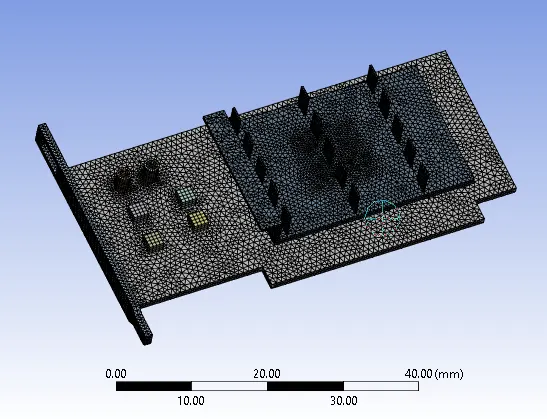
Graphics card fins
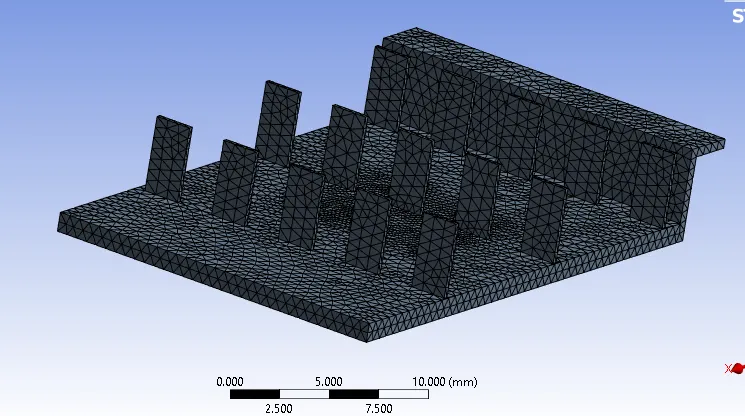
Graphics card processor
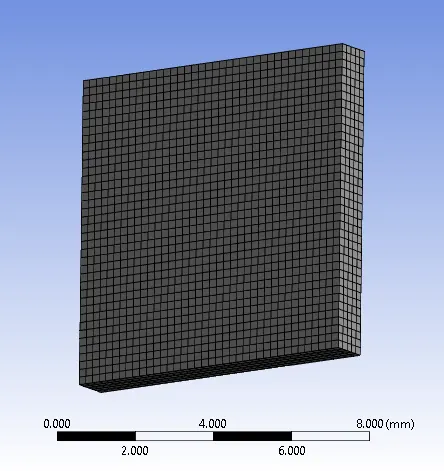
Graphics card base
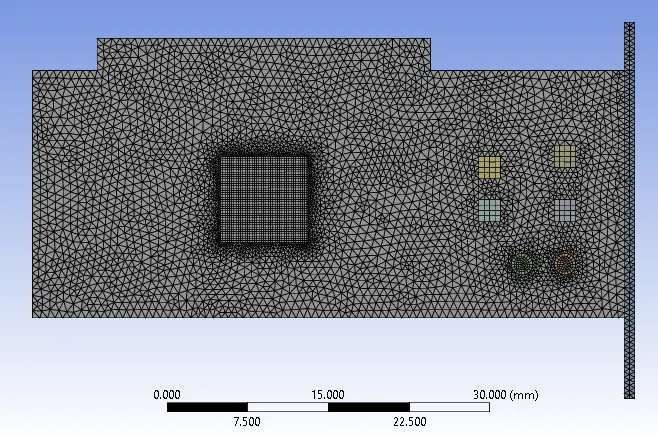
backside
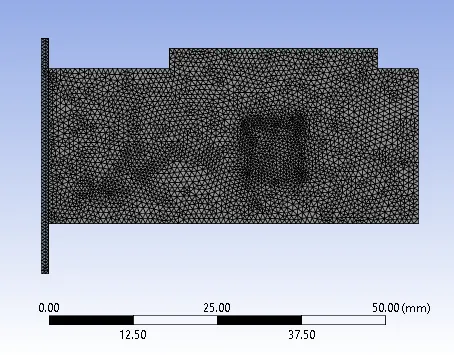
sectional view of domain shows conformed mesh generation
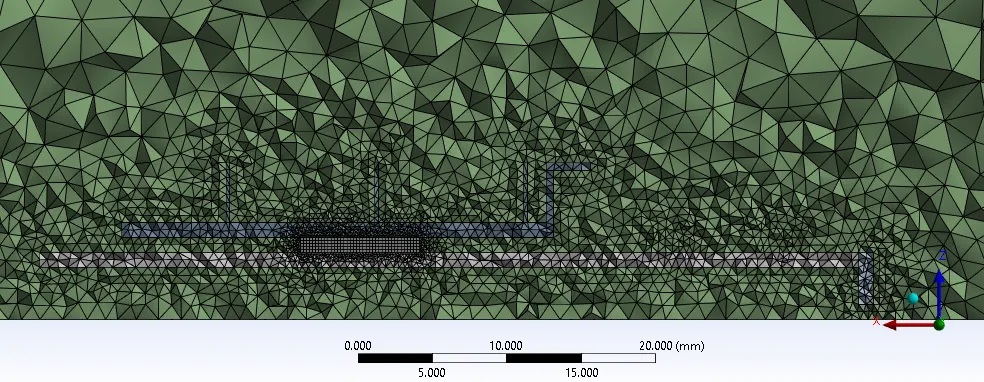
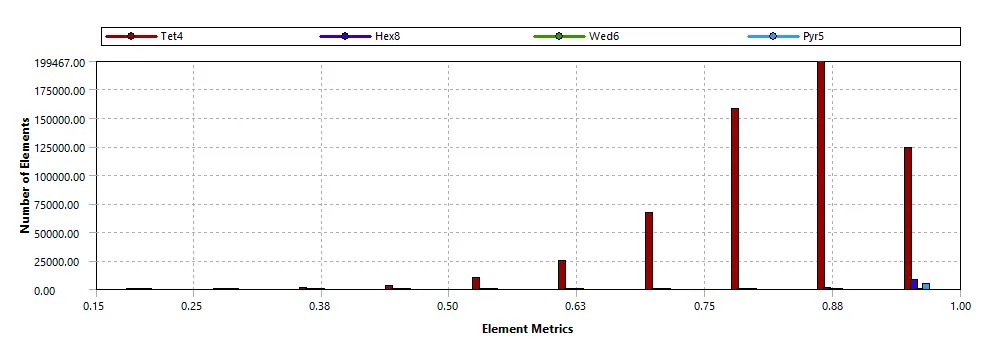
In the refined mesh, the domain is discretized into 597505 mesh elements. The element quality of the mesh is acceptable.
Enlisted below are body sizings provided to the different components
Mesh Element size: 4.7 mm
Body sizing processor: 0.2 mm
Body sizing base: 0.7 mm
Body sizing fins: 0.6 mm
Body sizing misc: 0.5 mm
(a) Inlet velocity of 1 m/s
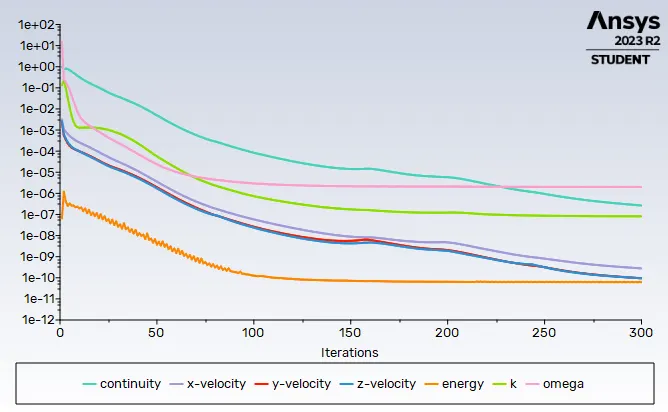
Scaled Residuals
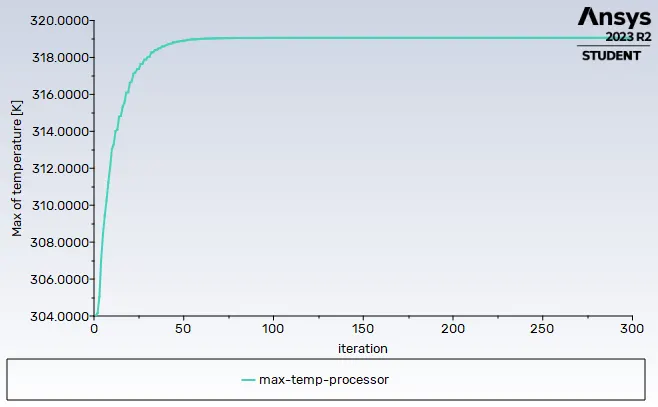
Maximum temperature of processor
Average temperature of graphics card
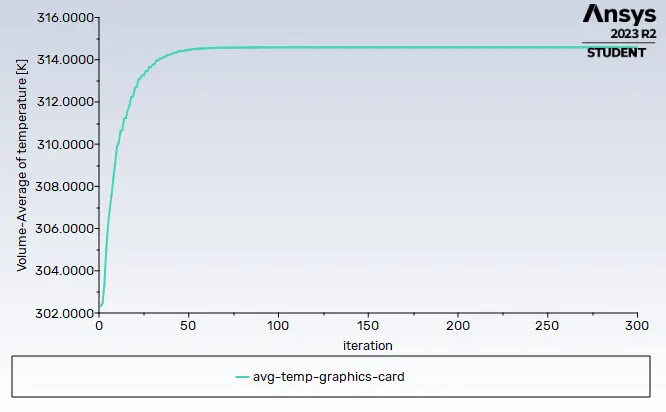
The above graphs along with scaled residuals show that convergence has been achieved.
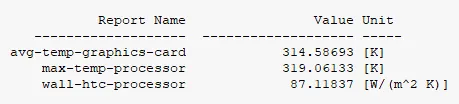
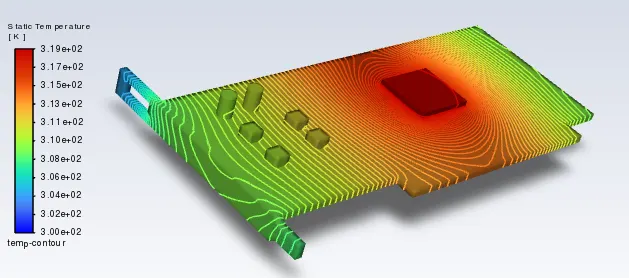
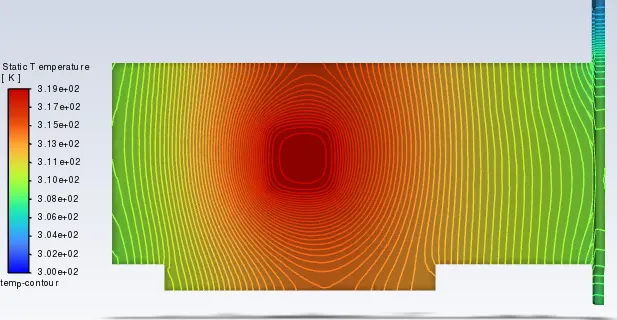
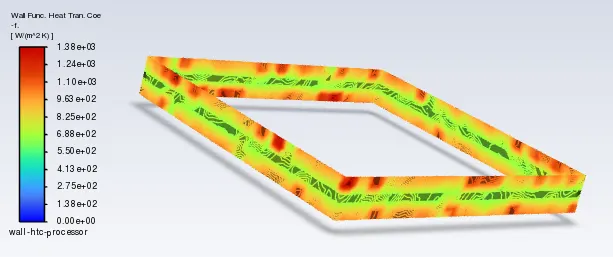
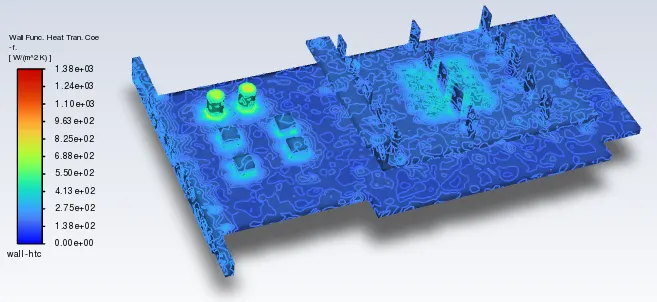
The average temperature attained by the graphics card, maximum temperature attained by the graphics card processor, and wall heat transfer coefficient (HTC) achieved by the graphics card processor are computed from report definitions and enlisted below.
Temperature contour of Graphics card
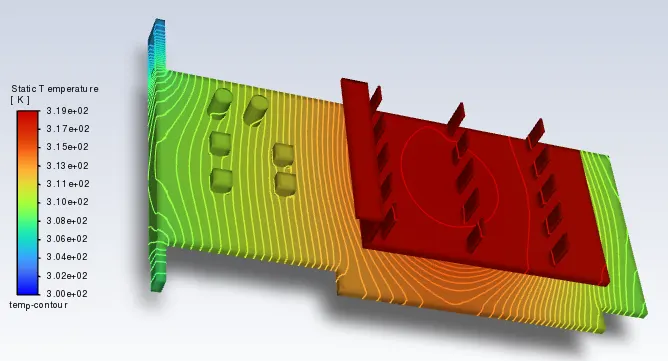
temperature contour without the fins
temperature contour of backside
Wall HTC
Wall HTC of processor walls
Wall HTC of graphics card
Wall HTC of graphics card base
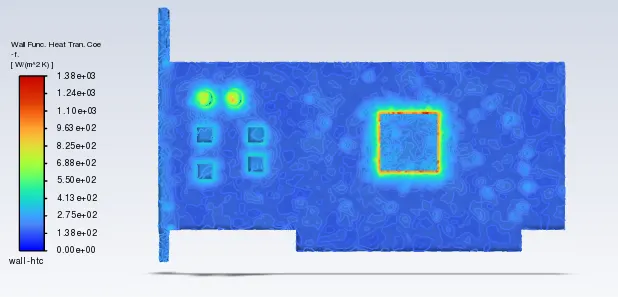
Wall HTC of graphics card backside
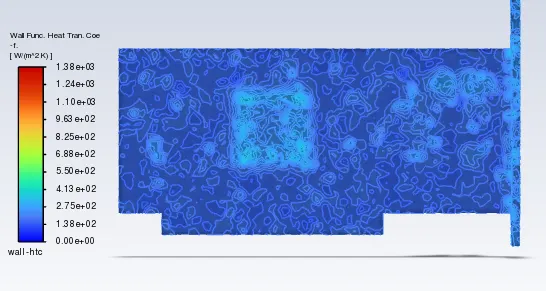
(b) Inlet velocity of 2.5 m/s
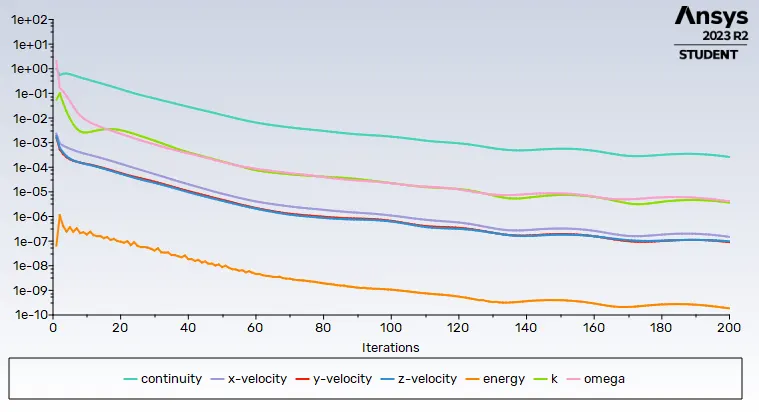
Scaled residuals
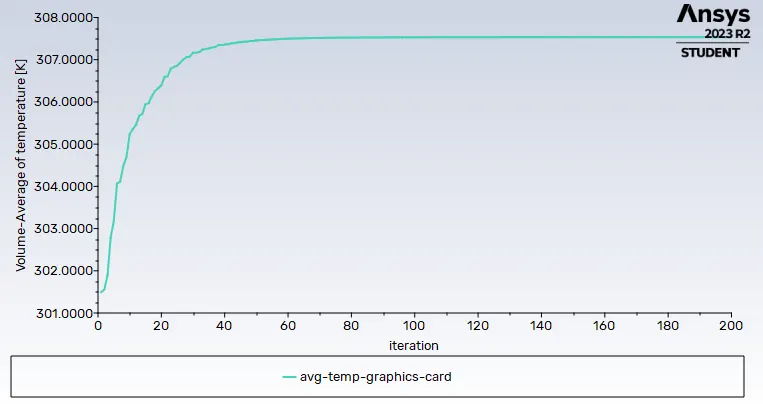
Average temperature of Graphics card
Wall HTC of Graphics card processor
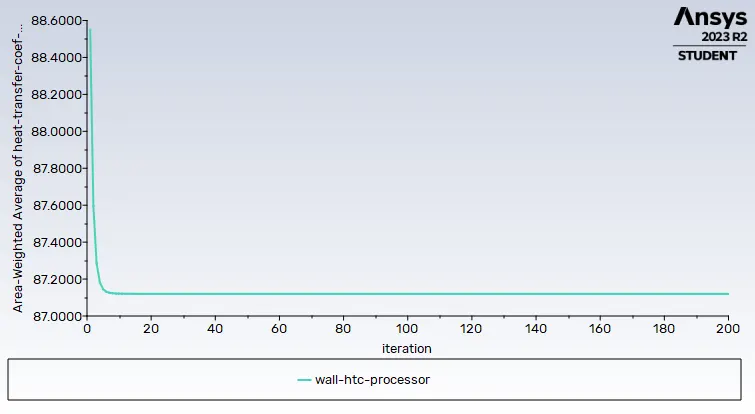
The above graphs along with scaled residuals show that convergence has been achieved.
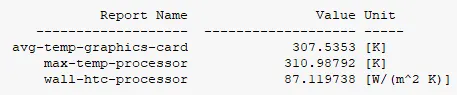
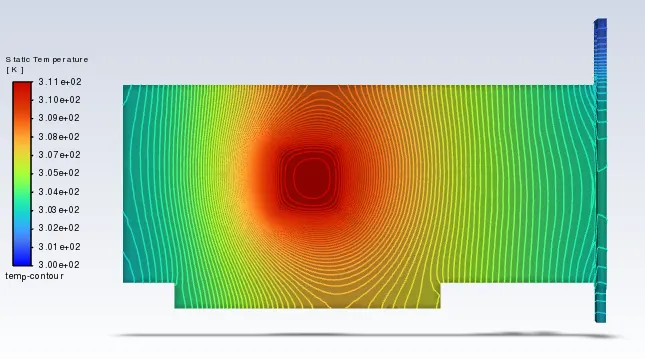
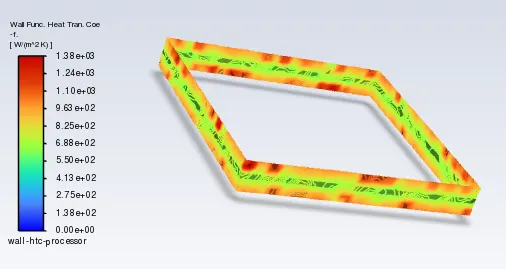
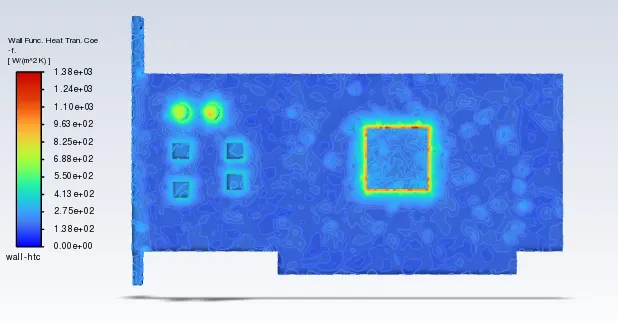
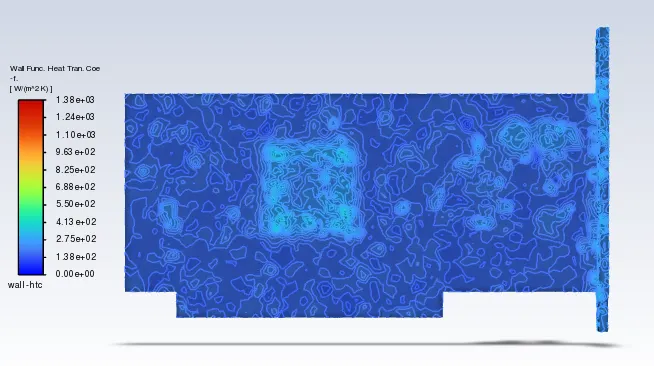
The average temperature attained by the graphics card, maximum temperature attained by the graphics card processor, and wall heat transfer coefficient (HTC) achieved by the graphics card processor are computed from report definitions and enlisted below.
temperature contour of Graphics Card
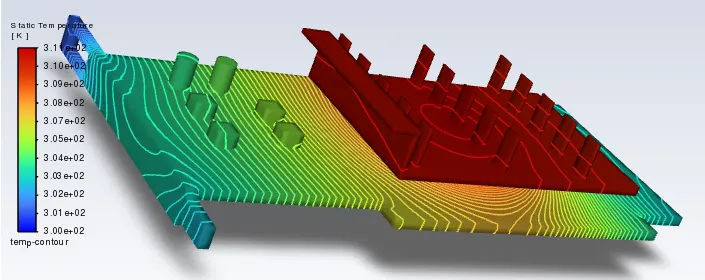
without fins
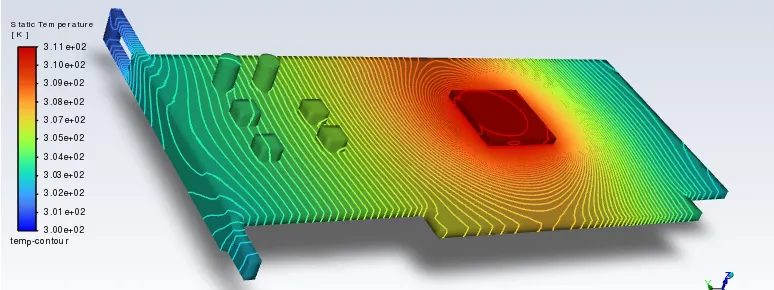
backside of graphics card
Wall HTC of Graphics card processor walls
Wall HTC of Graphics card base
Wall HTC of Graphics card backside
(c) Inlet velocity of 5 m/s
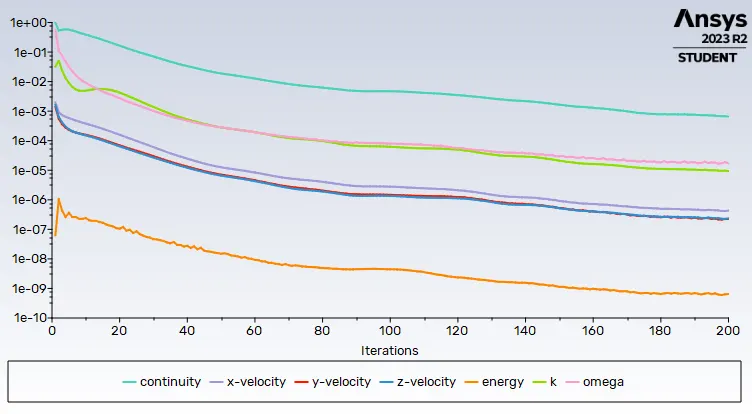
Scaled residuals
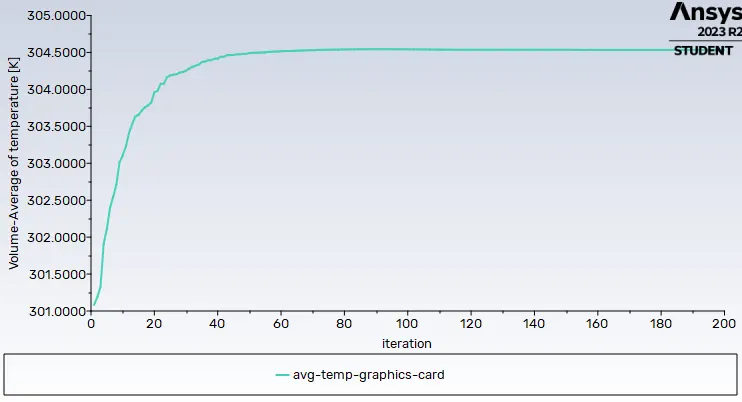
Average temperature of Graphics card
Wall HTC of Graphics card processor
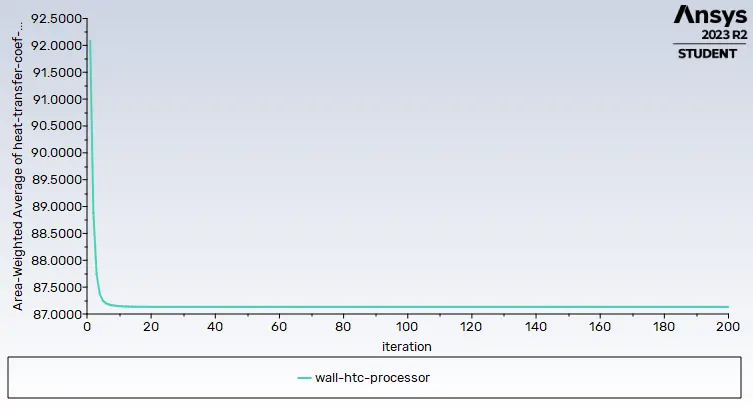
The above graphs along with scaled residuals show that convergence has been achieved.
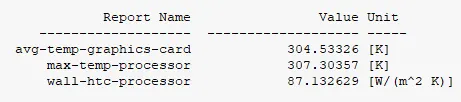
The average temperature attained by the graphics card, maximum temperature attained by the graphics card processor, and wall heat transfer coefficient (HTC) achieved by the graphics card processor are computed from report definitions and enlisted below.
temperature contour of Graphics Card
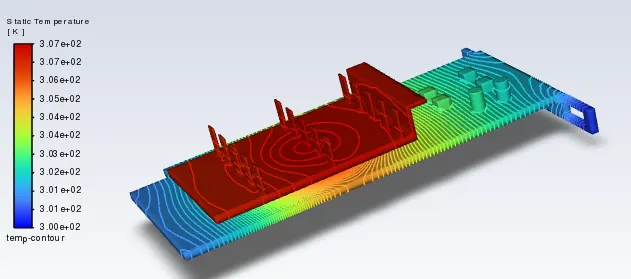
without fins
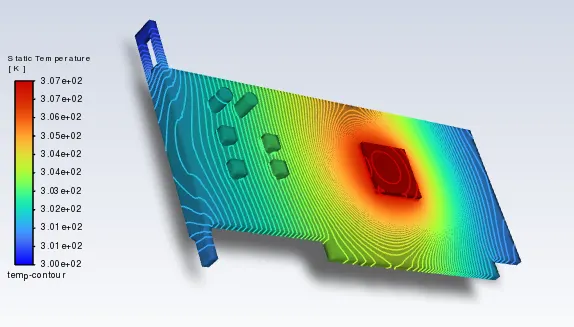
backside of graphics card
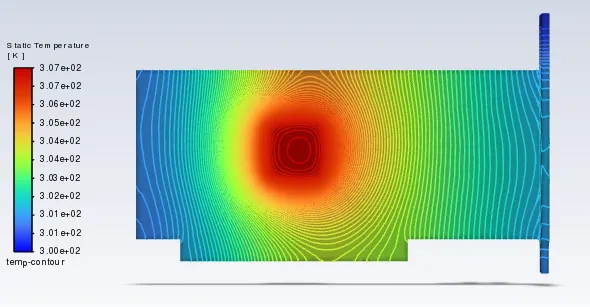
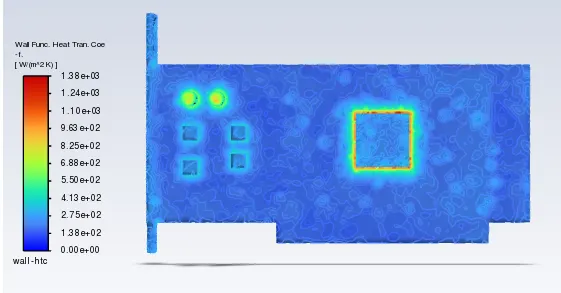
Wall HTC of Graphics card
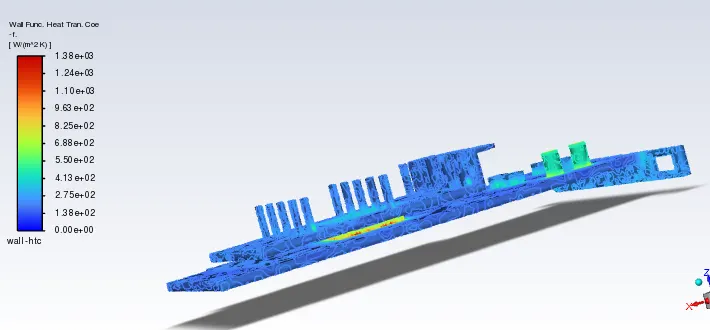
Wall HTC of Graphics card processor walls
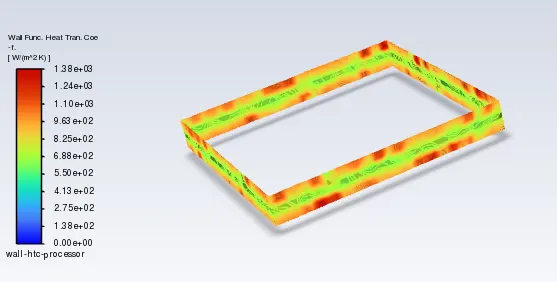
Wall HTC of processor walls and base of graphics card
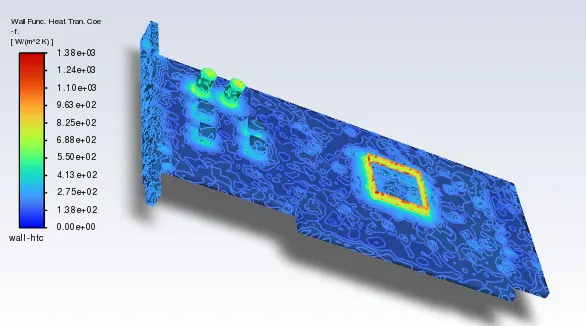
Wall HTC of Graphics card base
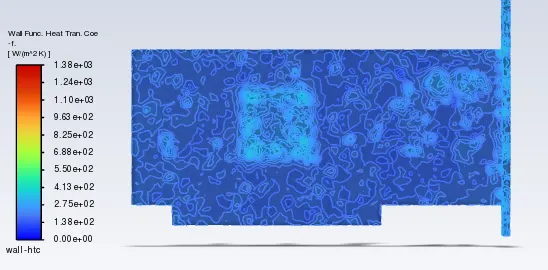
Wall HTC of Graphics card backside
| TABLE OF RESULTS |
Coarse mesh (1 m/s) |
Fine mesh (1 m/s) |
Fine mesh (2.5 m/s) |
Fine mesh (5 m/s) |
|
Maximum temperature of processor (K) |
318.93 | 319.06 | 310.98 | 307.30 |
|
Wall HTC of processor (W/m2K) |
44.83 | 87.11 | 87.12 | 87.13 |
|
Average temperature of graphics card (K) |
314.44 | 314.58 | 307.53 | 304.53 |
CONCLUSION
- CHT analysis of Graphics card was performed.
- Refined mesh yielded better results, especially for HTC.
- Hotspots were identified on the Graphics card base and fins. The hotspots were mainly in the regions with high proximity to the Graphics card processor. This shows that the physics has been captured successfully in these simulations.
- It was oberserved that with increase in air velocity, the maximum temperature of Graphics card processor reduced drastically. However, the HTC reduced very slightly.
- The miscellaneous electronic components present on the Graphics card base showed Higher HTC compared to the base itself although the material composition was same (Steel). This was due to the perpendicular exposure to air flow.
Reference
For obtaining properties of Silicon - https://www.el-cat.com/silicon-properties.htm#3