Week 6: Shock tube simulation project
Title: Shock tube simulation using CONVERGE
Aim:
- Setup a transient shock tube simulation
- Plot the pressure and temperature history in the entire domain.
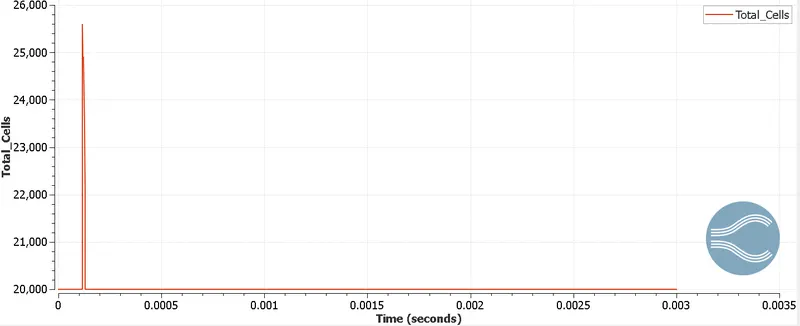
- Plot the cell count as a function of time.
Theory:
The shock tube is an instrument used to replicate and direct blast waves at a sensor or a model in order to simulate actual explosions and their effects, usually on a smaller scale. Shock tubes (and related impulse facilities such as shock tunnels, expansion tubes, and expansion tunnels) can also be used to study aerodynamic flow under a wide range of temperatures and pressures that are difficult to obtain in other types of testing facilities. Shock tubes are also used to investigate compressible flow phenomena and gas phase combustion reactions. More recently, shock tubes have been used in biomedical research to study how biological specimens are affected by blast waves.
A shock wave inside a shock tube may be generated by a small explosion (blast-driven) or by the buildup of high pressures which cause diaphragm(s) to burst and a shock wave to propagate down the shock tube (compressed-gas driven).
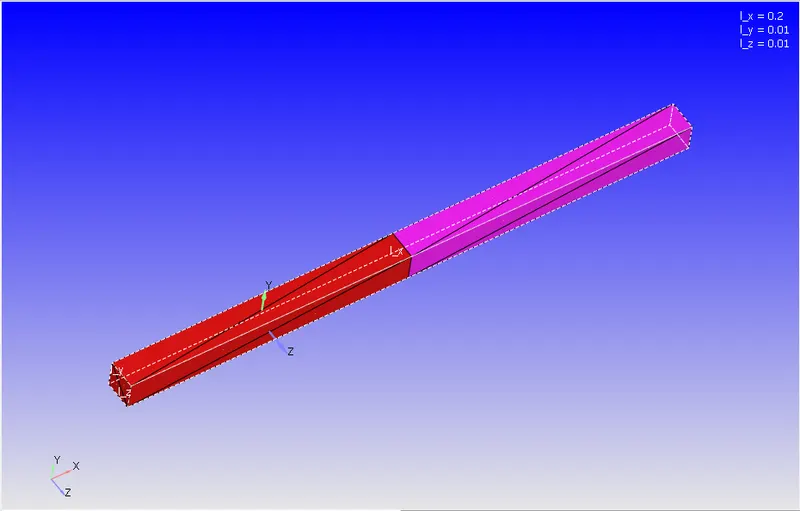
Geometry used for simulation
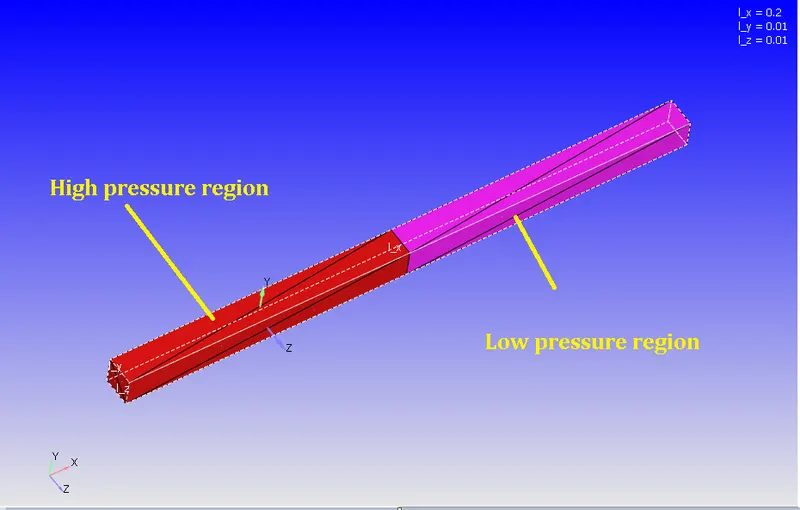
Boundary flagging
Case set up:
1) Application type: Time-based
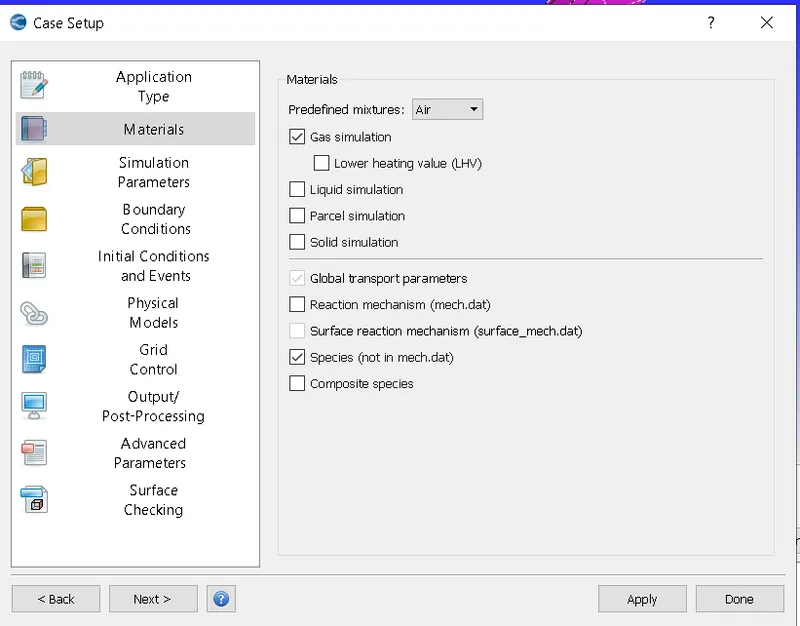
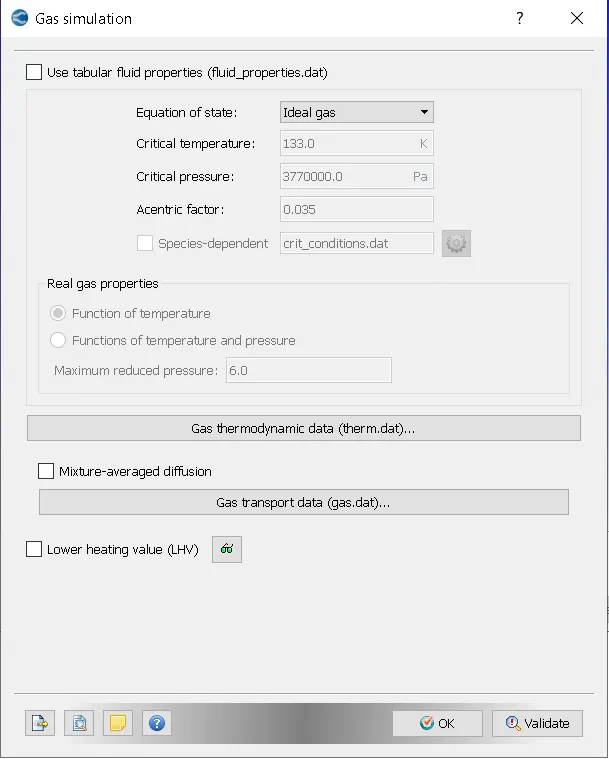
2) Materials:
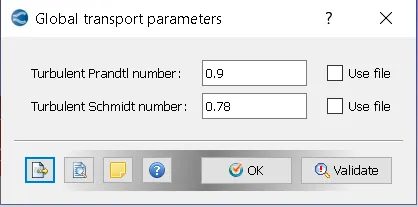
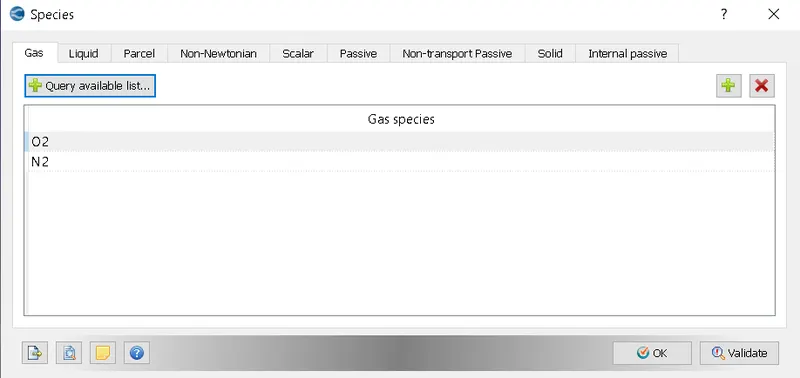
3) Simulation parameters
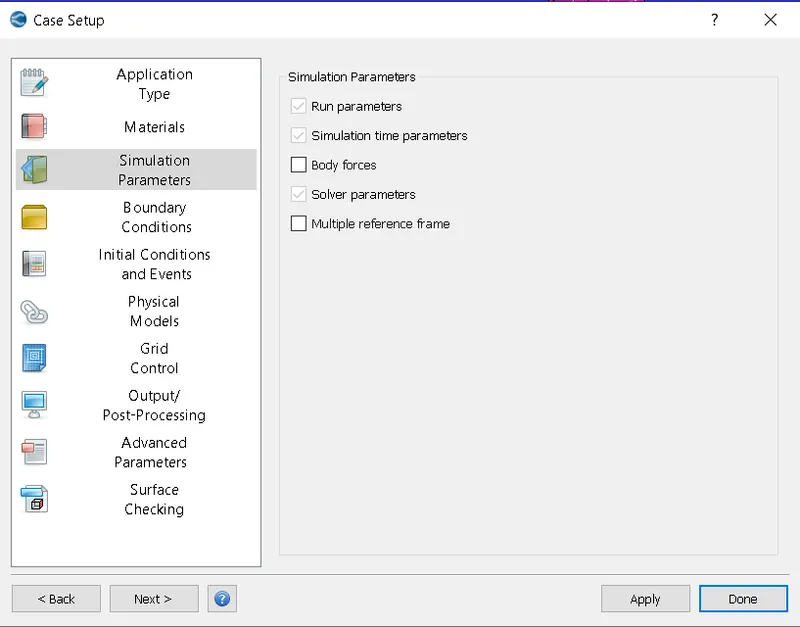
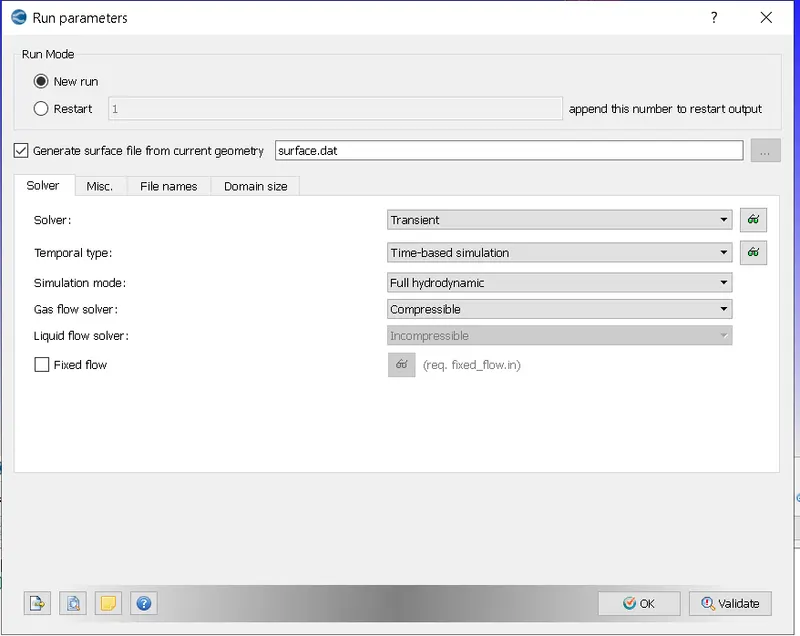
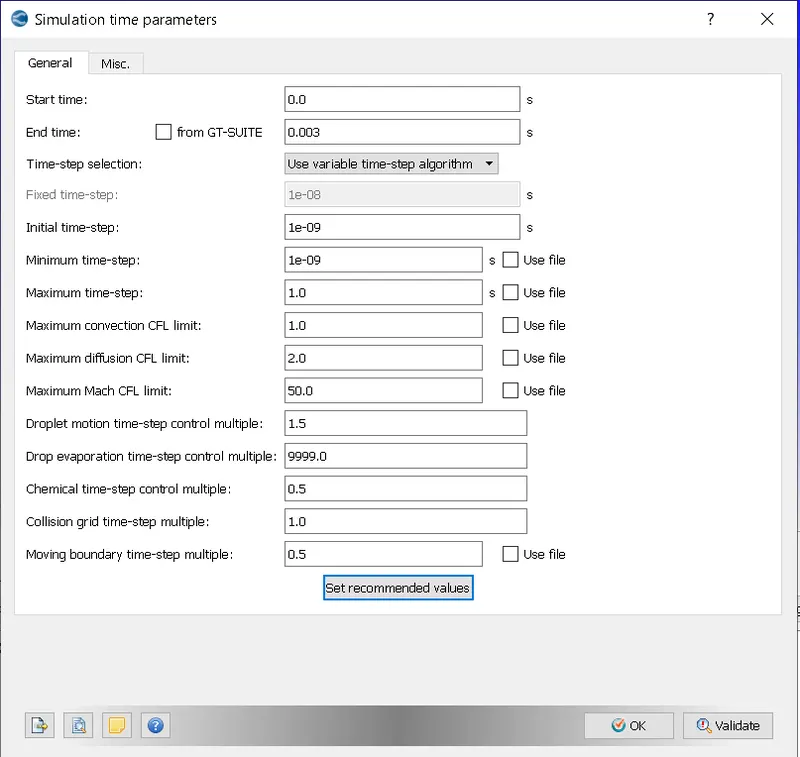
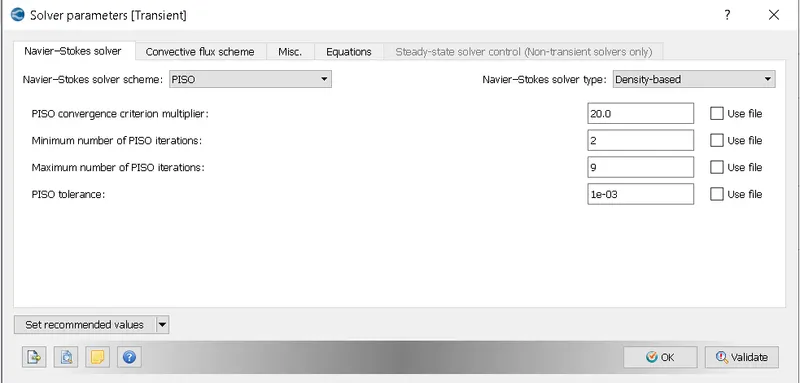
4) Boundary conditions
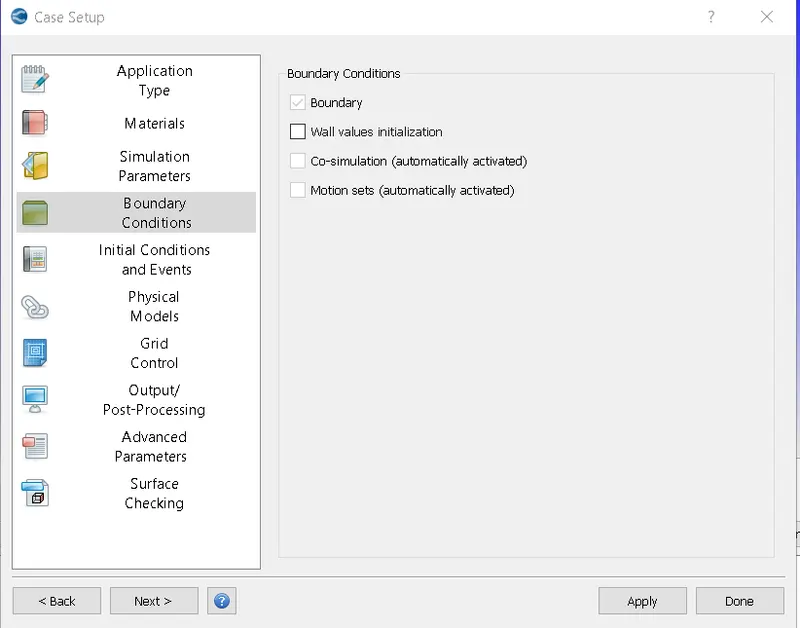
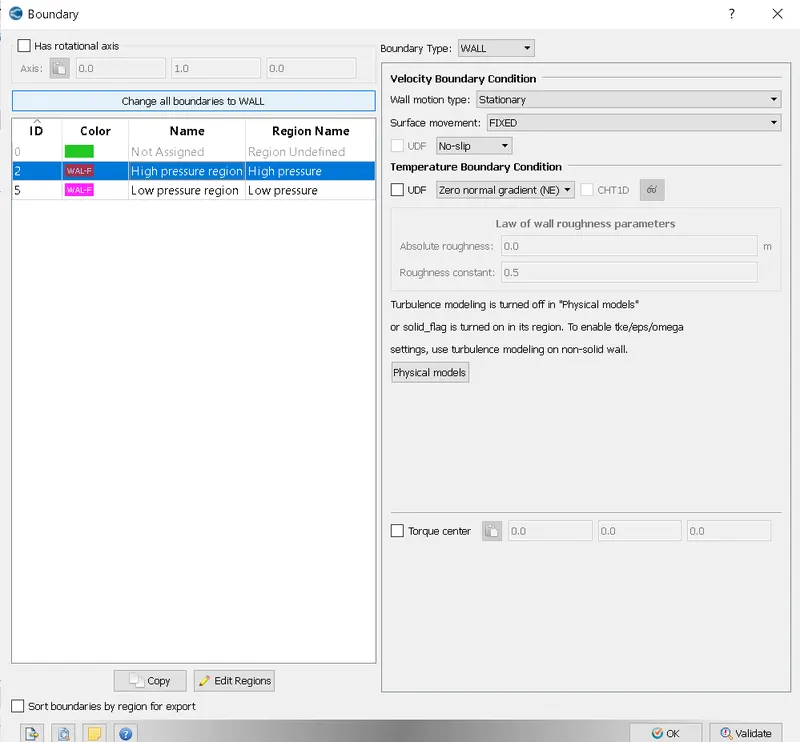
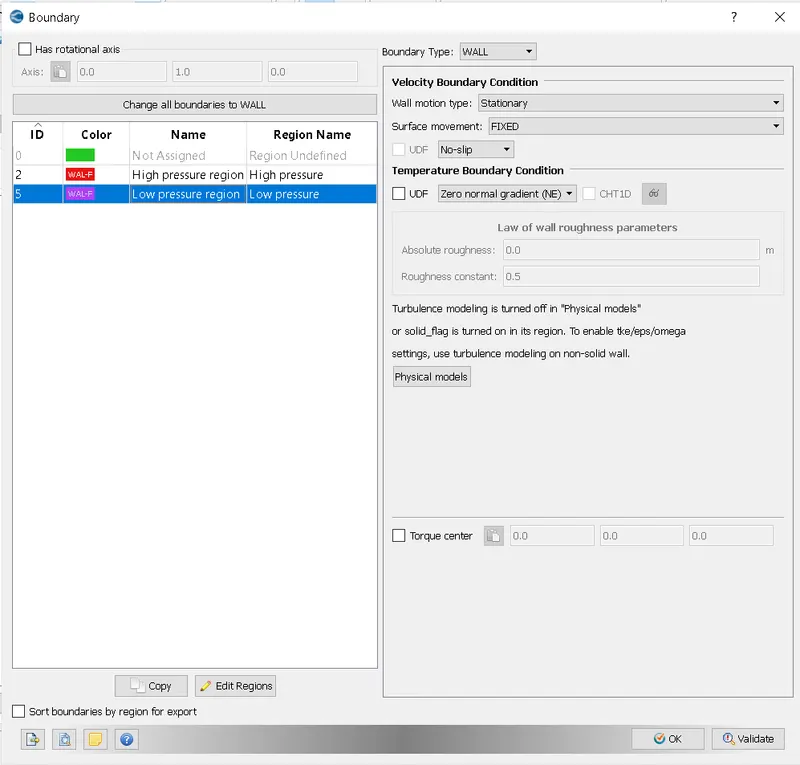
For both the regions i.e. high pressure and low pressure, velocity boundary condition is wall, with wall motion type as stationary and with no-slip. And for temperature, boundary condition is zero normal gradient.
5) Initial conditions and events
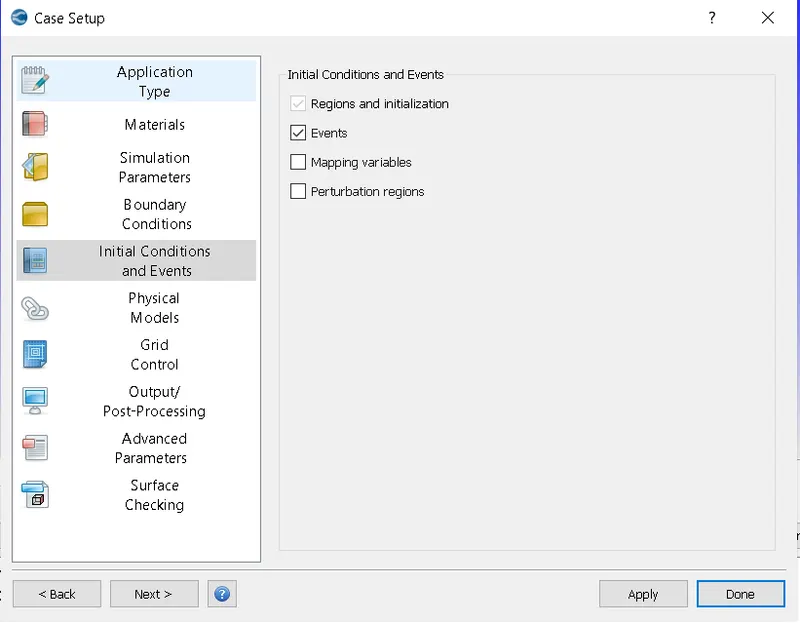
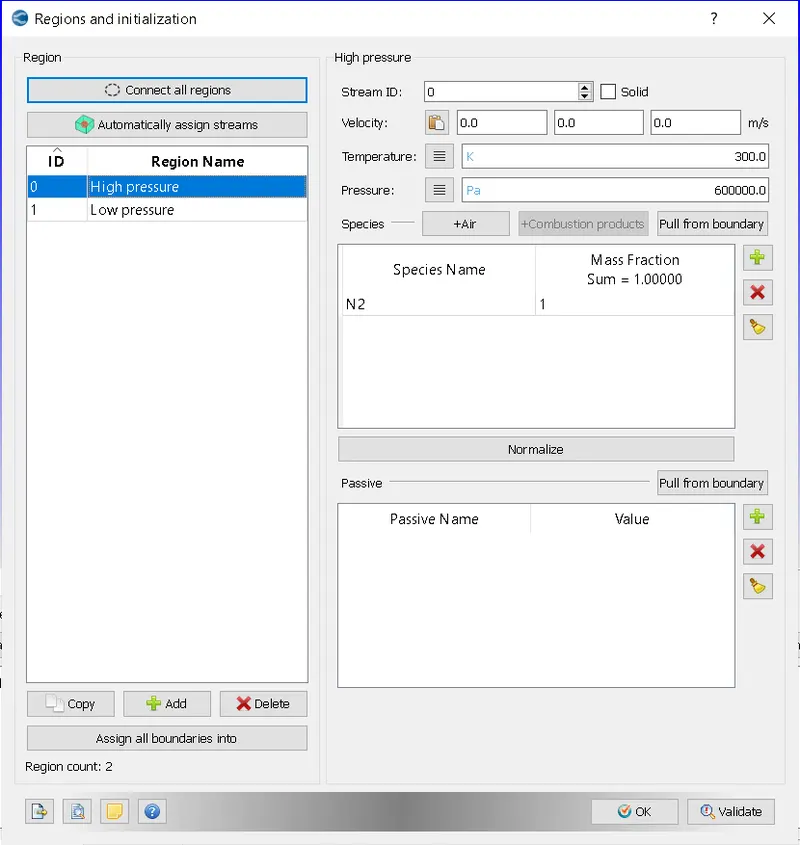
High pressure region is initialised with Pressure = 6 bar and Temp.=300 k.
Initially high pressure region is filled with N2.
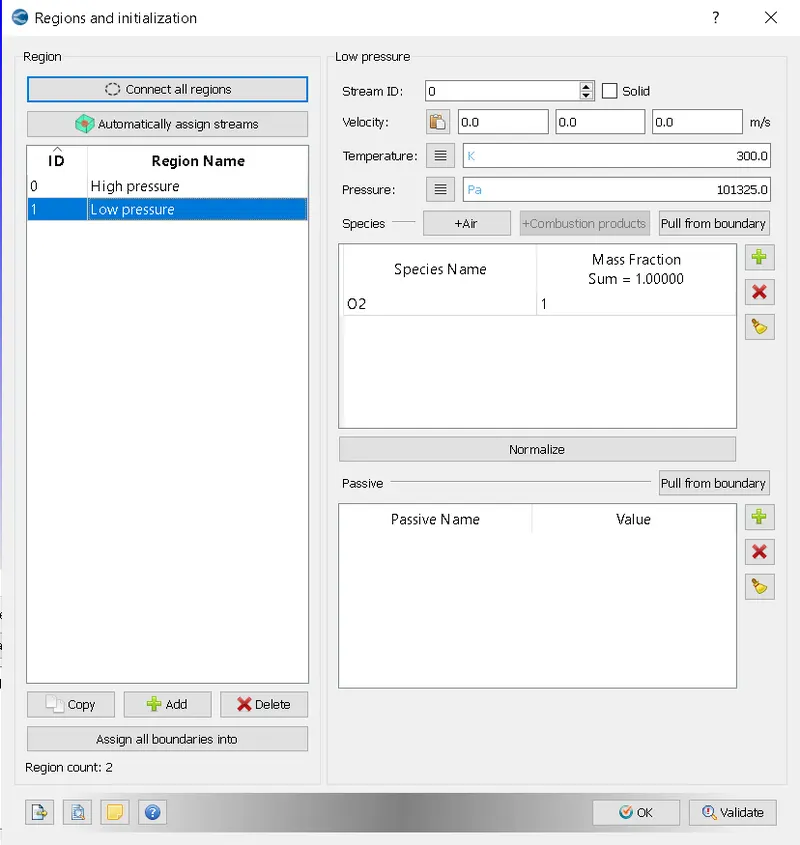
Low pressure region is initialised with Pressure = 1.01325 bar and Temp.=300 k
Initially low pressure region is filled with O2.
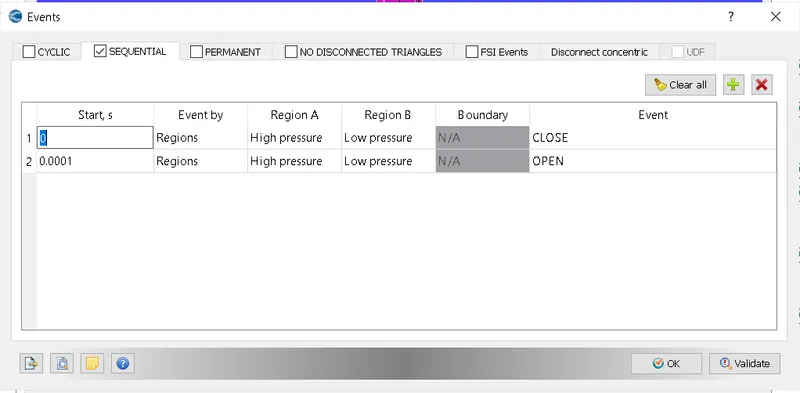
Events are created in a such way that at 0.0001 second, diaphragm is getting open and there is intermixing of O2 and N2.
6) Grid controll
Results:
Mesh

Velocity contour at the end of simulation
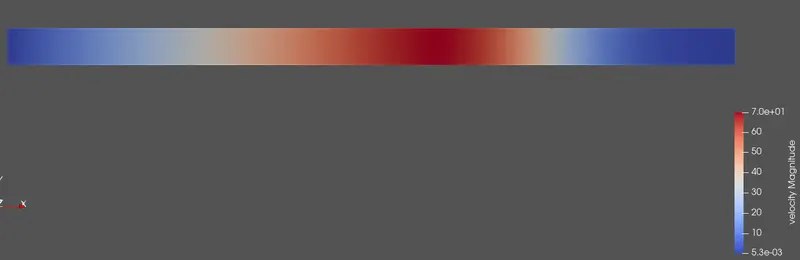
Velocity animation: https://youtu.be/nzjsXVBIT9E
Pressure contour at the end of simulation
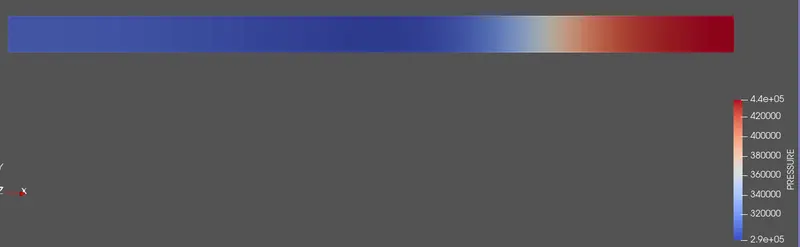
Pressure animation: https://youtu.be/7OOQR7M6keo
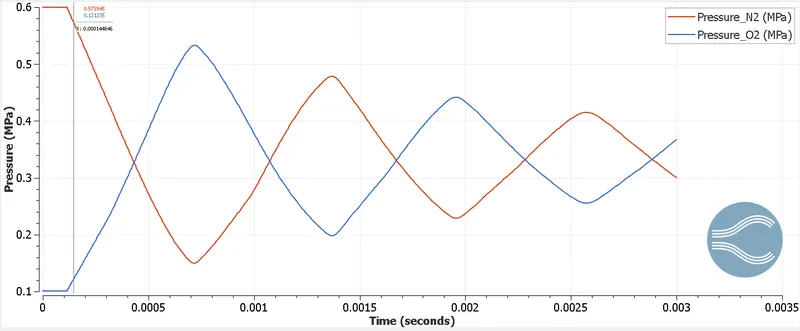
Pressure variation of O2 and N2
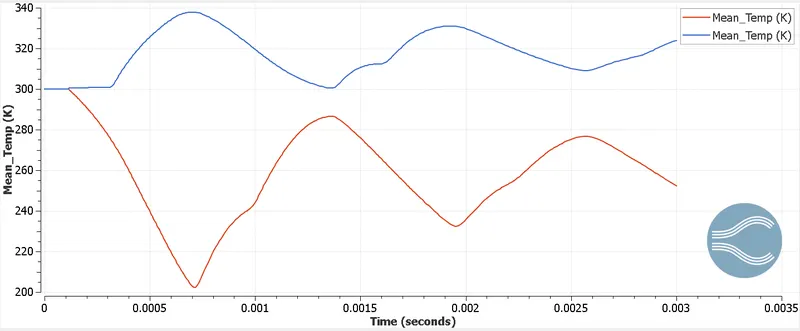
Temperature variation of O2 and N2
Results and discussion
- As can be seen from pressure plot, there is alternate compression and expansion for each species (O2 and N2). With time pressure difference between O2 and N2 is decresing.
- With sudden incresed in pressure from high pressure region to low pressure region is causing fromation of shock wave.
- There is also varitaion in tempeerature with time.
- After opening diphragm, pressure in low pressure region increases and presure in high presure decreases.
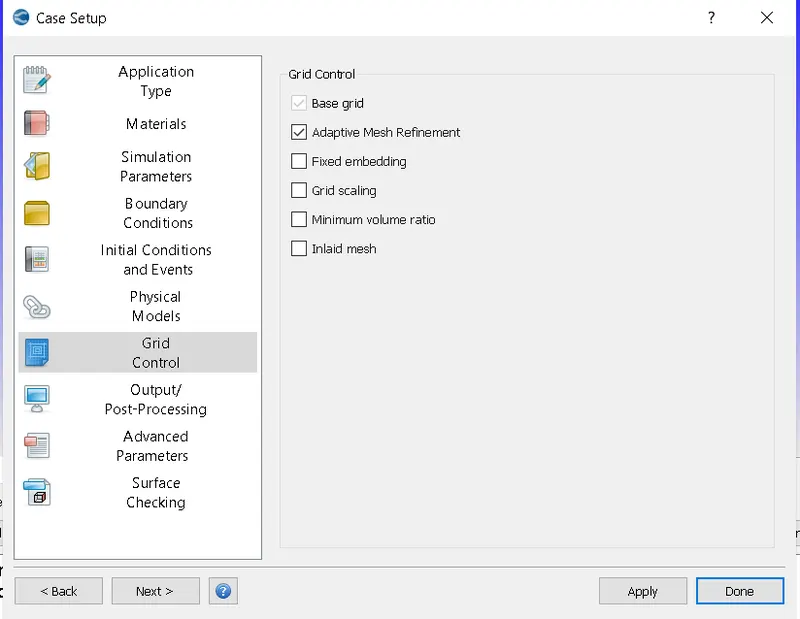
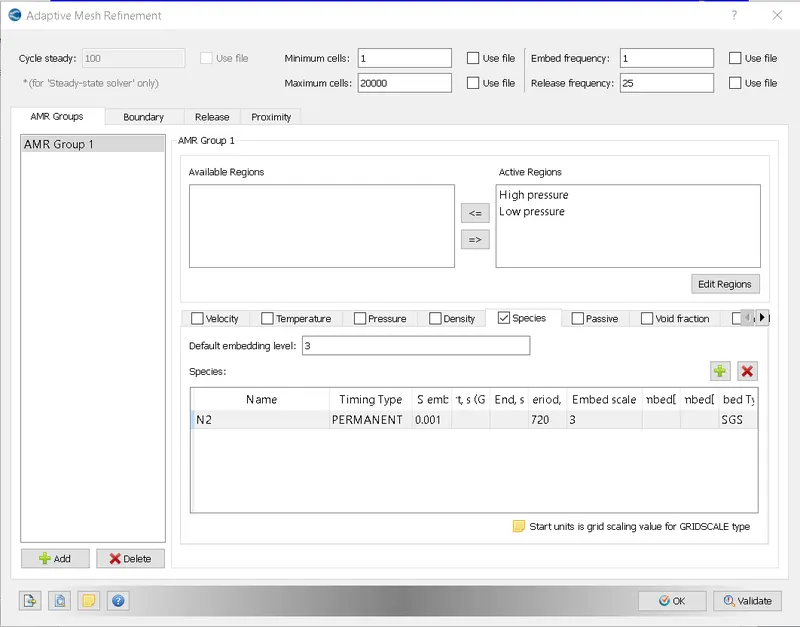
- Initially there is a sudden incresed in no. of cells due adaptive mesh refinement.