Week 6 - Data analysis
Objective:
Compatibility check, Data visualizer and Basic performance calculation
Problem Statement:
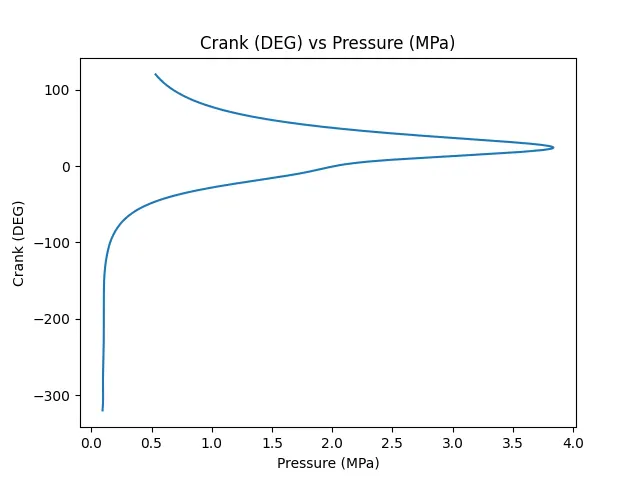
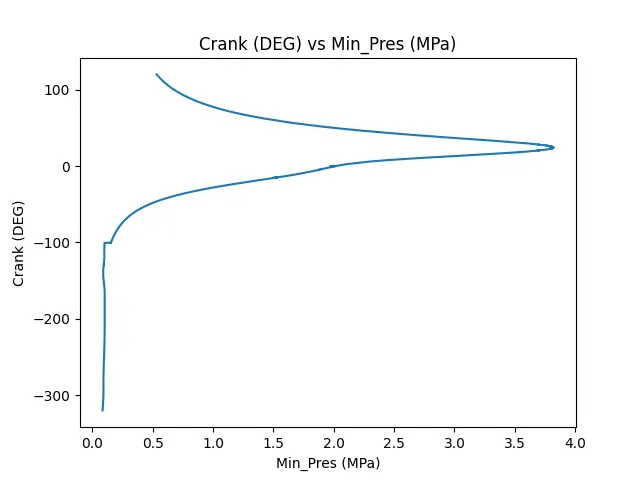
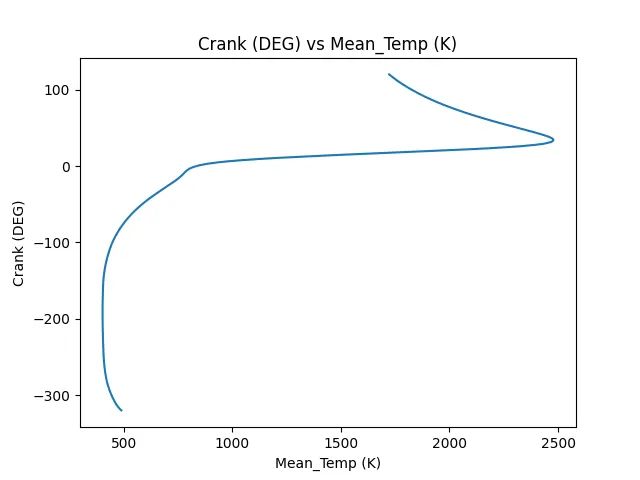
- The plot labels should be extracted from the file. If, I request for a plot between column 1 (crank angle) and column 8(volume), then the label information should automatically be extracted and must appear as labels in the plots. THIS SHOULD NOT BE DONE MANUALLY
- You code should exit gracefully, if a non-compatible file is provided as an input. It should say something like "File not recognized. Please provide a valid CONVERGE output file"
- Calculate the area under the P-V diagram. P is in column 2 and V is in column 8.
- Calculate the power output of this engine. Assume that RPM is 1500
- This engine consumed 20 micro grams of fuel (per 1 stroke cycle). Calculate its specific fuel consumption.
Solution Procedure:
code:
import sys
import numpy as np
import matplotlib.pyplot as plt
# Prompting user for CONVERGE output filePath
filePath = input("\nEnter the name of CONVERGE output filePath without extension: ") + ".out"
# Check the existence of file
try:
with open(filePath):
pass
except FileNotFoundError:
print('File not recognized. Please provide a valid CONVERGE output file')
sys.exit()
## number of lines in header section of file
i = 0
for line in open(filePath):
if '#' not in line:
break
i += 1
#print(i)
# find the starting line of data after skipping the header section
j = 0
for line in open(filePath):
j += 1
if j > i:
break
#print(j)
# If no data is present in the file, exit
if j == i:
print('No data present in the CONVERGE output file')
sys.exit()
# get column names and indices
for line in open(filePath):
if i == 2:
c = line.split() # Split column units
i = 0
break
if i == 1:
b = line.split() # Split column names
i += 1
if 'column' in line.split():
a = line.split() # Split column indices
i = 1
#print(a)
#print(b)
#print(c)
# a should have only numbers in interger format. b adn c should not have '#'
a.remove("column")
a.remove("#")
#print(a)
a = [int(x) for x in a]
print(a)
b.remove("#")
#print(b)
c.remove("#")
#print(c)
num_col = len(a)
#print(num_col) # Number of columns in the data
# store data in array data
data_counter = 0
# np.arrange() arranges the column numbers from 1-17 to 0-16 for further use.
data = np.arange(0, num_col)
#print(data)
for line in open(filePath):
if '#' not in line:
d = line.split() # Split data points
d = np.array(d, dtype=np.float32) # Convert data points to float32 for accuracy
data = np.vstack([data, d]) # Stack data points as seen in the input file
data_counter += 1
print(data)
data = np.delete(data, 0, 0) # Delete the initial placeholder row
print(data)
# Display available variables for plotting
print('\nType -')
for i in a:
print('{} for {}'.format(i, b[i - 1]))
print('')
x = input("Do you want a plot between any two variables? (y/n): ")
# plot according to input
while x.lower() == 'y':
cn1 = int(input("Enter the column number of the variable along X-axis (Refer input map above): "))
cn2 = int(input("Enter the column number of the variable along Y-axis (Refer input map above): "))
plt.figure()
plt.plot(data[:, cn1 - 1], data[:, cn2 - 1])
plt.xlabel('{} {}'.format(b[cn1 - 1], c[cn1 - 1]))
plt.ylabel('{} {}'.format(b[cn2 - 1], c[cn2 - 1]))
plt.title('{} {} vs {} {}'.format(b[cn2 - 1], c[cn2 - 1], b[cn1 - 1], c[cn1 - 1]))
# Engine performance analysis
print('\nEngine performance analysis')
# Find columns for pressure and volume
b1 = [i.lower() for i in b]
pressure_column = b1.index('pressure') # Find pressure column index
volume_column = b1.index('volume') # Find volume column index
# Extract pressure and volume data
pressure = data[:, pressure_column] # Extract pressure data
volume = data[:, volume_column] # Extract volume data
# Calculate work done per cycle (Area under P-V curve)
A = np.trapezoid(pressure, volume) * 1e6 # Calculate area under the curve
# Taking input from user for RPM and fuel consumption
rpm = 1500
fuel_consumed_per_cycle = 20
# Calculate power output and specific fuel consumption
speed = (rpm / 60) / 2 # Convert rpm to cycles per second
P = A * speed # Calculate power output
f = (fuel_consumed_per_cycle * rpm * 3600) / 1e9 # Convert micrograms to kilograms and adjust for time
sfc = (f * 1000) / P # Convert fuel consumption to kg/kW.hr
# Display results
print('\nArea under the P-V curve (Work done per cycle): {} J'.format(A))
print('\nPower output at {} rpm: {} kW'.format(rpm, P/1000))
print('\nSpecific fuel consumption: {} Kg/KW.hr'.format(sfc))
#Plotting area under PV
plt.plot(volume, pressure, color='blue', label='PV curve')
plt.fill_between(volume, pressure, color='lightblue', label='Area under curve')
plt.xlabel("Volume")
plt.ylabel("Pressure")
plt.legend()
plt.title("P-V Diagram and Area under Curve")
plt.savefig("area_under_PV_curve.png")
plt.show()
Results and Discussion:
a is converted from this
['#', 'column', '1', '2', '3', '4', '5', '6', '7', '8', '9', '10', '11', '12', '13', '14', '15', '16', '17']
to this
[1, 2, 3, 4, 5, 6, 7, 8, 9, 10, 11, 12, 13, 14, 15, 16, 17]
b is converted from this
['#', 'Crank', 'Pressure', 'Max_Pres', 'Min_Pres', 'Mean_Temp', 'Max_Temp', 'Min_Temp', 'Volume', 'Mass', 'Density', 'Integrated_HR', 'HR_Rate', 'C_p', 'C_v', 'Gamma', 'Kin_Visc', 'Dyn_Visc']
to this
['Crank', 'Pressure', 'Max_Pres', 'Min_Pres', 'Mean_Temp', 'Max_Temp', 'Min_Temp', 'Volume', 'Mass', 'Density', 'Integrated_HR', 'HR_Rate', 'C_p', 'C_v', 'Gamma', 'Kin_Visc', 'Dyn_Visc']
c is converted from this
['#', '(DEG)', '(MPa)', '(MPa)', '(MPa)', '(K)', '(K)', '(K)', '(m^3)', '(kg)', '(kg/m^3)', '(J)', '(J/time)', '(J/kg-K)', '(J/kg-K)', '(none)', '(m^2/s)', '(N*s/m^2)']
to this
['(DEG)', '(MPa)', '(MPa)', '(MPa)', '(K)', '(K)', '(K)', '(m^3)', '(kg)', '(kg/m^3)', '(J)', '(J/time)', '(J/kg-K)', '(J/kg-K)', '(none)', '(m^2/s)', '(N*s/m^2)']
then the map is made like this
Type -
1 for Crank
2 for Pressure
3 for Max_Pres
4 for Min_Pres
5 for Mean_Temp
6 for Max_Temp
7 for Min_Temp
8 for Volume
9 for Mass
10 for Density
11 for Integrated_HR
12 for HR_Rate
13 for C_p
14 for C_v
15 for Gamma
16 for Kin_Visc
17 for Dyn_Visc
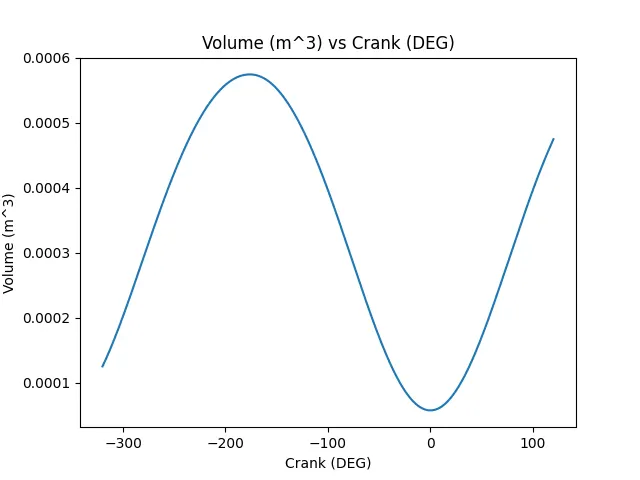
pressure volume diagram:
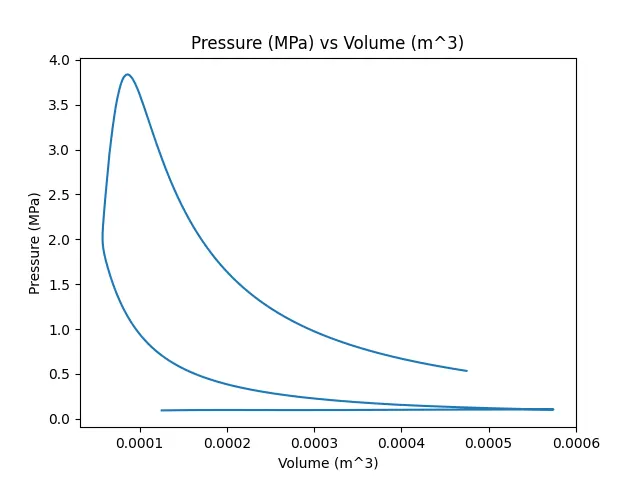
A = np.trapezoid(pressure, volume) * 1e6 # Calculate area under the curve
A = 500.586631438412 MPa * m^3
calculating power output:
Power output at 1500 rpm: 6.25733289298015 kW
Specific fuel consumption: 0.017259749776324166 Kg/KW.hr
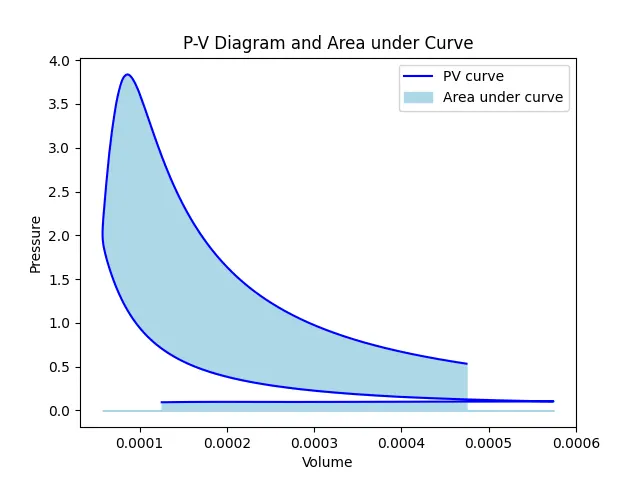

some other graphs are as follows: