Week 4.1 - Genetic Algorithm
% stalagmite function

function [result] = stalagmite(input_vector)
    x = input_vector(1);
    y = input_vector(2);
    f1x = (sin(5.1 * pi * x + 0.5)).^6;
    f1y = (sin(5.1 * pi * y + 0.5)).^6;
    f2x = exp(-4 * log(2) * ((x - 0.0667)^2/(0.64)));
    f2y = exp(-4 * log(2) * ((y - 0.0667)^2/(0.64)));
    result =-( f1x * f1y * f2x * f2y);
end
as genetic algorithm finds the minimum value of the function input, we multiply the output of the stalagmite function by by -1 to feed into the genetic algorithm.
this the final code.
for k = 1:8 % this loop is to generate graph of predicted values of x (red) and y (blue) values for max value of stalagmite function
for m = 1:8 % this loop is to calculate the minimum value of the stalagmite function
x = linspace(0, 0.6, 150); % define x
y = linspace(0, 0.6, 150); % define y
[xx, yy] = meshgrid(x, y); % form a grid of x and y

for i = 1:length(xx)
    for j = 1:length(yy)
        input_vector(1) = xx(i,j); % value 1 specified
        input_vector(2) = yy(i,j); % value 2 specified
        f(i, j) = stalagmite(input_vector); % output of stalagmite funtion stored in f value
    end
end


for i = 1:100
lb = [0 0]; % lower bound for the values we want the results to stay in
ub = [0.6 0.6]; % upper bound for the values we want the results to stay in
[results, fval(i)] = ga(@stalagmite, 2, [], [], [], [], lb, ub); % the genetic algorithm applied.
% stalagmite is the function on which the genetic algorithm is to be
% applied. there are 2 variables x and y. lower and upper bound is provided
% to narrow the search for the algorithm to work on. that is the way the
% algorithm is written.
xval(i)=results(1); % to calculate the x value from results
yval(i)=results(2); % to calculate the y value from results
i = i + 1; % ince=rease the counter
end
k(m) = min(fval); % min value of fval stored in k
end

figure(1) % to plot the values of min of fval with consecutive iterations
for i = 1:8
hold on
plot(i, k(i),'*')
axis([0 9 -1.2 0])
xlabel('iterations')
ylabel('max value of stalagmite function * (-1)')
end
hold on
figure(2)
surfc(xx, yy, f) % graph plotted for f value over whole grid
xlabel('x axis')
ylabel('y axis')
shading interp

figure(3) % to plot the values of the resulting x and y values for which the function is minimum according to the genetic algorithm
plot(k, results(1),'*','color','r')
hold on
plot(k, results(2),'*','color','b')
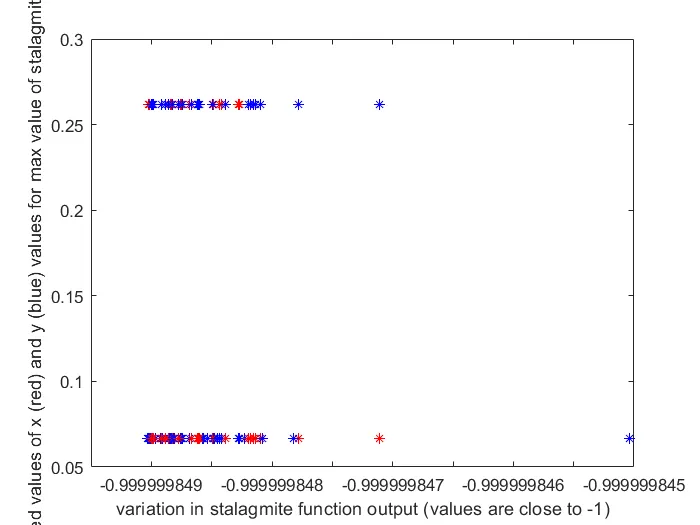
xlabel('variation in stalagmite function output (values are close to -1)')
ylabel('predicted values of x (red) and y (blue) values for max value of stalagmite function')
end
global maxima is found out by the following graph. (fmax vs number of iterations)
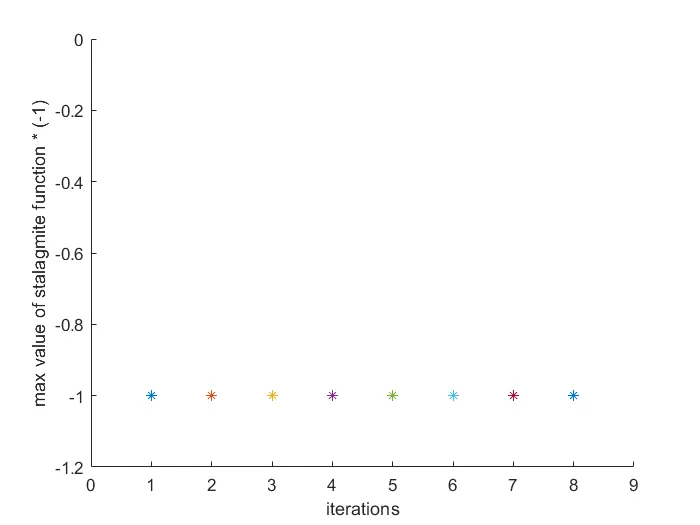
for 8 iterations, the min value of function is close to -1 as seen in the graph.
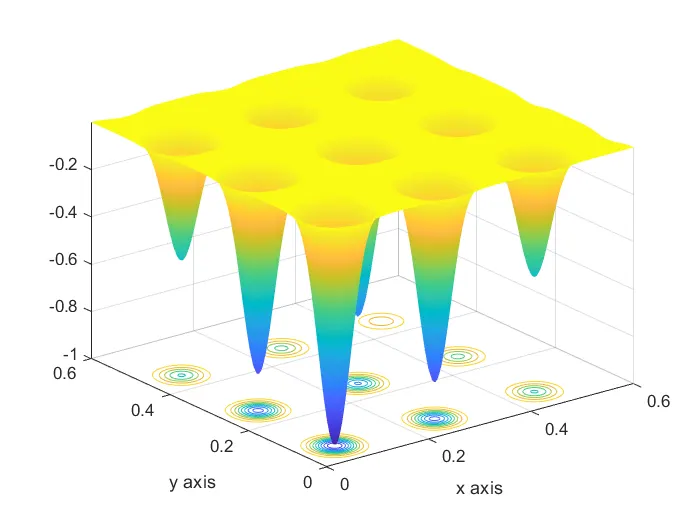
this is the distribution graph.
Concept of genetic Algorithm:
1. it is based on the evolution theory by Charles Darwin. (Evolutionary biology)
2. it starts with initial generation of candidate solution that are tested against the objective function. the objective function here is the stalagmite function. two values are fed and output is calculated and plotted on the mesh grid graph.
3. Subsequent generation evolve from the first generation by selection, crossover and mutation.
4. Selection means retaining the best generation of parents from the first generation.
5. Crossover means selecting the common characteristics from the best parents and forming next generation.
6. mutation, however, changes the characteristics from the parents to build new characteristic next generation.
Syntax for genetic algorithm (ga) in MATLAB:
[results, fval, exitFlag, Output] = ga(@stalagmite, 2); % genetic algorithm is applied here.
results: they give the x and y coordinate values for which the function is max or min, as according to stalagmite function,
fval: it gives the value at a particular x and y value.
When the code is made to run several times, the x and y values predicted change. the min value of the function also changes. but it is not a significant change.
the graph is a s follows.
1. this is the first time the code is run to predict the fval and x and y values.
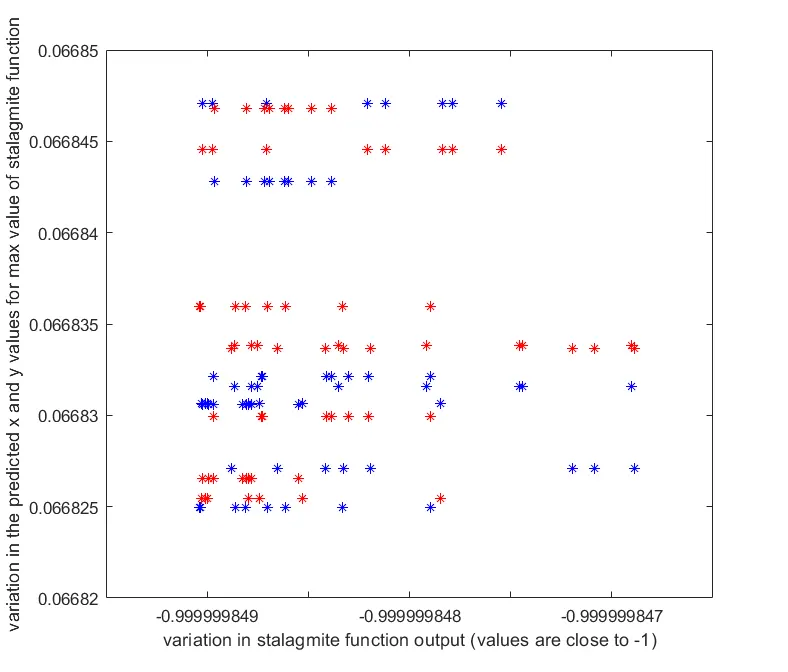
2. this is the second time the code is run to predict the fval and x and y values.
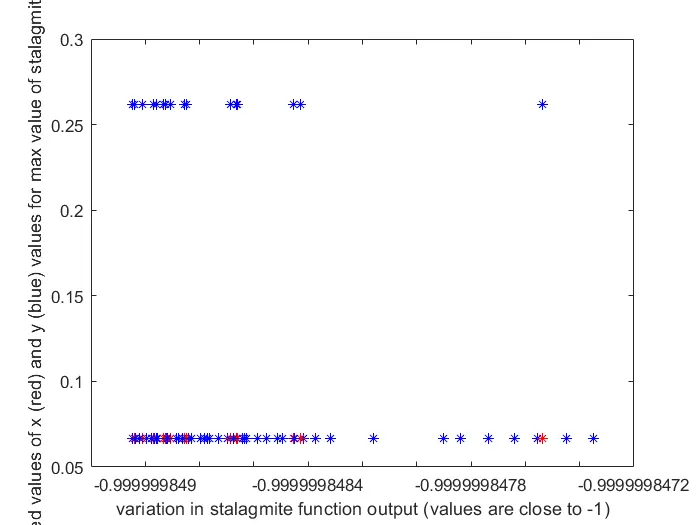
3. this is the third time the code is run to predict the fval and x and y values.
the errors encountered were:
1. not enough input arguments, invalid expression, syntax error using stalagmite function. solved by mentioning proper syntax and variables. refer code for stalagmite function to get the correct code.
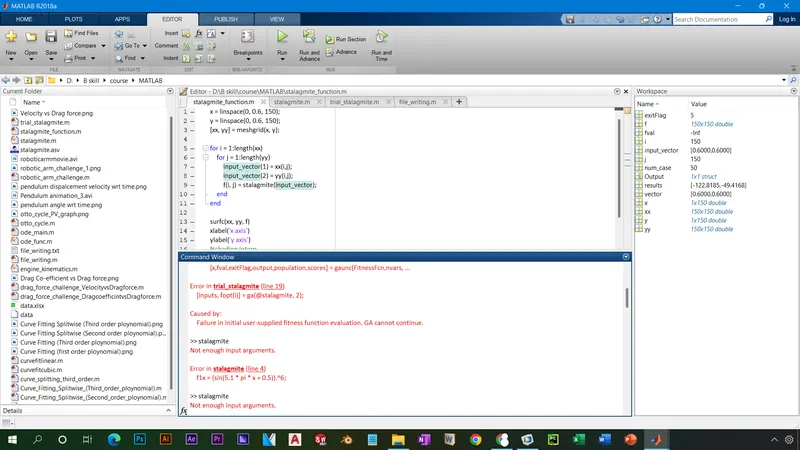
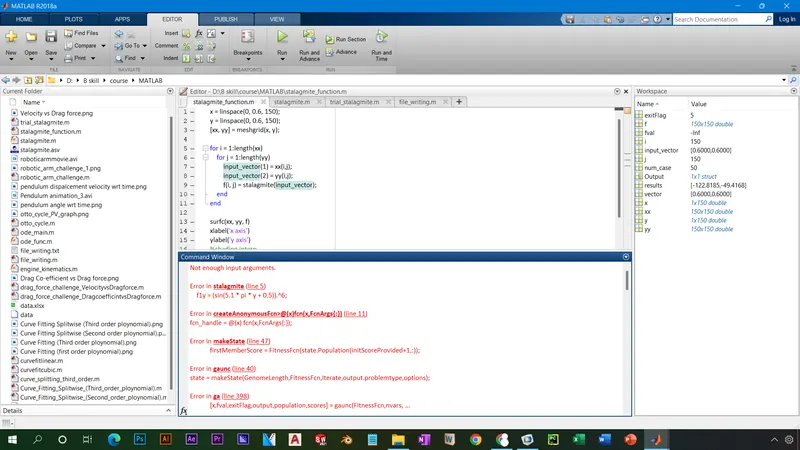
2. invalid expression, error using genetic algorithm code and syntax. refer the final code for correctness.
we should run multiple iterations to make sure the answer remains a particular value or at least a close value to the actual answer. since we are using the genetic algorithm which predicts the values rather than calculate directly, having more sample size helps and more iterations black out the possibility of a wrong answer. the answer is more reliable as a result.
the algorithm should stop once the whole sample space is covered.
MATLAB help section was used to research about the syntax and code help.
this link was useful.