Week 3 - Solving second order ODEs
Youtube link:
% input
% consider a ball of mass m is attachced at the end of string of length l to
% form a pendulum
b = 0.05; % damping constant
g = 9.81; % gravitational constant (m/s^2)
l = 1;% length of the wire to which ball is attached (m)
m = 1;% mass of the attached ball (kg)

% initial condition
theta_0 = [0;3];  % 0 is for initial position and 5 is for initial velocity towards right

% time points
t_span = linspace(0,20,700); % time span noted. time starts from 0 seconds and ends at 15 seconds having 700 intervals in between

% ODE solver
[t, results] = ode45(@(t , theta) ode_func(t, theta, b, g, l, m), t_span, theta_0); % initial condition, time array, integration consitions provided here
% the output are two column matrix having 700 values. first column
% represents the displacement from the initial position 0. the second
% column gives the values of velocity at each of the 700 points plotted.
% the angle traveled is measured from a fixed point (0,0) and the line l.

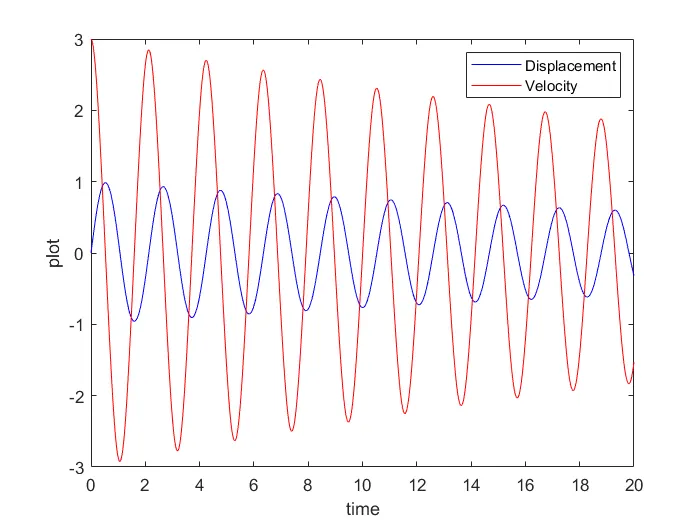
figure(1)
plot(t, results(:,1), 'color', 'b') % plot of time vs theta (displacement)
hold on
plot(t, results(:,2), 'color', 'r') % plot of time vs dtheta_dt (velocity)
ylabel('plot')
xlabel('time in seconds')
legend('Displacement','Velocity')

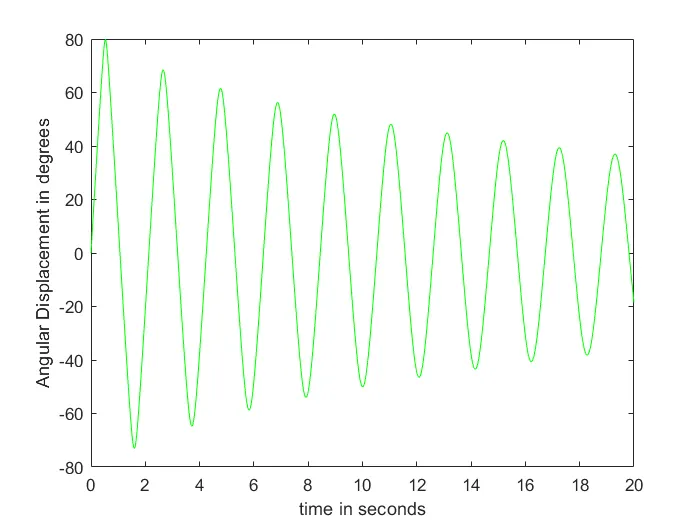
angle_travel = asind(results(:,1)/l); % formula of angle travel according to geometry
figure(2)
plot(t, angle_travel, 'color', 'g') % plot of time vs angle travel
ylabel('Angular Displacement in degrees')
xlabel('time in seconds')

vertical_length = -1 * (l * cosd(angle_travel)); % formula of vertical length according to geometry
figure(3)
plot(t, vertical_length, 'color', 'b') % plot of time vs vertical_length
ylabel('Vertical Length in meters')
xlabel('time in seconds')

figure(4)
ct = 1; % couter to opdate the frames in movie
for i = 1 : 700

    plot([0 results(i)], [0 vertical_length(i)],'linewidth',1,'color','g') % this is the pendulum string shown% we want ot show the line joining the fixed points to the sphere at the
    % end, so this plot function is written.
    hold on
    j = 1;
    while j < 701

        plot(results(i), vertical_length(i),'ro','linewidth',10,'Markersize',10) % horizontal and vertical measures are input to plot a graph of motion of pendulum

        j = j + 1;

        break
    end
    % this for and while loop is used so that both the plots can be drawn a the same time

    ylabel('vertical displacement of pendulum in meters')
    xlabel('horizontal displacement of pendulum in meters')
    title('Pendulum animation')
    axis([-1.2 1.2 -1.2 0]) % axis is fixed
    pause(0.03)
    hold off
    M(ct) = getframe(gcf); % frames are stored in M
    ct = ct + 1; % counter is updated after saving each frame

end

movie(M) % movie is generated
videofile = VideoWriter('Pendulum animation_3.avi','Uncompressed AVI'); % videofile is named and quality is decided
open(videofile) % videofile is opened
writeVideo(videofile, M) % videofile is written
close(videofile) % videofile is closed
Coding logic:
1. Inputs are taken and saved. b, g, l, m, time (20 sec).
2. Initial position and initial velocity is defined.
3. Time is divided into 700 intervals.
4. ODE45 is in-built solver in MATLAB. Dependent and independent variables are given. Initial conditions, time array is fed into this function and integrated. time and theta are inputs to this function. then ODE function is called inside it. it returns two column matrices, one is displacement and the other is velocity.
5. displacement and velocity is plotted with respect to time.
6. angle of travel and vertical length is also plotted with respect to time.
7. we want to join a line from (0,0) to the end of the string and sphere which will travel for 700 times each.
8. the movement of sphere (pendulum) is governed by the points we get in column matrix as output from ODE45 function. Axis is set for the graph.
9. Movie is made. Videofile is named, opened, written and closed.
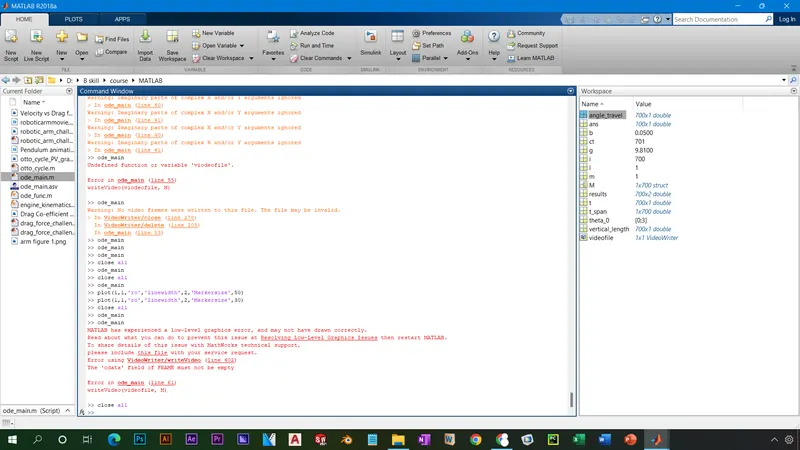
errors faced while programming:
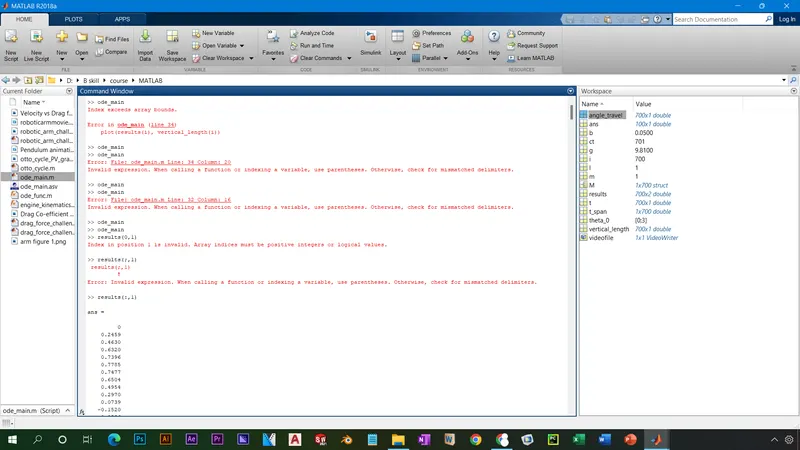
Index exceeds array bounds. plot(results(i), vertical_length(i)) was wrongly written. plot(results(1), vertical_length(1),'*') is correctly written.
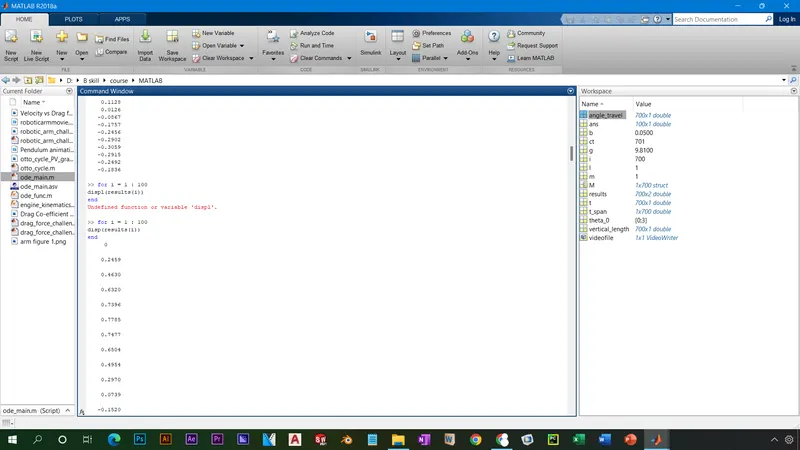
Undefined function or variable 'displ'. correct is disp().
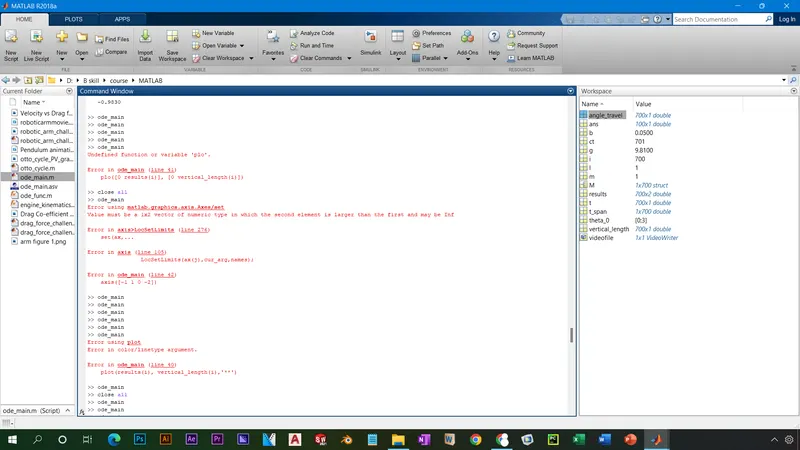
Undefined function or variable 'plo'.. correct is plot().