Week 6 - Data analysis
Aim: write a python code for Data analysis of engine data.
Objective:
- Your script should take column numbers as the input and plot the respective columns as separate images
- Each file should be saved by the name of the column
- The plot labels should be extracted from the file. If I request a plot between column 1 (crank angle) and column 8(volume), then the label information should automatically be extracted and must appear as labels in the plots. THIS SHOULD NOT BE DONE MANUALLY
- code should exit gracefully if a non-compatible file is provided as an input. It should say something like "File not recognized. Please provide a valid CONVERGE output file"
- Calculate the area under the P-V diagram. P is in column 2 and V is in column 8.
- Calculate the power output of this engine. Assume that RPM is 1500
- This engine consumed 20 micrograms of fuel (per 1-stroke cycle). Calculate its specific fuel consumption.
Theory:
Data analysis is a process of inspecting, cleansing, transforming, and modeling data with the goal of discovering useful information, informing conclusions, and supporting decision-making. Data analysis has multiple facets and approaches, encompassing diverse techniques under a variety of names, and is used in different business, science, and social science domains. In today's business world, data analysis plays a role in making decisions more scientific and helping businesses operate more effectively.
Thermodynamic data collected from the simulation of a port fuel-injected engine is extracted and analyzed from a data file using a Python program. This data file consists of 17 columns of different thermodynamic properties for which more than 8000 values have been recorded.
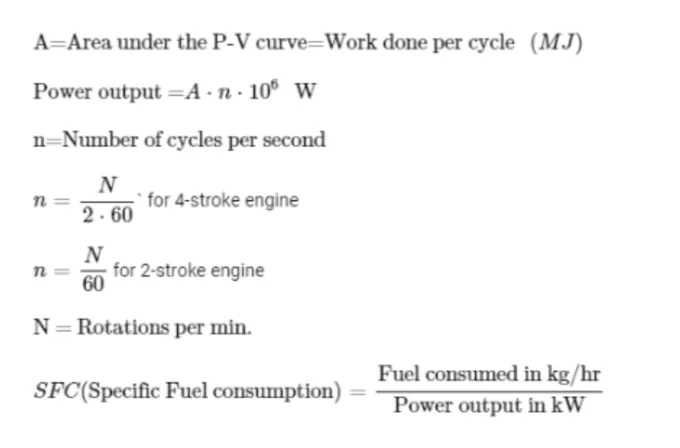
From the data file, we can understand that it is a 4-Stroke otto cycle. So, we will apply the following formula to calculate the work done, Power output, and Specific fuel consumption –
Python code:
import math;
import matplotlib.pyplot as plt;
import numpy as np;
import glob;
from tabulate import tabulate;
from scipy.integrate import simps

# take input file from user
File = input("Please Enter file name with extension (.out) :");

# take all out files from directory
all_files = glob.glob("*.out")

# initialize file data
fileData = "";

#check file present in directory and file extension check
if File in all_files and File.endswith('.out'):
	fileData = open(File)

else:
	print('File not recognized. Please provide a valid CONVERGE output file')

if fileData != "":
	# to store required value to plot
	titles = []
	value_1 = []
	value_2 = []
	column_count = 0

	#  to calculate work done from p-V curve
	pressure = []
	volume = []

	# seprating header and column data
	for line in fileData:
		if '#' in line:
			# triming of unwanted words
			trimmed = line.lstrip('# column')
			# split the line into array
			line_arr = trimmed.split();
			# removing blank array from array
			if  len(line_arr) != 0:
				# append line data
				titles.append(line_arr)

		if '#' not in line:
			column_count = column_count+1

			if column_count == 1:
				s_num = titles[1]
				parameters = titles[2]
				units = titles[3]

				# tabulate header data
				headers  = ['Column No',"Parameters","Units"];
				data = tuple(zip(s_num,parameters,units));
				print(tabulate(data,headers = headers)+"\n")

				#taking input from user
				a = int(input('Enter column no of 1st parameter(x axis):'))
				b = int(input('Enter column no of 2nd parameter(y axis):'))


			value_1.append(float(line.split()[a-1]));
			value_2.append(float(line.split()[b-1]));
			pressure.append(float(line.split()[1]));
			volume.append(float(line.split()[7]));

	# to generate labels automatically for plots
	x_label = parameters[a-1]
	y_label = parameters[b-1]

	# calculate area under p-V diagram
	Area = simps(pressure,volume)
	print('Area of p-V curve : ' +str(Area)+' MN-m');
	print('work done by engine : ' +str(Area*1e6) +" N-m Or Joule \n" );

	# calculate power output of engine
	rpm = int(input('Enter the engine RPM :'))
	rps = rpm/60

	# No of power strokes in revolution of crank shaft
	Power_strokes = rps/2
	power = (Area*1e6)*Power_strokes/1000
	print('Power output of engine is : ' +str(power)+ " kW \n");

	# To calculate specific fuel consuption
	r = int(input('Enter Specific fuel consumption per in kg :'))
	sfc = (r/power)*3600;
	print('specific fuel consuption of the engine : '+str(sfc)+" kg/KWhr \n")

	# plotting the data
	plt.plot(value_1,value_2,linewidth=3)
	plt.title(y_label+" Vs "+x_label)
	plt.xlabel(x_label)
	plt.ylabel(y_label)
	plt.grid()
	plt.savefig(y_label+" Vs "+x_label)
	plt.show()
Conclusion and Results:
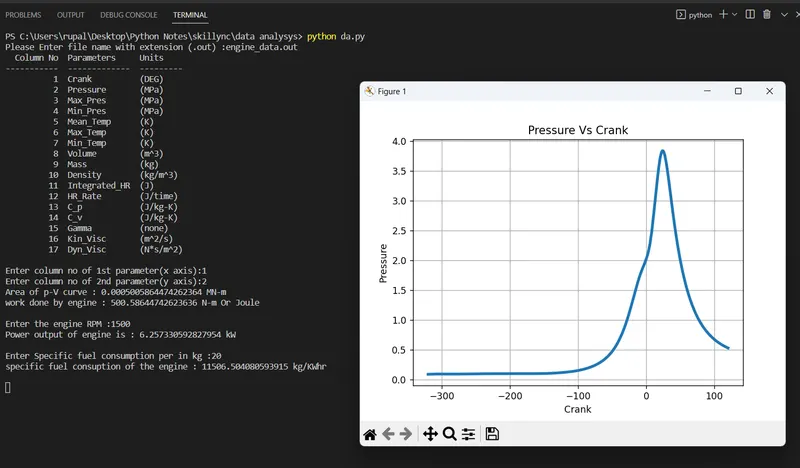
Result and Plotting Between Pressure and Volume
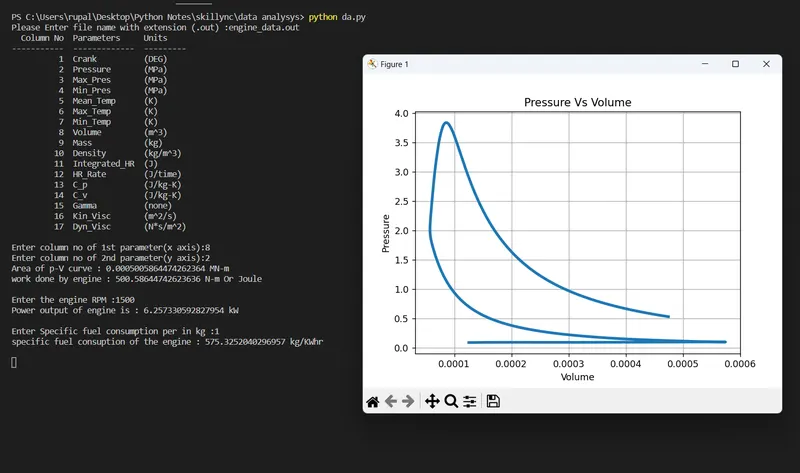
Result and Plotting Between Pressure and crank