Week 4.1 - Genetic Algorithm
DETAILED REPORT:
AIM:
- Write a code in MATLAB to optimise the stalagmite function and find the global maxima of the function.
- Clearly explain the concept of genetic algorithm in your own words and also explain the syntax for ga in MATLAB in your report.
- Make sure that your code gives the same output, even if it is made to run several times.
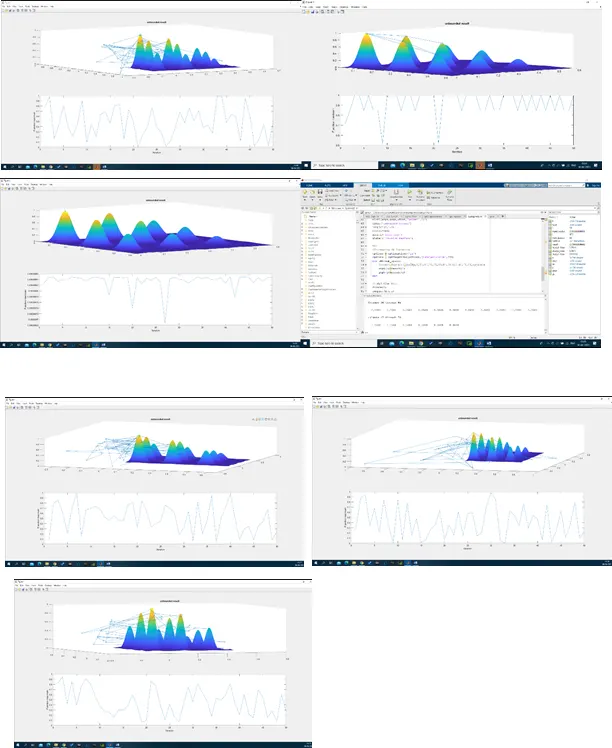
- Plot graphs for all 3 studies and for F maximum vs no. of iterations. Title and axes labels are a must, legends could be shown if necessary.
GOVERNING EQUATIONS :
OBJECTIVES OF THE PROJECT:
- optimise the stalagmite function and find the global maxima of the function.
- concept of genetic algorithm in your own words and also explain the syntax for ga in MATLAB .
- Plot graphs for all 3 studies and for F maximum vs no. of iterations.
THEORY:
What are Genetic Algorithms?
Nature has always been a great source of inspiration to all mankind. Genetic Algorithms (GAs) are search based algorithms based on the concepts of natural selection and genetics. GAs are a subset of a much larger branch of computation known as Evolutionary Computation. GAs were developed by John Holland and his students and colleagues at the University of Michigan, most notably David E. Goldberg and has since been tried on various optimization problems with a high degree of success.
Genetic Algorithm (GA) is a search-based optimization technique based on the principles of Genetics and Natural Selection. It is frequently used to find optimal or near-optimal solutions to difficult problems which otherwise would take a lifetime to solve. It is frequently used to solve optimization problems, in research, and in machine learning.
Optimization is the process of making something better. In any process.
APPLICATION USED :
Matlab
CODE FOR CALCULATION AND EXPLANATION (curve_fit.m) :
%To write a MATLAB code to optimise the stalagmite function and find the
%global maxima of the function.
clear all
close all
clc
%define our search space
x=linspace(0,0.6,150);
y=linspace(0,0.6,150);
%we consider no of iteration num_spaces 50.
num_spaces = 50;
% creating a 2Dimensional mesh
[xx,yy]=meshgrid(x,y);
%evaluating the stalagmite function
for i=1:length(x)
for j=1:length(y)
input_vector(1)=xx(i,j);
input_vector(2)=yy(i,j);
%fetch data from function file
f(i,j)=fp(input_vector);
end
end
tic
% here ga is initiatedwith random population
for i=1:num_spaces
[result,fopt(i)]=ga(@fp,2);
xopt(i)=result(1);
yopt(i)=result(2);
end
study1_time=toc;
figure(1)
subplot(2,1,1)
surface(x,y,-f)
shading interp
hold on
plot3(xopt,yopt,-fopt,'marker','o')
title('unbounded result')
subplot(2,1,2)
plot(-fopt)
xlabel('Iteration')
ylabel('Function maximum')
tic
%bounded with upper and lower bounds
for i=1:num_spaces
[result,fopt(i)]=ga(@fp,2,[],[],[],[],[0;0],[1;1],[],[]);
xopt(i)=result(1);
yopt(i)=result(2);
end
study2_time=toc;
figure(2)
subplot(2,1,1)
surface(x,y,-f)
shading interp
hold on
plot3(xopt,yopt,-fopt,'marker','o')
title('unbounded result')
subplot(2,1,2)
plot(-fopt)
xlabel('Iteration')
ylabel('Function maximum')
tic
%Increasing GA Iteration
options = optimoptions('ga')
options = optimoptions(options,'populationsize',250)
for i=1:num_spaces
[result,fopt(i)]=ga(@fp,2,[],[],[],[],[0;0],[0.6;0.6],[],[],options)
xopt(i)=result(1)
yopt(i)=result(2)
end
study3_time=toc;
figure(3)
subplot(2,1,1)
surface(x,y,-f)
shading interp
hold on
plot3(xopt,yopt,-fopt,'marker','o')
title('unbounded result')
subplot(2,1,2)
plot(-fopt)
xlabel('Iteration')
ylabel('Function maximum')
Function used in file à>>> fp.m
%Code containing stalagmite function
function A=fp(input_vector)
x=input_vector(1);
y=input_vector(2);
a=(sin(5.1*pi*x+0.5)).^6;
b=exp((-4)*log(2)*((x-0.0667).^2)/0.64);
c=(sin(5.1*pi.*y+0.5)).^6;
d=exp((-4*log(2))*((y-0.0667).^2)/0.64);
A= -(a*b*c*d);
end
5.OUTPUT : Graphs for all 3 studies and for F maximum vs no. of iterations are as follow: