Project 1 - Parsing NASA thermodynamic data
DETAILED REPORT:
AIM:
- Write a function that extracts the 14 co-efficients and calculates the enthalpy, entropy and specific heats for all the species in the data file. You will be reading this file NASA thermodynamic data(Tip:use fopen and fgetl).
- Calculate the molecular weight of each species and display it in the command window.
- Plot the Cp, Enthalpy and Entropy for the local temperature range (low temperature : high temperature) specific for each species.
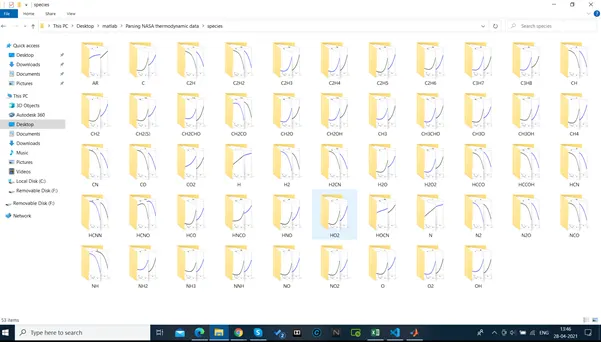
- Save the plots as images with appropriate names and dump them in separate folders for each species with suitable name. All these should be generated automatically.
- The main program that you will submit will just take the "THERMO.dat" file as an input and generate Cp, H and S plots.
- Please write a detailed report to describe your logic.
GOVERNING EQUATIONS :
OBJECTIVE:
1.To Extract all the coefficient of the species mentioned in the data file and calculate their parameters like enthalpy , entropy, and specific heat.
- To Plot the variation of these parameter for the specified local temperature range.
- To determine the molecular masses of the individual species mentioned in the data file.
THEORY:
Specific Heat : Specific heat, ratio of the quantity of heat required to raise the temperature of a body one degree to that required to raise the temperature of an equal mass of water one degree.
Enthalpy : Enthalpy, the sum of the internal energy and the product of the pressure and volume of a thermodynamic system. ... In symbols, the enthalpy, H, equals the sum of the internal energy, E, and the product of the pressure, P, and volume, V, of the system: H = E + PV.
Entropy: Entropy, the measure of a system's thermal energy per unit temperature that is unavailable for doing useful work. Because work is obtained from ordered molecular motion, the amount of entropy is also a measure of the molecular disorder, or randomness, of a system.
APPLICATION USED :
Matlab
Code for calculation and explanation (Parsing_NASA_thermodynamicdata.m) :
close all
clear all
clc
% opening file (parameter_file and read)
file=fopen('THERMO.dat','r')
%we use line 1 as heading
line1 = fgetl(file);
%line 2 as Temperature values
line2 = fgetl(file);
%next 3 lines are comments
des_1 = fgetl(file);
des_2 = fgetl(file);
des_3 = fgetl(file);
A = strsplit(line2,' ');
Global_low_Temperature = str2num(A{2});
Global_med_Temperature = str2num(A{3});
Global_high_Temperature = str2num(A{4});
%specific information
for i=1:53
species = fgetl(file);
species_name = species(1:6)
line_1 = fgetl(file);
l1 = strfind(line_1,'E');
c1 = str2num(line_1(1:(l1(1)+3)));
c2 = str2num(line_1((l1(1)+4):(l1(2)+3)));
c3 = str2num(line_1((l1(2)+4):(l1(3)+3)));
c4 = str2num(line_1((l1(3)+4):(l1(4)+3)));
c5 = str2num(line_1((l1(4)+4):(l1(5)+3)));
line_2 = fgetl(file);
l2 = strfind(line_2,'E');
c6 = str2num(line_2(1:(l2(1)+3)));
c7 = str2num(line_2((l2(1)+4):(l2(2)+3)));
c8 = str2num(line_2((l2(2)+4):(l2(3)+3)));
c9 = str2num(line_2((l2(3)+4):(l2(4)+3)));
c10 = str2num(line_2((l2(4)+4):(l2(5)+3)));
line_3 = fgetl(file);
l3 = strfind(line_3,'E');
c11 = str2num(line_3(1:(l3(1)+3)));
c12 = str2num(line_3((l3(1)+4):(l3(2)+3)));
c13 = str2num(line_3((l3(2)+4):(l3(3)+3)));
c14 = str2num(line_3((l3(3)+4):(l3(4)+3)));
%creating folder for each species
mkdir(['C:\Users\rupal\Desktop\matlab\Parsing NASA thermodynamic data\species\',species_name]);
%Temperature ranges assemed for calculation purpose
Temperature = linspace(300,5000,100);
%universal gas constant
R = 8.314;
%calculation of properties based on the lower and upper Temperature
for j = 1:length(Temperature)
if Temperature(j)<3000
Cp = (c1+c2.*Temperature+c3.*Temperature.^2+c4.*Temperature.^3+c5.*Temperature.^4).*R;
H = (c1+(c2.*Temperature)./2+(c3.*Temperature.^2)/3+(c4.*Temperature.^3)/4+(c5.*Temperature.^4/5)+c6./Temperature).*Temperature.*R;
S = (c1*log(Temperature)+c2.*Temperature+(c3.*Temperature.^2)/2+(c4.*Temperature.^3)/3+(c5.*Temperature.^4)/4+c7).*R;
else
Cp = (c8+c9.*Temperature+c10.*Temperature.^2+c11.*Temperature.^3+c12.*Temperature.^4).*R;
H = (c8+(c9.*Temperature)/2+(c10.*Temperature.^2)/3+(c11.*Temperature.^3)/4+(c12.*Temperature.^4/5)+c13./Temperature).*Temperature.*R;
S = (c8.*log(Temperature)+c9.*Temperature+(c10.*Temperature.^2)/2+(c11.*Temperature.^3)/3+(c12.*Temperature.^4)/4+c14).*R;
end
end
%plotting
%Temperature vs entropy
figure(1)
plot(Temperature,S,'linewidth',4,'color','b')
title(species_name)
xlabel('Temperature')
ylabel('entropy')
%Temperature vs enthalpy
figure(2)
plot(Temperature,H,'linewidth',4,'color','k')
title(species_name)
xlabel('Temperature')
ylabel('enthalpy')
%Temperature vs specific heat
figure(3)
plot(Temperature,Cp,'linewidth',4,'color','y')
title(species_name)
xlabel('Temperature')
ylabel('specific heat')
directory=(['C:\Users\rupal\Desktop\matlab\Parsing NASA thermodynamic data\species\',species_name]);
cd(directory)
%saving the plots
saveas(1,'entropy.jpg');
saveas(2,'enthalpy.jpg');
saveas(1,'specific heat.jpg');
%here we switch the directory
cd('C:\Users\rupal\Desktop\matlab\Parsing NASA thermodynamic data\')
MM = molecular_mass(species_name)
end
fclose(file)
Here function molecular_mass.m
function MM = molecular_mass(species_name)
species = upper(species_name);
constituents = ['H','C','N','O','A'];
Atomic_weight = [1.00794 12.0107 14.006 15.9994 39.948];
MM = 0;
for i=1:length(species)
for j=1:length(constituents)
if strcmp(species(i),constituents(j))
MM = MM + Atomic_weight(j);
u = j;
end
end
n = str2num(species(i));
if n>1
MM=MM + Atomic_weight(u)*(n-1);
end
end
end
5.CONCLUSION:
Location of folder
Molecular masses : please find attachted file:
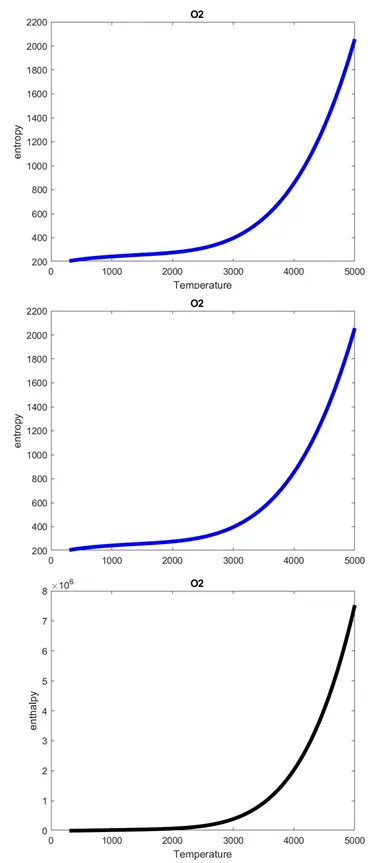
Plots for O2
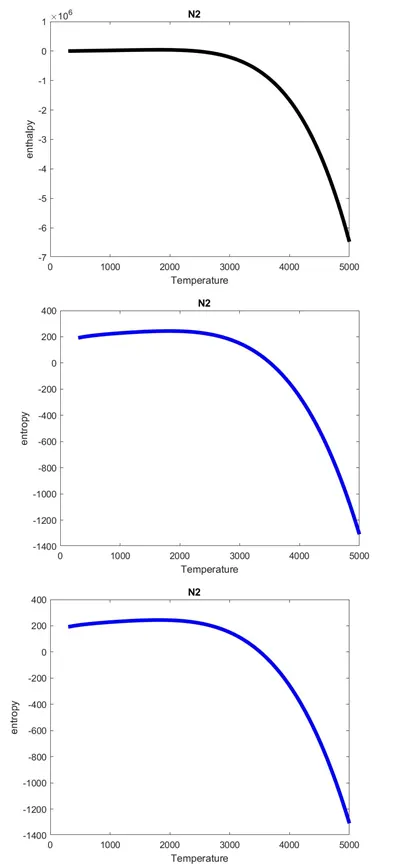
Plots for N2
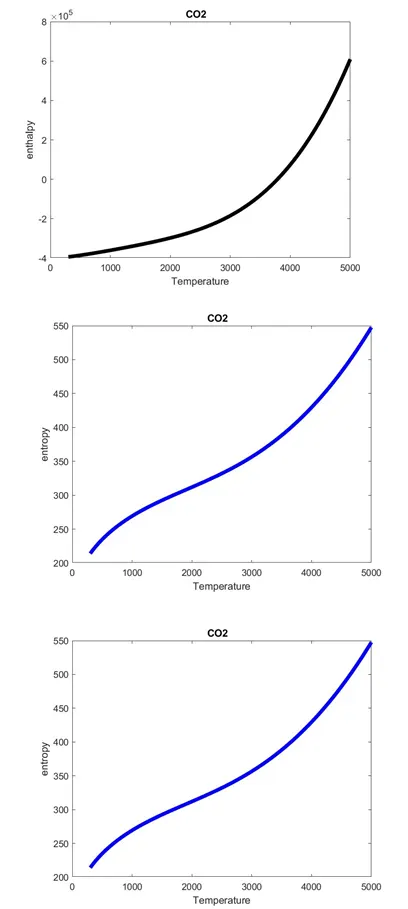
Plots for CO2