Week 6 - Data analysis
Objective:
- Script should take column numbers as the input and plot the respective columns as separate images
- Each file should be saved by the name of the column
- The plot labels should be extracted from the file.
Procedure:
#importing modules
import matplotlib.pyplot as plt
import numpy as np

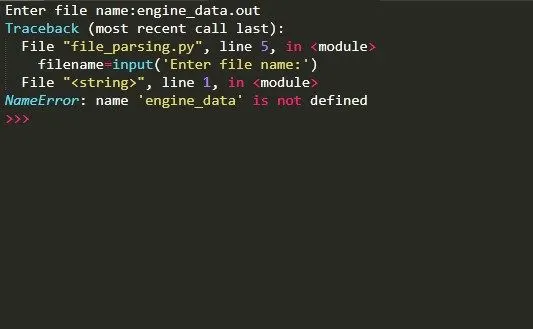
filename=input('Enter file name:')
if filename=='engine_data.out':
	print('file found successfully')
else:
	print('file not recognized')
	exit()

data=[]
for line in open(filename):
	if '#' in line:
		data.append(line.split())
	print(data)

#no of columns
nc=len(data[1])

#column numbers
cno=[]
#column name
cname=[]
#column units
cunit=[]

for i in data[1]:
	if i is not '#':
		cno.append(i)

for i in data[2]:
	if i is not '#':
		cname.append(i)

for i in data[3]:
	if i is not '#':
		cunit.append(i)

print('COLUMN NO','    ','PARAMETER')

for i in range(0,len(cno)):
	print(cno[i],'    --   ',cname[i],cunit[i])

#taking user input for plot
xaxis=int(input('Enter parameter (x-axis) column no:'))
yaxis=int(input('Enter parameter (yaxis) column no:'))


x=[]
y=[]

for line in open(filename):
	if '#' not in line:
		x.append(float(line.split()[xaxis-1]))
		y.append(float(line.split()[yaxis-1]))


#Plotting
plt.plot(x,y,linewidth=3)
plt.xlabel(cname[xaxis-1]+cunit[xaxis-1])
plt.ylabel(cname[yaxis-1]+cunit[yaxis-1])
plt.title(cname[yaxis-1]+cname[xaxis-1])
plt.show()
Errors observed: