Week 5 - Curve fitting
1. What does popt and pcov mean?
- The output of the curve_fit function is stored to popt and pcov.
- popt get the optimized values of coefficients for the fitting function.
- pcov will have the convariance matrix which indicates how far the data points are spread from the average value. Or this matrix contains the variance and covariance of the parameters.
2. What does np.array(temperature) do?
numpy is an array processing package that we call 'np' for our convenience. With this command line, we are creating an array to store temperature values.
3. What does the * in *popt mean?
* indicates the list of values popt has and helps to transfer those values to the arguments of the function.
Here we are having optimized values of coefficients a,b,c. *popt refers to those values.
4. Write code to fit a linear and cubic polynomial for the Cp data. Explain if your results are good or bad.
Objective:
Write code to fit a linear and cubic polynomial for the Cp data. Explain if your results are good or bad.
Problem statement:
A file called 'data' contains values for temperature and corresponding cp. Here we need to write a code that:
- Read the data values in the file
- Do cure fitting for the data values
Solution procedure:
import math
import matplotlib.pyplot as plt
import numpy as np
from scipy.optimize import curve_fit

#Cubic function
def cubic_func(t,a,b,c):
	return a*pow(t,3)+b*pow(t,2)+c*t

#linear function
def linear_func(t,a,b):
	return a*t+b

def read_file():
	#creating array for storing temperature and cp values
	temperature=[]
	cp=[]

	#read line by line after opening file named 'data' r represents read mode.
	for line in open('data','r'):
	#split the line with comma operator as each line has two values. Where ever in a line 'comma' comes this command consider it as aspliter
		values=line.split(',')
		temperature.append(float(values[0]))
		cp.append(float(values[1]))
	return [temperature,cp]

#main program
temperature,cp=read_file()
popt,pcov = curve_fit(cubic_func,temperature,cp)

fit_cp1=cubic_func(np.array(temperature),*popt)

plt.plot(temperature,cp,color="blue",linewidth=3)
plt.plot(temperature,fit_cp1,color="red",linewidth=3)


popt,pcov=curve_fit(linear_func,temperature,cp)
fit_cp2=linear_func(np.array(temperature),*popt)
plt.plot(temperature,fit_cp2,color="green",linewidth=3)

plt.legend(['Actual data','Cubic Curve fit','Linear curve fit'])
plt.xlabel('temperature[K]')
plt.ylabel('cp')
plt.show()
Results:
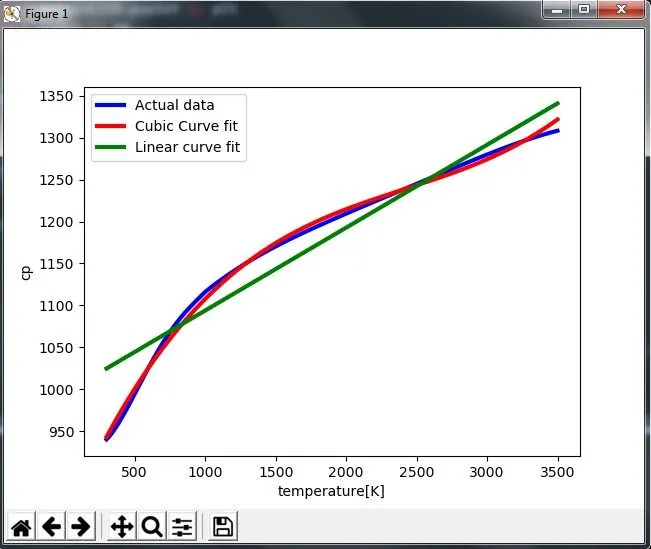
Discussion:
Here it is clear that the cubic function fits the data points better than other functions.
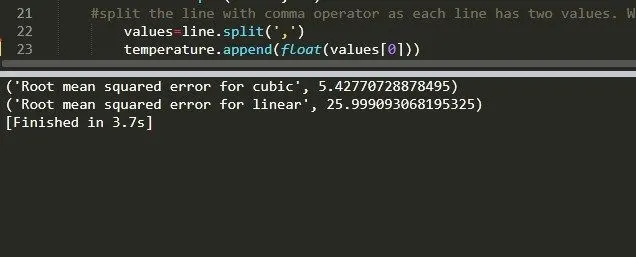
Root mean squared error was calculated.