Project 1 - Parsing NASA thermodynamic data
AIM:
1. Write a function that extracts the 14 co-efficients and calculates the enthalpy, entropy and specific heats for all the species in the data file.
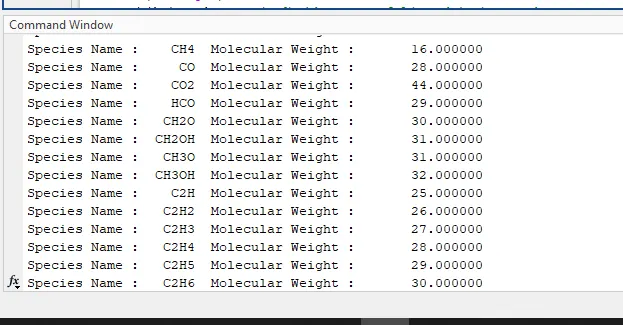
2. Calculate the molecular weight of each species.
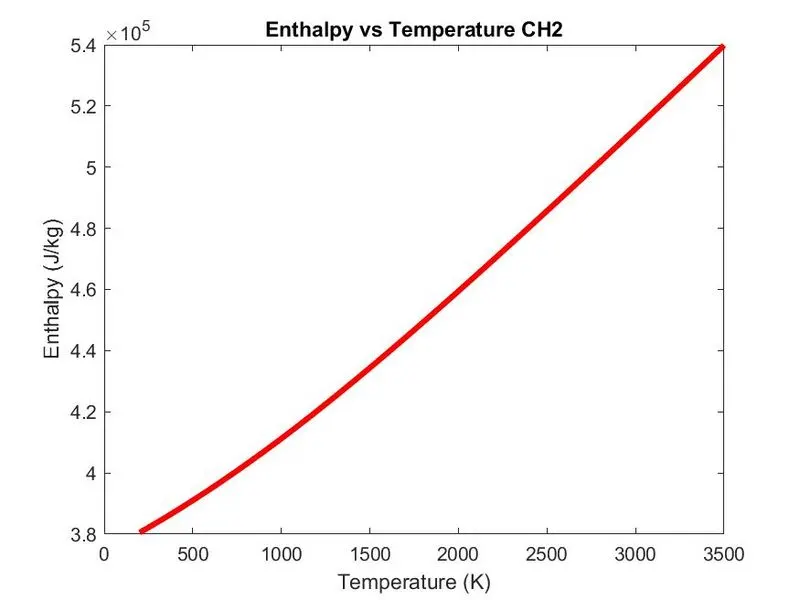
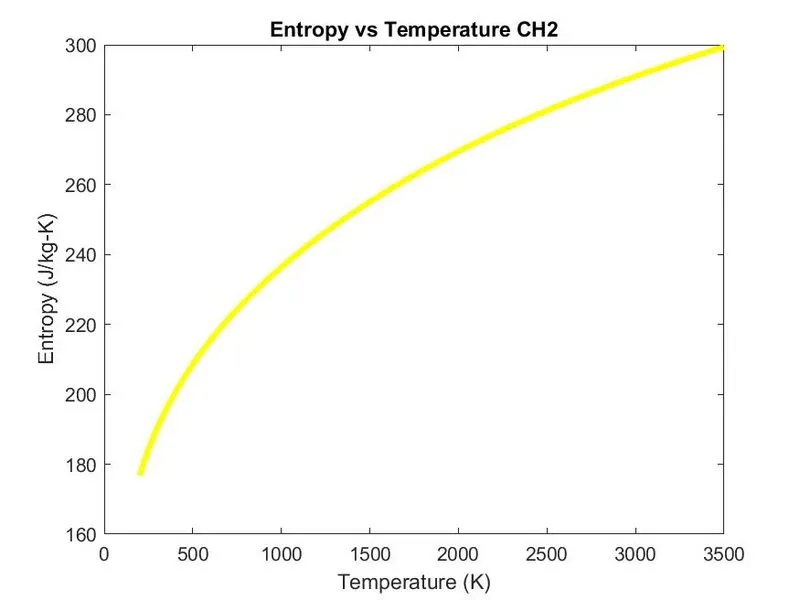
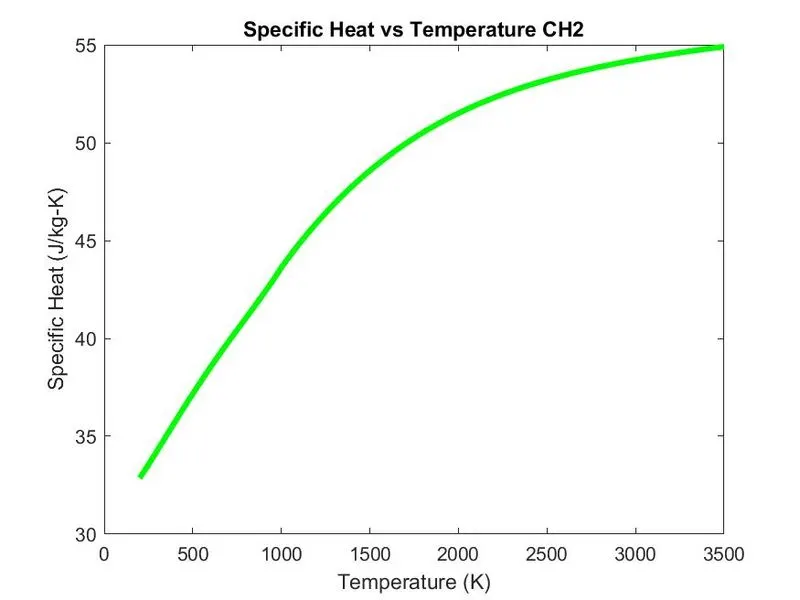
3. Plot the Cp, Enthalpy and Entropy for the local temperature range for each species.
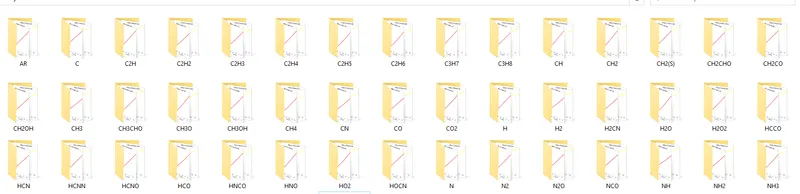
4. Save the plots as images with appropriate names and dump them in separate folders for each species with suitable name.
PROCEDURE:
clear all
close all
clc

R=8.134; %gas constant

f1=fopen('THERMO.DAT','r'); %reading the file

%extracting header values and global temperature values using fgetl
header=fgetl(f1);
globaltemperatureranges=fgetl(f1);
a=strsplit(globaltemperatureranges,' ');
lowglobaltemperature=str2double(a{2});
midglobaltemperature=str2double(a{3});
highglobaltemperature=str2double(a{4});

%ignoring initial three lines of the data file
%fgetl function will be at 4th line
for g=1:3
    ignore=fgetl(f1);
end

%running a loop till END of the data file
for k=1:Inf


localtemperaturevalues=fgetl(f1);

b=strsplit(localtemperaturevalues,' ');
if b{1}=="END"
     break
 end

%extracting local temperature values
lowlocaltemperature=str2double(b{end-3});
midlocaltemperature=str2double(b{end-1});
highlocaltemperature=str2double(b{end-2});

temperature_range=linspace(lowlocaltemperature,highlocaltemperature,200);


species_name=b{1};

%extracting the coefficient lines
firstcoefficientline=fgetl(f1);
secondcoefficientline=fgetl(f1);
thirdcoefficientline=fgetl(f1);

%finding the position of coefficients by locating 'E'
x=findstr(firstcoefficientline,'E');

%obtaining the exact value of coefficient
c1=str2double(firstcoefficientline(1:x(1)+3));
c2=str2double(firstcoefficientline(x(1)+4:x(2)+3));
c3=str2double(firstcoefficientline(x(2)+4:x(3)+3));
c4=str2double(firstcoefficientline(x(3)+4:x(4)+3));
c5=str2double(firstcoefficientline(x(4)+4:x(5)+3));


%finding the position of coefficients in second line by locating 'E'
y=findstr(secondcoefficientline,'E');

%obtaining the exact value of coefficient
c6=str2double(secondcoefficientline(1:y(1)+3));
c7=str2double(secondcoefficientline(y(1)+4:y(2)+3));
c8=str2double(secondcoefficientline(y(2)+4:y(3)+3));
c9=str2double(secondcoefficientline(y(3)+4:y(4)+3));
c10=str2double(secondcoefficientline(y(4)+4:y(5)+3));

%finding the position of coefficients in third line by locating 'E'
z=findstr(thirdcoefficientline,'E');

%obtaining the exact value of coefficient
c11=str2double(thirdcoefficientline(1:z(1)+3));
c12=str2double(thirdcoefficientline(z(1)+4:z(2)+3));
c13=str2double(thirdcoefficientline(z(2)+4:z(3)+3));
c14=str2double(thirdcoefficientline(z(3)+4:z(4)+3));

[cp h s] = thermodynamic_properties(c1,c2,c3,c4,c5,c6,c7,c8,c9,c10,c11,c12,c13,c14,R,temperature_range,midglobaltemperature);

element={'O','C','H','A','N'};
atomic_mass=[16,12,1,40,14];  %atomic mass for each elements

mol_wt=0;

for m = 1:length(species_name)

     for q =1:length(element)
     if strcmp(species_name(m),element(q))==1  %compairing the species name with element
        mol_wt = mol_wt+atomic_mass(q);


            flag = q;
     end
     end

     n = str2double(species_name(m));            %if eg:-O it cannot be converted to numeric so the func returns NaN
                                          %and NaN cannot be counted as
                                     %integer and if the loop reaches at 2

     if n>1
     mol_wt = mol_wt + (atomic_mass(flag)*(n-1));  %Atomic mass is multiplied by (n-1)=(2-1) and added to current molecular wt
     end

end


%plotting each figures

figure(1);
plot(temperature_range,cp,'linewidth',3,'color','g');
xlabel('Temperature (K)');
ylabel('Specific Heat (J/kg-K)');
title(['Specific Heat vs Temperature ',species_name]);


 figure(2);
 plot(temperature_range,h,'linewidth',3,'color','r');
 xlabel('Temperature (K)');
 ylabel('Enthalpy (J/kg)');
 title(['Enthalpy vs Temperature ',species_name]);

 figure(3) ;
 plot(temperature_range,s,'linewidth',3,'color','y');
 xlabel('Temperature (K)');
 ylabel('Entropy (J/kg-K)');
 title(['Entropy vs Temperature ',species_name]);

 % Printing Molecular Weight of each species in Command Window
    fprintf ('Species Name : %6s  ',species_name)
    fprintf ('Molecular Weight : %15f \n',mol_wt)


    cd('D:\Dijo');
    mkdir(species_name); %making a new folder with the species name
    cd(species_name);

    % Saving as .jpg file in the folder
    saveas(figure(1),'specific_heat_vs_Temp.jpg');
    saveas(figure(2),'enthalpy_vs_Temp.jpg');
    saveas(figure(3),'entropy_vs_Temp.jpg');


    cd ('C:\Users\Skill_Lync\Documents\MATLAB'); %changing the directory back to program location
end

%calculate the values of cp, enthalp and entropy
% a = 1;
%
% for j = 1:3
%     firstcoefficientline=fgetl(f1)
%     x=findstr(firstcoefficientline,'E');
%     for i = 1:length(x)
%
%         c(a) = str2double(firstcoefficientline(x(i)-11:x(i)+3))
%     a = a+1;
%
%     end
% end
%
% end
Thermodynamic property function:
function[cp,h,s]=thermodynamic_properties(c1,c2,c3,c4,c5,c6,c7,c8,c9,c10,c11,c12,c13,c14,R,temperature_range,midglobaltemperature)
for t=1:length(temperature_range)
if temperature_range(t)>midglobaltemperature
    cp(t)=R*(c1+(c2*temperature_range(t))+(c3*(temperature_range(t))^2)+(c4*(temperature_range(t))^3)+(c5*(temperature_range(t)^4)));
    h(t)=R*temperature_range(t)*(c1+(c2*temperature_range(t))/(2)+(c3*(temperature_range(t))^2)/(3)+(c4*(temperature_range(t))^3)/(4)+(c5*(temperature_range(t))^4)/(5)+(c6)/(temperature_range(t)));
    s(t)=R*((c1*log(temperature_range(t)))+(c2*temperature_range(t))+(c3*(temperature_range(t))^2)/(2)+(c4*(temperature_range(t))^3)/(3)+(c5*(temperature_range(t))^4)/(4)+(c7));

    else
    cp(t)=R*(c8+(c9*(temperature_range(t))+(c10*(temperature_range(t))^2)+(c11*(temperature_range(t))^3)+(c12*(temperature_range(t))^4)));

    h(t)=R*temperature_range(t)*(c8+(c9*temperature_range(t))/(2)+(c10*(temperature_range(t))^2)/(3)+(c11*(temperature_range(t))^3)/(4)+(c12*(temperature_range(t))^4)/(5)+(c13)/(temperature_range(t)));
    s(t)=R*((c8*log(temperature_range(t)))+(c9*temperature_range(t))+(c10*(temperature_range(t))^2)/(2)+(c11*(temperature_range(t))^3)/(3)+(c12*(temperature_range(t))^4)/(4)+c14);
end
end
RESULTS: