Week 6 - Data analysis
AIM
To write script to split the data into sets of column and plots the desired graphs.
To find the area under the pressure vs volume curve and to find the power output of the engine and the specific fuel consumption.
To write the script to also check the conpatability check, if the file is not present in the working directly the script throws an error stating not recognized
Objective
To understand the practical 4 stroke Otto cycle engine using the data mentioned below by plotting the relations between various operating parameters using python software.
Solution
The Otto cycle is an ideal thermodynamic cycle which is simillar to the operating of SI (Spark Ignition) Engine. In the process 0 - 1 : Air is drawn at constant pressure.
process 1 -2 : Adiabatic (Isentropic) Compression from BDC (Bottom Dead Center) to TDC(Top dead Center)
pricess 2 - 3: Constant volume heat addition
process 3 - 4 : Adiabatic (Isentripic ) Expansion (Power Stroke)
process 4 - 1 : Constant volume heat rejection.
process 1 - 0 : mass of air is released back to the atmosphere at const presure
The practical graph of pressure vs volume curve also resembles same as the ideal process.
Formulas Used:
1. Area under the Pressure-Volume curve (MPa*m^3)= Work Done per cycle (MJ)
2. Power Output = Work Done per cycle (MJ) * n *10^6 (W)
where n = Number of Cycles per sec
3. n = N/(2*60) - for 4 Stroke Engine
N = Rotations per min (Here 1500 RPM is used)
4. Specific Fuel Comsumption (SFC)
SFC = (Fuel Consumed in kg/hr)/ (Power Output in kW)
here, for 1 stroke 2 rotations, hence here there are 750 strokes in 60 sec
1 stoke takes (60/750) sec = 0.08 sec
Mass flow rate is 20 micrograms/sec
Hence the Mass flow rate in kg = 20/(0.08) = 250*10^-6 (kg/s)
The specific fuel cunsumption = (250*10^-6) *3600/power
Python Code
import matplotlib.pyplot as plt
import math
import numpy as np
import sys

try:
	file=open('engine_data.out','r')

except:
	print('"File Not Recognized. Please provide CONVERGE output file"')
	sys.exit()

file='engine_data.out'
row_ct=0;
column_ct=0;
ct_header=0;
column_title=[]
column_unit=[]
for line in open(file,'r'):
	if '#' not in line:
		row_ct=row_ct+1
		column_ct=len(str.split(line))
	else:
		ct_header=ct_header+1
		if ct_header == 3:
			line_content=str.split(line)
			for i in range(1,len(line_content)):
				column_title.append(line_content[i])

		elif ct_header==4:
			line_content = str.split(line)
			for j in range(1,len(line_content)):
				column_unit.append(line_content[j])

print("Column 1 : Crank (Deg)\nColumn 2 : Pressure\nColumn 3 : Max_Pressure\nColumn 4 : Min_Pressure");
print("Column 5 : Mean_Temperature\nColumn 6 : Max_Temperature\nColumn 7 : Min_Temperature\nColumn 8 : Volume");
print("Column 9 : Mass\nColumn 10 : Density\nColumn 11 : Heat\nColumn 12 : Heat Rate")
print("Column 13 : Cp\nColumn 14 : Cv\nColumn 15 : Gamma\nColumn 16 : Kinematic Viscosity")
print("Column 18 : Dynamic Viscisity")

a = int(input("\nEnter the X Axis data : "))
	#a=8
	#b=2
b=int(input("\nEnter the Y Axis Data : "))
x_axis_data=[]
y_axis_data=[]

for i in open(file,'r'):
	if '#' not in i:
		x=i.split()
		x_axis_data.append(float(x[a-1]))

for i in open(file,'r'):
	if '#' not in i:
		y=i.split()
		y_axis_data.append(float(y[b-1]))

plt.figure()
plt.plot(x_axis_data,y_axis_data,linewidth=3)
plt.xlabel(column_title[a-1]+column_unit[a-1])
plt.ylabel(column_title[b-1]+column_unit[b-1])
n1 = column_title[a-1]+column_unit[a-1]
n2=" Vs "
n3 = column_title[b-1]+column_unit[b-1]
n4=n1+n2+n3
plt.title(n4)
plt.savefig(n4+'.png')
plt.show()


#Area Under Pressure-Volume Diagram
volume =[]
pressure=[]

for i in open(file,'r'):
	if '#' not in i:
		pressure.append(float(i.split()[1]))
		volume.append(float(i.split()[7]))

area=np.trapz(pressure,volume)
print("\nThe Area under P-V is ", area*pow(10,6),"J")

workdone=area*pow(10,6)
n=1500
power=n*workdone/(2*60*1000)
print("\nThe power is ",power," kW")

fuel = 20*pow(10,-6) #20 microgram of fuel per 1 stroke
# 1 Stroke - 2 rotations i.e 750 strokes in 60 sec
# 1 stroke is (60/750)sec = 0.08 sec
#Mass Flow rate is 20 micrograms/0.08 = 250 *10^-6(kg/s)
mfr=250*1e-06
#sfc=3600*fuel*n/(60*power)
sfc=mfr*3600/power
print("\nSpecific Fuel Consumption ",sfc," g/kWh")

plt.plot(volume,pressure,linewidth=3)
plt.xlabel(column_title[7]+column_unit[7])
plt.ylabel(column_title[1]+column_unit[1])
n1 = column_title[7]+column_unit[7]
n2=" Vs "
n3 = column_title[1]+column_unit[1]
n4=n1+n2+n3
plt.title(n4)
plt.show()


# Plotting Crank Angle and Volume
volume =[]
crank=[]
for line in open('engine_data.out'):
	if '#' not in line:
		crank.append(float(line.split()[0])) #First Index
		volume.append(float(line.split()[7]))


plt.figure()
plt.plot(crank,volume,linewidth=3)
plt.title('Crank Angle vs Volume')
plt.xlabel(column_title[0]+column_unit[0])
plt.ylabel(column_title[7]+column_unit[7])
n1 = column_title[0]+column_unit[0]
n2=" Vs "
n3 = column_title[7]+column_unit[7]
n4=n1+n2+n3
plt.title(n4)
plt.savefig(n4+'.png')
plt.show()
Explaination of Python Code
The necessary modules like numpy, math, mathplotlib and sys are used. The sys library is used in case of error in the file during compatability check the sys.exit is used.
Results and Discussion
Result#1
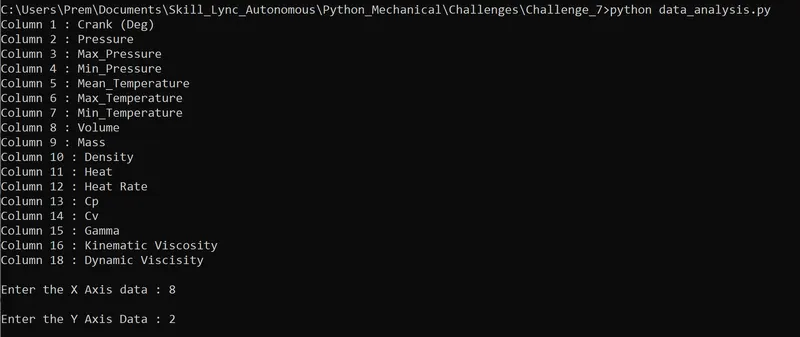
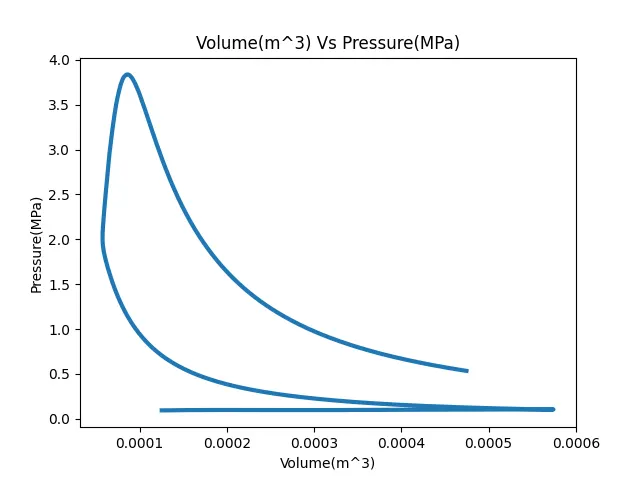
Based on the user input the graph is ploted. When we give input as 8 as x axis which is volume and 2 as input for y axis which is pressure. Then the second graph of pressure vs volume is obtained and it is saved in the local memory with the corresponding name as pressent in the data.
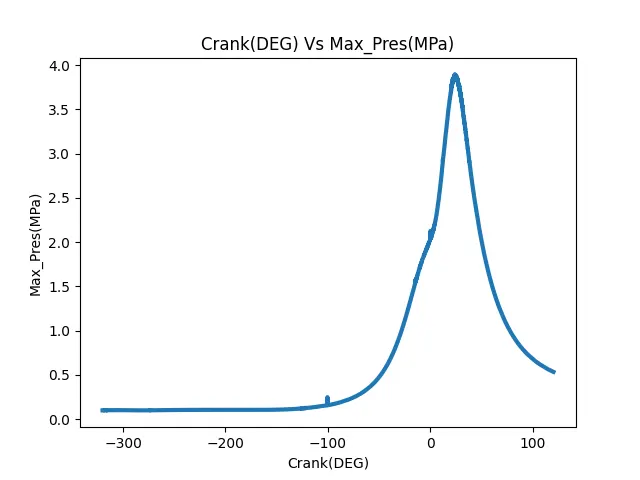
The below image is obtained as the output when the X-axis is 1, which is crank and y asis is 3 which is max pressure. Then the relation between the crank angle vs pressure is obtained.
Result #2
The Area under Pressure and volume is obtained by calculating the area under the graph. By using this value of Work Done we are able to calculate the value of power and specific fuel consumption.

Result #3
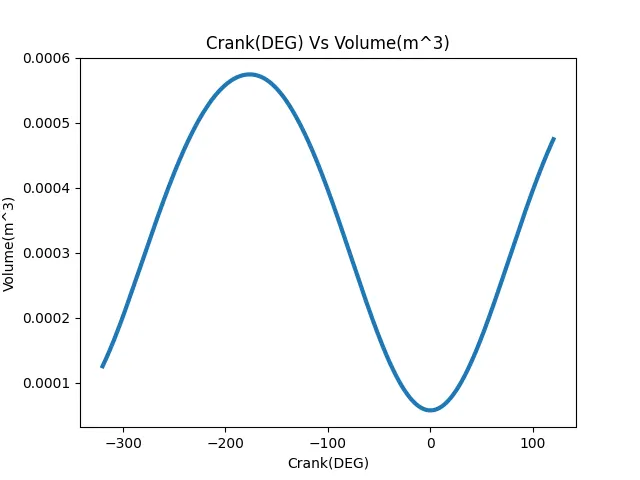
The relation between crank angle and volume is also obtained to understand the relation of the phisical behaviour of the volume of the engine at every point of time.
Result#4
When the file is not pressent or if the file is incorrect then we get this error which is defined using the function sys.

Inference
#1 From the result 1 the variation of various parameters of the engine can be obtained and it can be studied using the python script. And the first graph of max pressure vs Crank angle represent, at the crank angle which is close to the end of power stroke the pressure is very high and the pressure decreases. This peak pressure is exactly before the TDC. IF it is after TDC then major power is being lost.
#2 From result 2 we are able to plot the variation of pressure and volume. By using this relation we are able to obtain the practically possible work done by the engine. And this graph is closely resembling to the thererotical graph which is explained in the before section.
#3 From result 3 the crank ange is varing in sin graph with respect to the volume. This represent there is continuous variation of volume as a function of crank angle which is correct and this graph should be ideally same throught out the engine opearation. If thish graph is having varation then there is problem in the engine, due to blow-by effect of unburned hydrocarbons might be accumlated in the top head center of the engine. This produces the variaiton of relation between volume and crank position for cycle to cycle varations.
Reference
[1] https://docs.python.org/3/library/exceptions.html#SystemExit
[2] Heywood, J.B., 2018. Internal combustion engine fundamentals. McGraw-Hill Education.
Used Data:
The various results of pressure, temperature, volume, cp, cv, crank angle are taken from the below mentioned link
https://drive.google.com/open?id=1L8GY56d-M8mB1KfceM-xVhGNvnCIqxjm