PYTHON Week 6 - Data analysis
PYTHON WEEK 6 CHALLENGE: DATA ANALYSIS
AIM:
Write code for the provided data output file as a challenge parsing data analysis.
OBJECTIVE
1) The script should be written to obtain the plot for the data input provide.
2) Checking the compatibility of the code with graceful exit, if non- compatibility file provided write code " file not recognized. please provide a valid CONVERGE output file".
3) Calculate the performance for the area under the P_V diagram, P is in column 2 and V is in column 8, the power output of the engine assumes rpm is 1500 and calculate specific fuel consumption.
THEORY:
Data parsing or data analysis is the process for inspecting, cleansing, transforming, and modeling data with the goal of discovering useful information, informing conclusions, and supporting decision making. Data analysis has multiple facets and approaches, encompassing diverse techniques under a variety of names, and is used in business, science, and social science domains. In today's business world, data analysis plays a role in making decisions more scientific and helping businesses operate more effectively.
Process of Data Analysis:
Data Requirements - Data collection - Data processing - Data cleaning - Exploratory data analysis.
As we need to calculate several steps using the governing equation:
1) Area under the PV diagram to get the result for the data provided which shows the area under the process curve on a PV diagram is equal to the work performed by gas during the process.
2) Engine power output, assuming the rpm as 1500 : power_output = n*area*stroke_cycle/(1000)
3) Specific fuel consumption: SFC = (Fuel_consumption*pow(10, -6)*stroke_cycle*3600)/(power_output*1000).
PROCEDURE:
To write the code using data parsing:
- Importing math, matplotlib, numpy, and scipy for simps and trapz.
- first input the file which carriers data that to be analysis and checking their compatibility by using try option
try:
file = open('engine_data.out')line_count = 1.
-
The file which is not recognized ned to provide a CONVERGE output file.
-
Creating the null array for pressure and volume, for plotting PV diagram from a data file which is in line 2 and 8 respectively, code for it and plotting them:
data = []
for line in open('engine_data.out'):
if '#' not in line:
data.append(line.split())
if line_count >= 6:
Pressure.append(float(line.split() [P-1]))
Volume.append(float(line.split() [V-1]))line_count = line_count + 1
# Ploting P-V diagram
plt.plot(Volume, Pressure, color = 'green', linewidth = 3)
plt.xlabel('Volume (m^3)')
plt.ylabel('Pressure (MPa)')
plt.title('P-V Diagram of Engine')
plt.grid()
plt.show() - For calculating the area under PV diagram to be written as : area = simps(Pressure, Volume)
print('Area under the curve using simpson rule: ' +str(area) + 'units')
print('work done by the engine:' +str(area) + 'MJ')
area = area*1e6
print('work done by the engine: ' +str(area) + 'J') - For calculating the power output and specific fuel consumption (SFC), Inputing the value of rpm = 1500, rps = = 1500/60, fuel consumption = 20, n = 1: power_output = n*area*stroke_cycle/(1000)
print('power output from engine: ' +str(power_output) + 'KW')
SFC = (Fuel_consumption*pow(10, -6)*stroke_cycle*3600)/(power_output*1000)
print('specific Fuel consumption, SFC =' +str(SFC) + '(kg/hr)/(KW)')
print('t') - And calculating the sfc and power output by the simpson rules and trapezodial rule: Area = np.trapz(Pressure, Volume)
print('Area under the curve using trapezoidal rule :' + str(Area) +'units')
print('work done by the engine :' + str(Area) + 'MJ')
Area = Area* 1e6
print('work done by the engine :' + str(Area) + 'J')
power_output = n*Area*stroke_cycle/(1000)
print('power output from engine :' + str(power_output) + 'KW')
SFC = (Fuel_consumption*pow(10,-6)*stroke_cycle*3600)/(power_output*1000)
print('specific Fuel consumption, SFC = ' + str(SFC) + '(kg/hr)/KW')
print('t') - Transposing th columns into in raw matrix and converting into float type and string type: transpose = np.transpose(data)
float_f = transpose.astype(np.float) - And plotting the other graph by command:
#Array for header and their units
parameters = ['Crank', 'Pressure', 'Maximum Pressure', 'Minimum Pressure', 'Mean Temperature', 'Maximum Temperature', 'Minimum Temperature', 'Volume', 'Mass', 'Density', 'Integrated HR', 'HR Rate', 'Cp', 'Cv', 'Gamma', 'Kinematic viscosity' 'Dyanmic viscosity']
units = ['(DEG)', '(MPa)', '(MPa)', '(MPa)', '(K)', '(K)', '(K)', '(m^3)', '(kg)', '(kg/m^3)', 'J', '(J/time)','(J/kgK)', '(J/kgK)', '(m^2/s)', '(Ns/m^2)']# Providing user choice of picking using two parameters for plotting
print('choose from the following options and press enter key')
print(' 1 Crank n 2 Pressure n 3 Maximum Pressure n 4 Minimum Pressure n 5 Mean Temperature n 6 Maximum Temperature n 7 Minimum Temperature n 8 Volume n 9 Mass n 10 Density n 11 Integrated HR n 12 HR Rate n 13 Cp n 14 Cv n 15 Gamma n 16 Kinematic viscosity n 17 Dyanmic viscosity')X = int(input('Enter your choice on X-axis n'))
Y = int(input('Enter your choice on Y-axis n'))
# Ploting the graph beased on your choice
plt.figure(1)
plt.plot(float_f [X-1], float_f[Y-1], linewidth =4, color = 'yellow')
plt.title(' Plot for ' + parameters [X-1]+ 'versus' + parameters [Y-1], color = 'green')
plt.xlabel(parameters [X-1] + ' ' + units[X-1])
plt.ylabel(parameters [Y-1] + ' ' + units[Y-1])
plt.grid()
plt.show().
'''
A program to calculate engine parameters and to plot a graph between two quantities according to user input
By Deven Ahire
'''
import math
import matplotlib.pyplot as plt
import numpy as np
from scipy.integrate import simps as simps, trapz as trapz

#file input
file = 'engine_data.out'

#Compatability check
try:
	file = open('engine_data.out')

	line_count = 1

except:
	print('file not recognized. please provide a valid CONVERGE output file')

# Creating of the empty array to store the value of pressure and volume

Pressure = []
Volume = []

#Pressure and volume in the data file is present in column 2 and 8 respectively. calling them and storing their data into arrays
P = 2
V = 8

# Getting a null array and storing all data values of the data file into it
data = []

for line in open('engine_data.out'):
	if '#' not in line:
		data.append(line.split())
		if line_count >= 6:
			Pressure.append(float(line.split() [P-1]))
			Volume.append(float(line.split() [V-1]))

	line_count = line_count + 1

# Ploting P-V diagram
plt.plot(Volume, Pressure, color = 'green', linewidth = 3)
plt.xlabel('Volume (m^3)')
plt.ylabel('Pressure (MPa)')
plt.title('P-V Diagram of Engine')
plt.grid()
plt.show()

# Calculating the area P-V daigram,  p is in column in 2 and v is in volume 8
area = simps(Pressure, Volume)
print('Area under the curve using simpson rule: ' +str(area) + 'units')
print('work done by the engine:' +str(area) + 'MJ')
area = area*1e6
print('work done by the engine: ' +str(area) + 'J')

#Inputs
#Speed of the engine (RPM)
rpm = 1500
rps = 1500/60
stroke_cycle = rps/2

#Fuel consumption in micrograms per 1 stroke cycle
Fuel_consumption = 20

# The sepcification of engine
# No of cylinder
n = 1

# 4 stroke engine

# Calculations of power output and specific fuel consumption

power_output = n*area*stroke_cycle/(1000)
print('power output from engine: ' +str(power_output) + 'KW')
SFC = (Fuel_consumption*pow(10, -6)*stroke_cycle*3600)/(power_output*1000)
print('specific Fuel consumption, SFC =' +str(SFC) + '(kg/hr)/(KW)')
print('t')

# Calculation of area under PV daigram using the trapezoidal rule and work done power, sfc
Area = np.trapz(Pressure, Volume)
print('Area under the curve using trapezoidal rule :' + str(Area) +'units')
print('work done by the engine :' + str(Area) + 'MJ')
Area = Area* 1e6
print('work done by the engine :' + str(Area) + 'J')
power_output = n*Area*stroke_cycle/(1000)
print('power output from engine :' + str(power_output) + 'KW')
SFC = (Fuel_consumption*pow(10,-6)*stroke_cycle*3600)/(power_output*1000)
print('specific Fuel consumption, SFC = ' + str(SFC) + '(kg/hr)/KW')
print('t')

#Transposing  coulmns into raw matrix and converting them into float type from string type
transpose = np.transpose(data)
float_f = transpose.astype(np.float)

#Array for header and their units
parameters = ['Crank', 'Pressure', 'Maximum Pressure', 'Minimum Pressure', 'Mean Temperature', 'Maximum Temperature', 'Minimum Temperature', 'Volume', 'Mass', 'Density', 'Integrated HR', 'HR Rate', 'Cp', 'Cv', 'Gamma', 'Kinematic viscosity' 'Dyanmic viscosity']
units = ['(DEG)', '(MPa)', '(MPa)', '(MPa)', '(K)', '(K)', '(K)', '(m^3)', '(kg)', '(kg/m^3)', 'J', '(J/time)','(J/kgK)', '(J/kgK)', '(m^2/s)', '(Ns/m^2)']

# Providing user choice of picking using two parameters for plotting
print('choose from the following options and press enter key')
print(' 1 Crank n 2 Pressure n  3 Maximum Pressure n 4 Minimum Pressure n 5 Mean Temperature n 6 Maximum Temperature n 7 Minimum Temperature n 8 Volume n 9 Mass n 10 Density n 11 Integrated HR n 12 HR Rate n 13 Cp n 14 Cv n 15 Gamma n 16 Kinematic viscosity n 17 Dynamic viscosity')

X = int(input('Enter your choice on X-axis n'))

Y = int(input('Enter your choice on Y-axis n'))

# Ploting the graph beased on your choice
plt.figure(1)
plt.plot(float_f [X-1], float_f[Y-1], linewidth =4, color = 'yellow')
plt.title(' Plot for ' +  parameters [X-1]+ 'versus' + parameters [Y-1], color = 'green')
plt.xlabel(parameters [X-1] + ' ' + units[X-1])
plt.ylabel(parameters [Y-1] + ' ' + units[Y-1])
plt.grid()
plt.show()
RESULTS:
Executing the code for the following code, as the PV diagram is plotted.
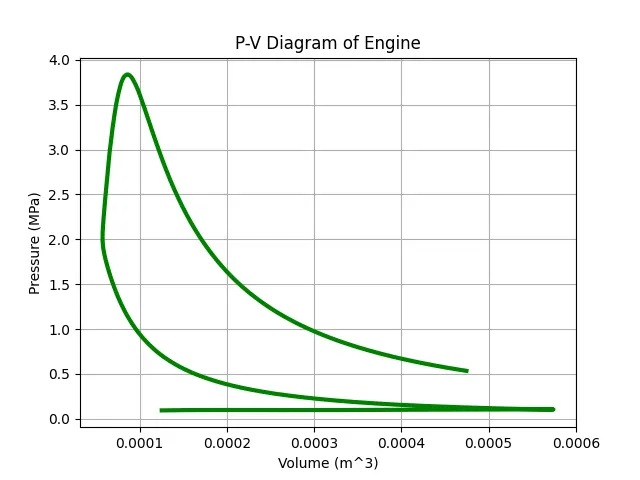
Fig 1: P-V diagram
The resulting output for the Simpson rule for work done by the engine, power output engine, and specific fuel consumption.
Area under the curve using simpson rule: 0.0005005864474262364units
work done by the engine:0.0005005864474262364MJ
work done by the engine: 500.58644742623636J
power output from engine: 6.257330592827954KW
specific Fuel consumption, SFC =0.00014383130100742395(kg/hr)/(KW)

The resulting output for the Trapezoidal rule for work done by the engine, power output engine, and specific fuel consumption.
rea under the curve using trapezoidal rule :0.0005005866274680075units
work done by the engine :0.0005005866274680075MJ
work done by the engine :500.58662746800746J
power output from engine :6.257332843350094KW
specific Fuel consumption, SFC = 0.00014383124927683276(kg/hr)/KW

For plotting the other graph enter the graph which needs to obtain pressing enter.

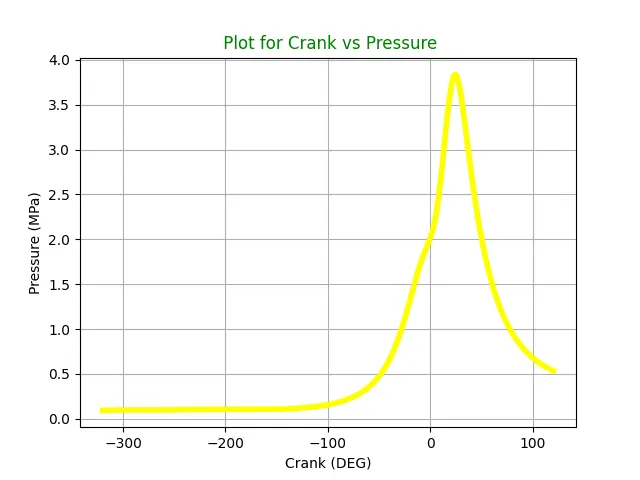
Fig 2: Crank Vs Pressure
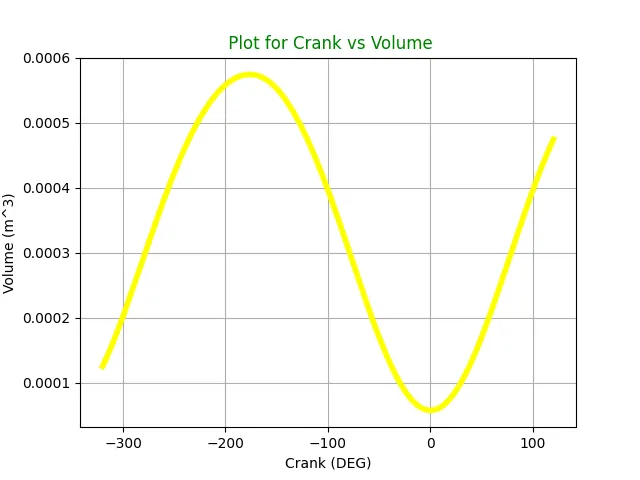
Fig 3: Crank Vs volume
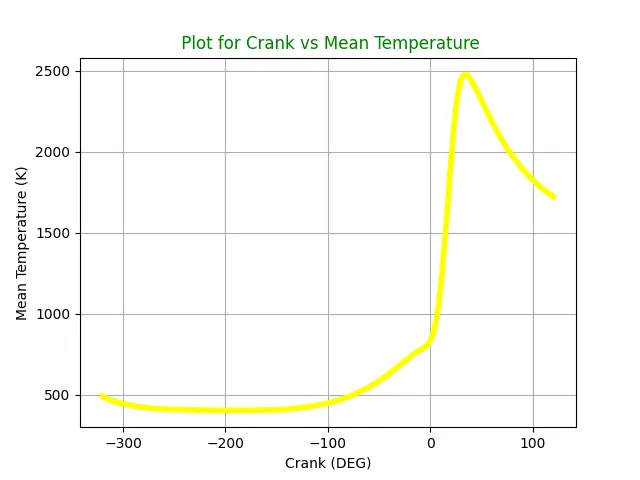
Fig 4: Crank Vs Mean Temperature
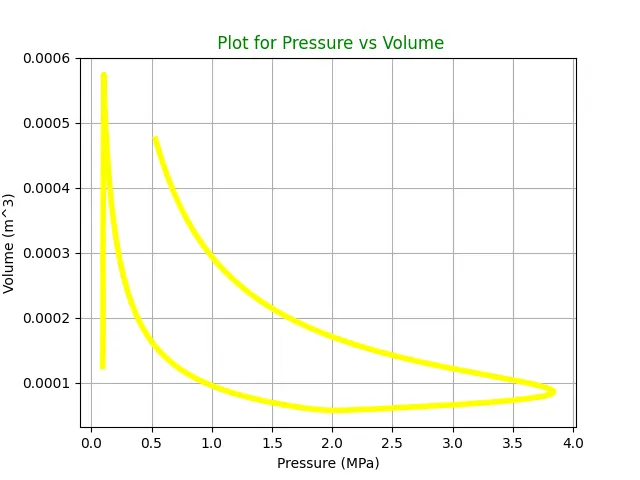
Fig 5: Pressure vs Volume
--------------------------------------------------------------------------------------------------------------------------------------------------------------------------------------------------------------------------------------------
Link: https://drive.google.com/drive/folders/1w8iV_RdqRrrj4y60ocG4tD43bHmpasa0?usp=sharing