Week 6 - CHT Analysis on a Graphics card
OBJECTIVE:
We are to run Conjugate Heat Transfer(CHT) analysis on a graphics card and do the following:
- Run the simulation by varying the velocity from 1m/sec to 5m/sec for at least 3 velocities and discuss the results.
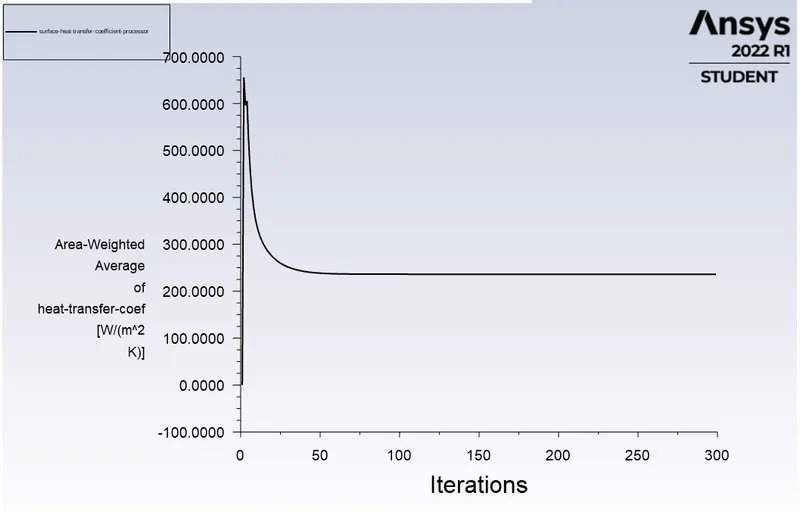
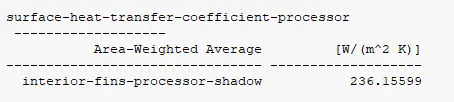
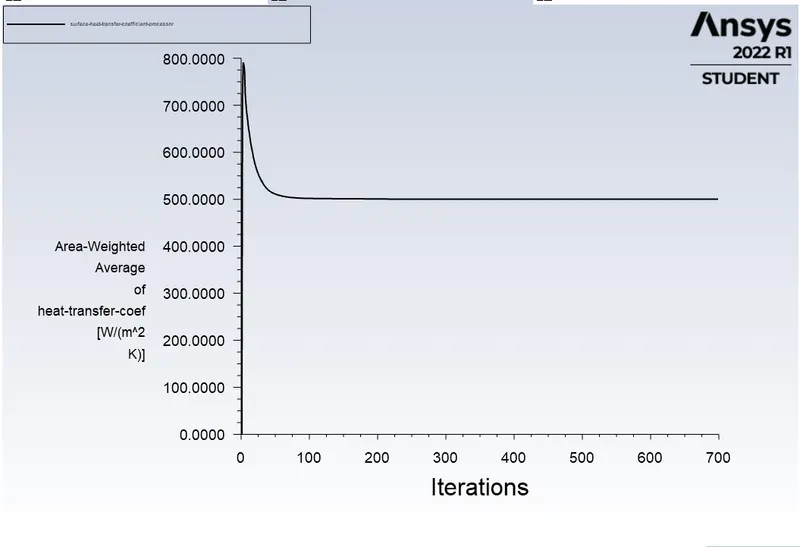
- Find out the maximum temperature and heat transfer coefficient attained by the processor.
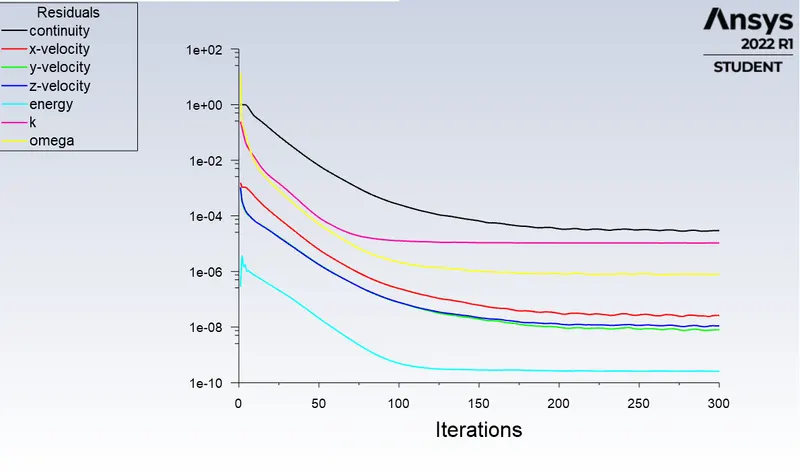
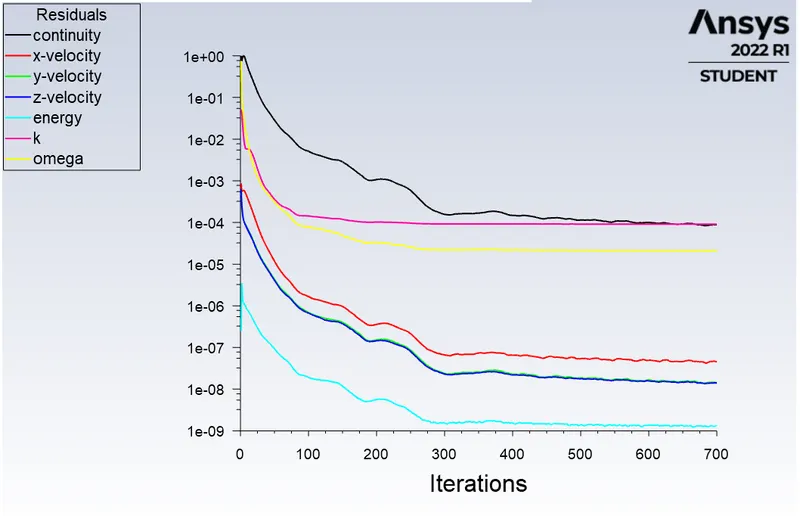
- Prove that the simulation has achieved convergence with appropriate images and plots.
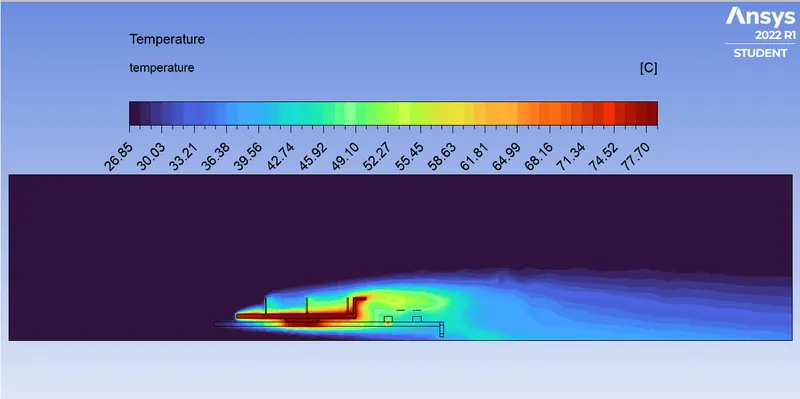
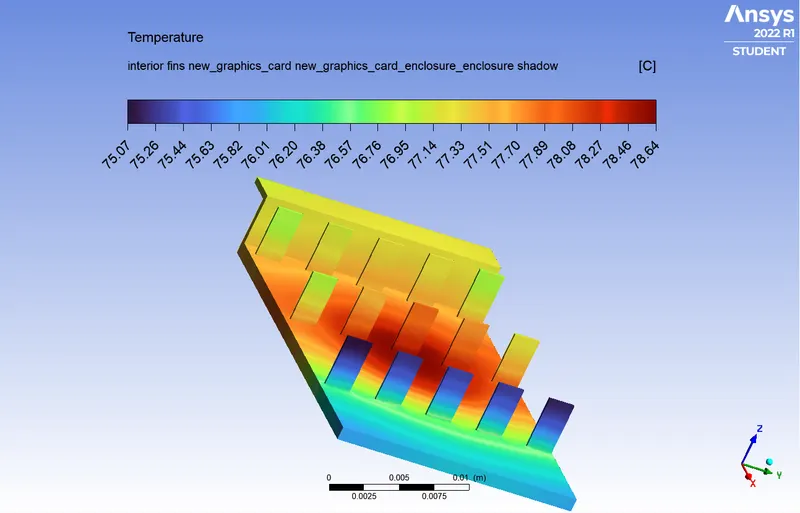
- Identify potential hotspots on the model.
INTRODUCTION AND THEORY:
Semi-conductor devices generate a lot of heat during operation due to Joule Heating. Joule heating is a process due to which when an electric current passes through a conductor it generates heat.
Mathematically, the power in watts P, dissipated by a current of magnitude I amperes, across a conductor having R ohms resistance is given as:

Joule Heating affects the entire conductor, hence the whole conductor is susceptible to overheating.
The miniaturisation of semiconductors is the primary goal of the semiconductor industry. It enables the reduction of production costs and helps in reducing the size of equipment that uses them. However, It also increases the total power dissipation per unit area. This is a limiting factor for semiconductors as they have a negative temperature coefficient of resistance. As such, as the temperature increases, they become more and more conductive, increasing the chance of short-circuiting and damaging all the components connected to it.
Due to these factors, the cooling of processors and GPUs has increased interest these days when ICs keep reducing in size. We will address the same problem and through CHT analysis observe the effects of cooling.
GEOMETRY:
We have a very basic model of a generic graphics card:
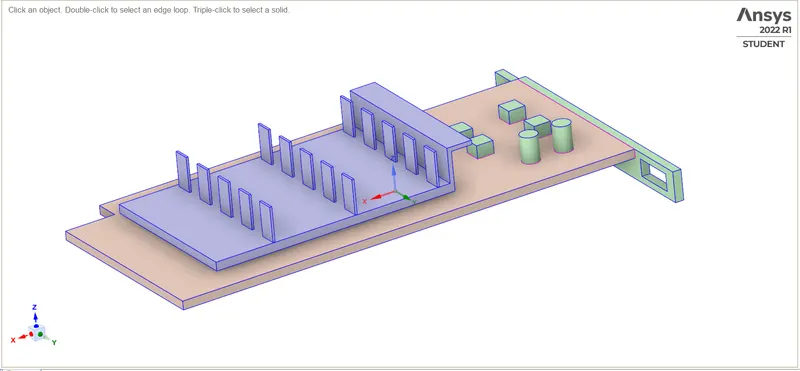
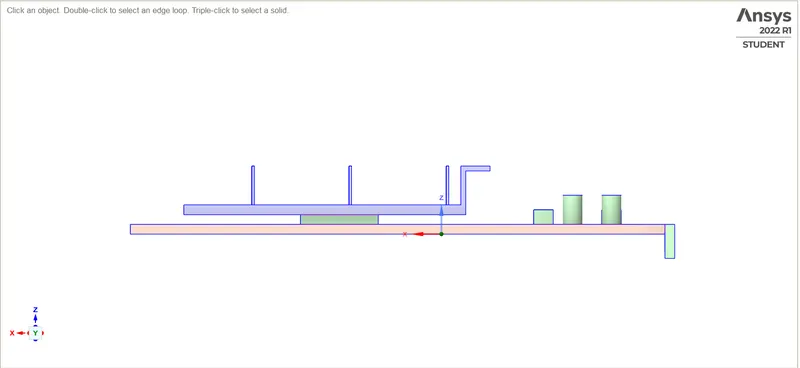
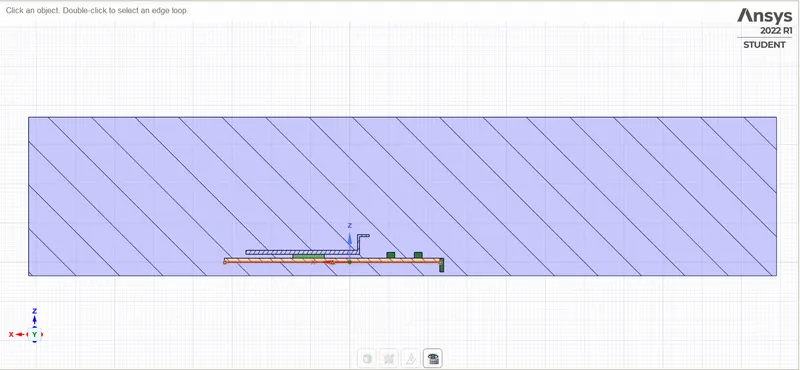
We include it in an enclosure to simulate a wind tunnel:
MESHING:
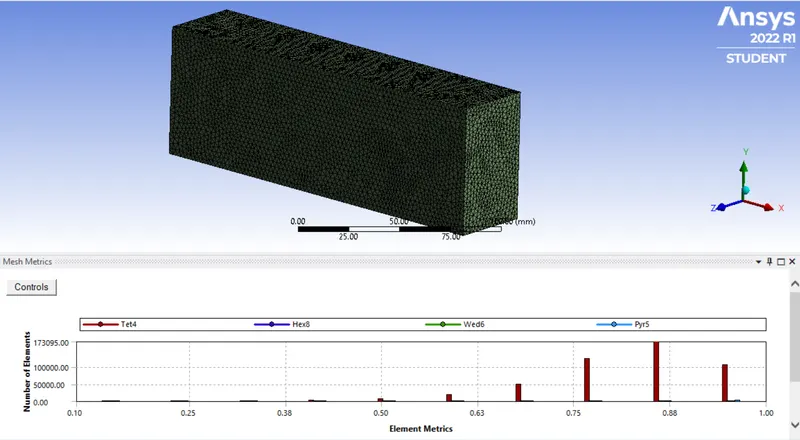
We will use a combination of coarse and fine mesh to save computing power and time and obtain the best results while we are at it. The fins and processor have been refined with a mesh size of 0.5 mm. Since most of the heat dissipation will take place through the fins and the processor is our heat source, hence we need a refined mesh in place to better observe the temperature distribution:
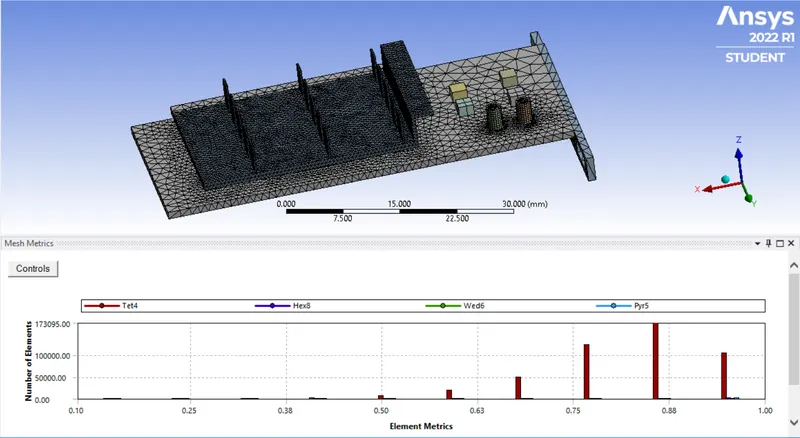
The rest of the model has a coarser mesh of 2.5mm:
SETUP AND SOLUTION:
General Setup:
Solver: K-omega SST
Inlet Velocity: Variable (1/3/5) m/s (3 cases)
Inlet Temperature: 300 K
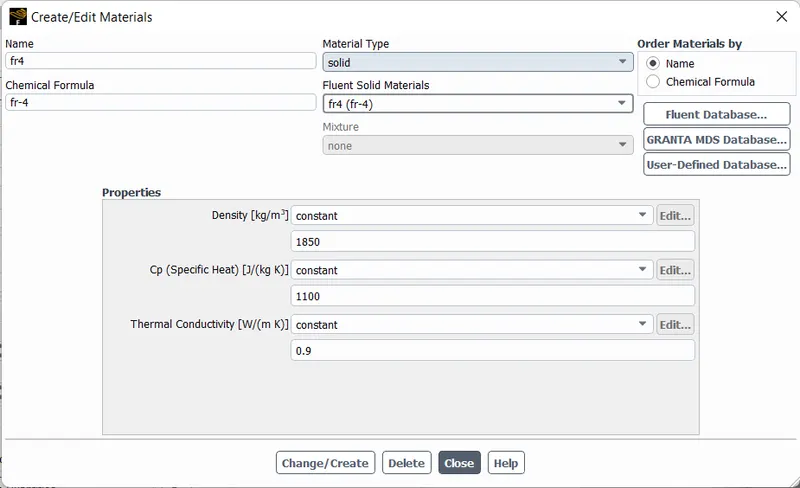
We will also be using different materials in this setup. We have ANSYS default settings for Air and Aluminium. Some others we need to define manually such as FR-4 PCB material:
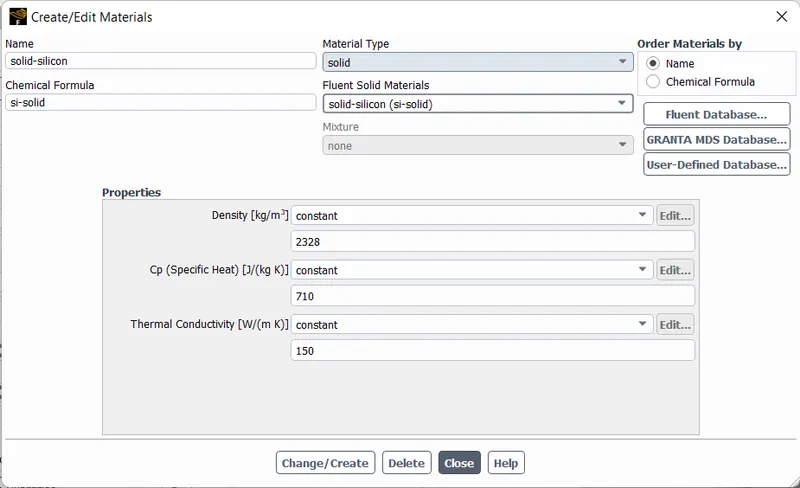
and Solid Silicon for processor:
The materials are assigned to different zones as follows:
| ZONE | MATERIAL |
| Processor | Silicon Solid |
| Fins | Aluminium |
| Main Board | FR-4 |
| Enclosure | Air |
RESULTS:
CASE I (V = 1 m/s):
CONVERGENCE:
SURFACE HEAT TRANSFER COEFFICIENT FOR PROCESSOR:
TEMPERATURE PROFILE:
FINS (LOCAL DISTRIBUTION):
MAINBOARD (LOCAL DISTRIBUTION):
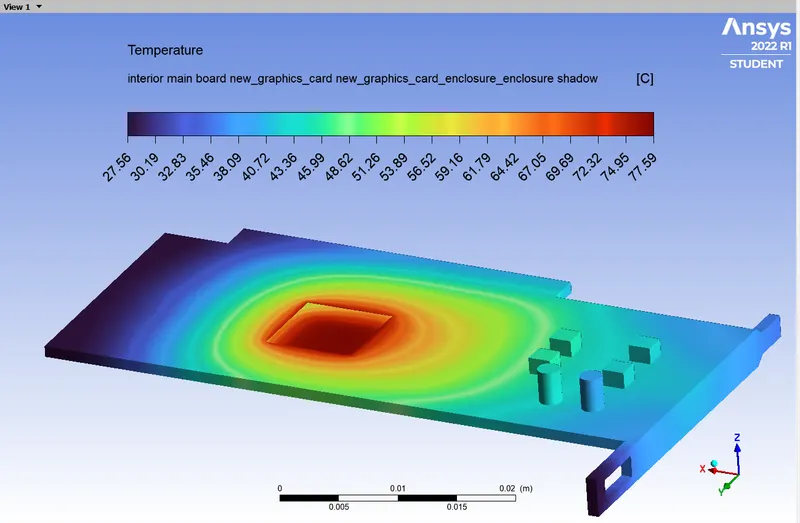
PROCESSOR (LOCAL DISTRIBUTION):
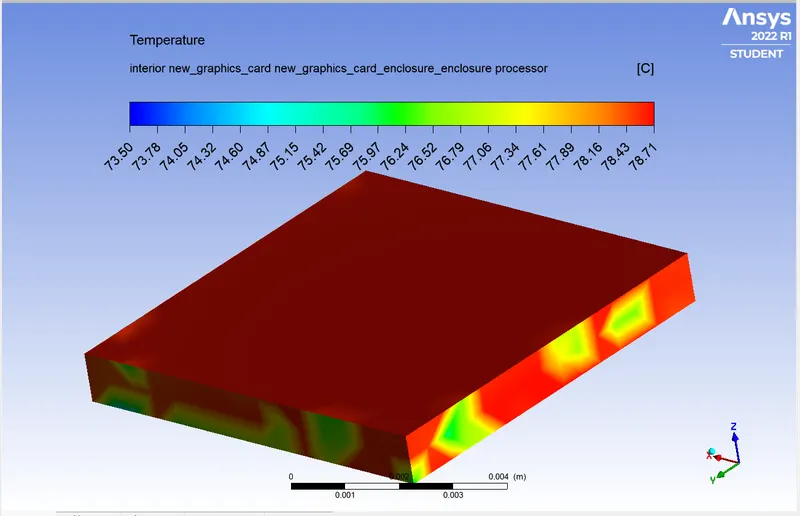
CASE II (V = 3 m/s):
CONVERGENCE:
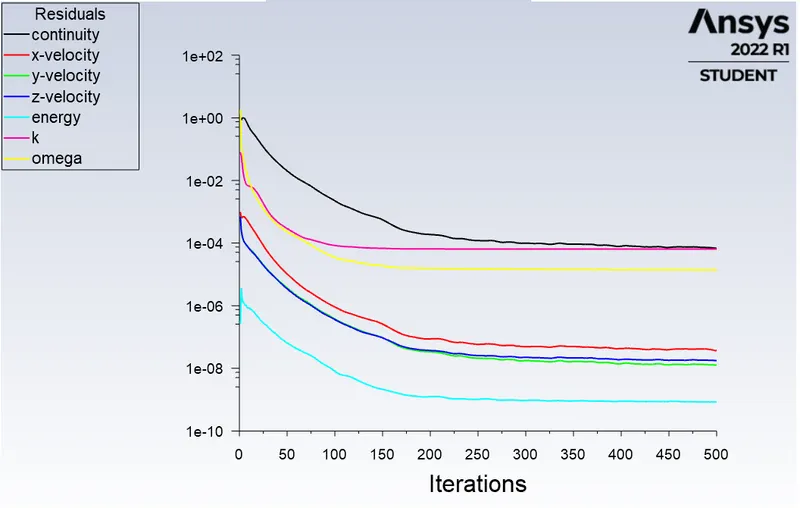
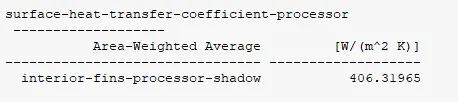
SURFACE HEAT TRANSFER COEFFICIENT FOR PROCESSOR:
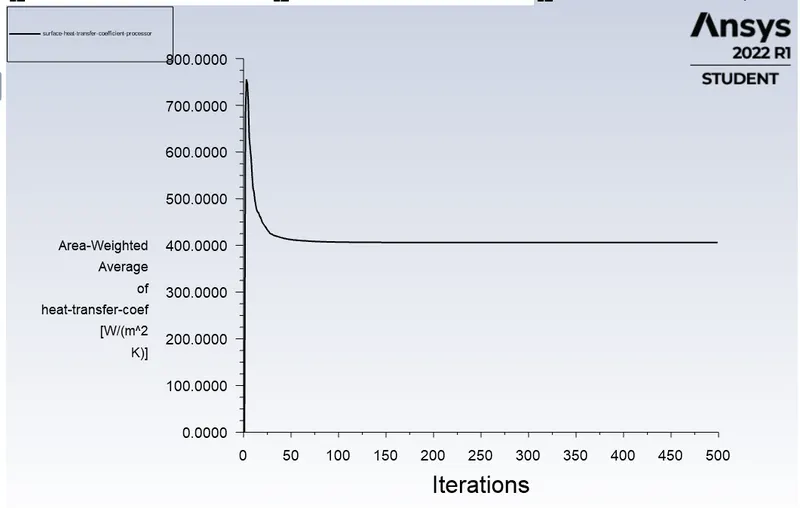
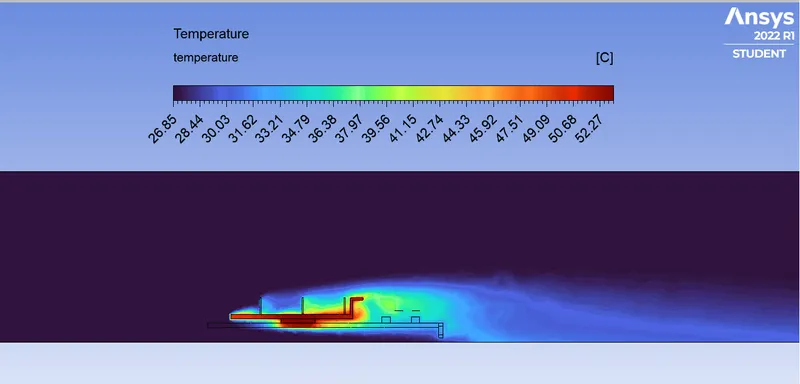
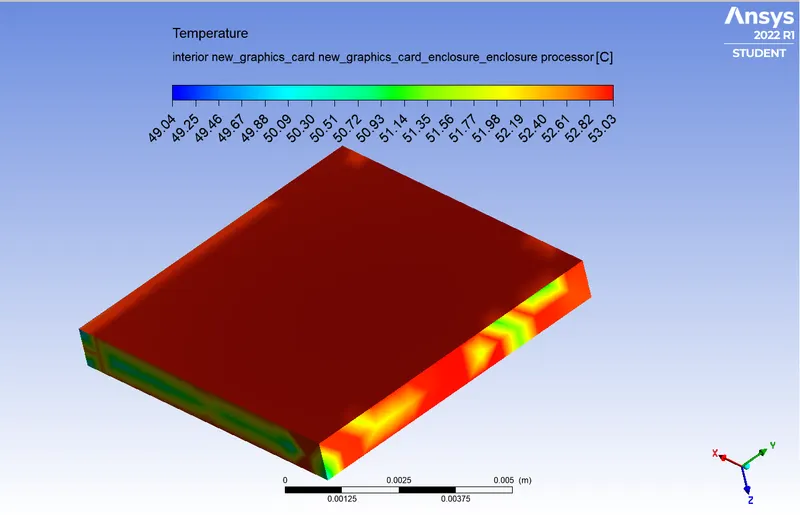
TEMPERATURE PROFILE:
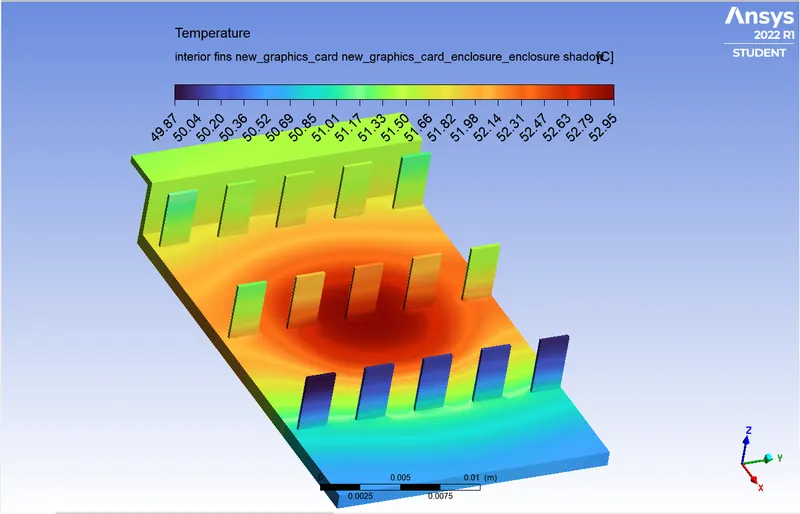
FINS (LOCAL DISTRIBUTION):
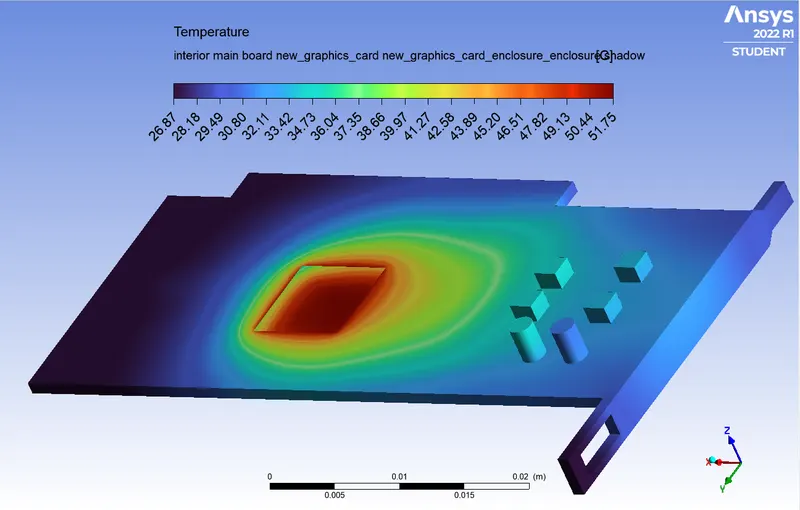
MAINBOARD (LOCAL DISTRIBUTION):
PROCESSOR (LOCAL DISTRIBUTION):
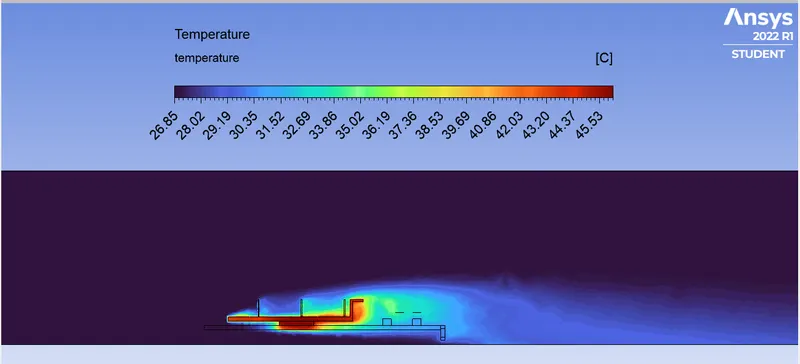
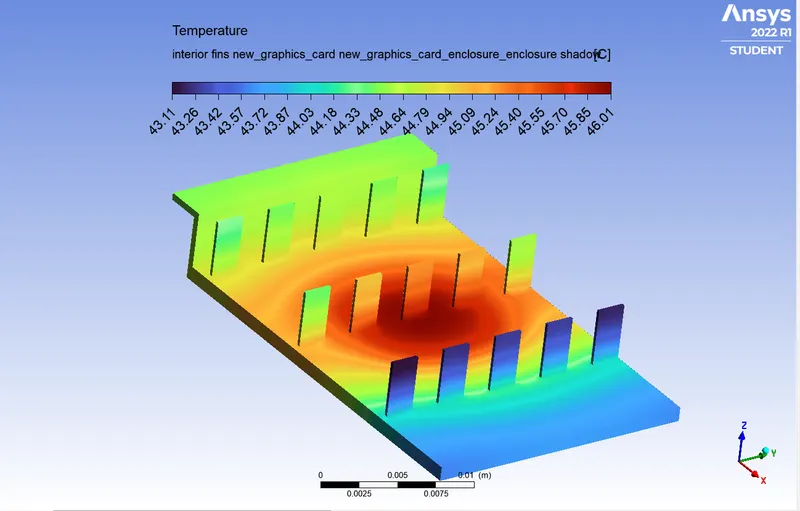
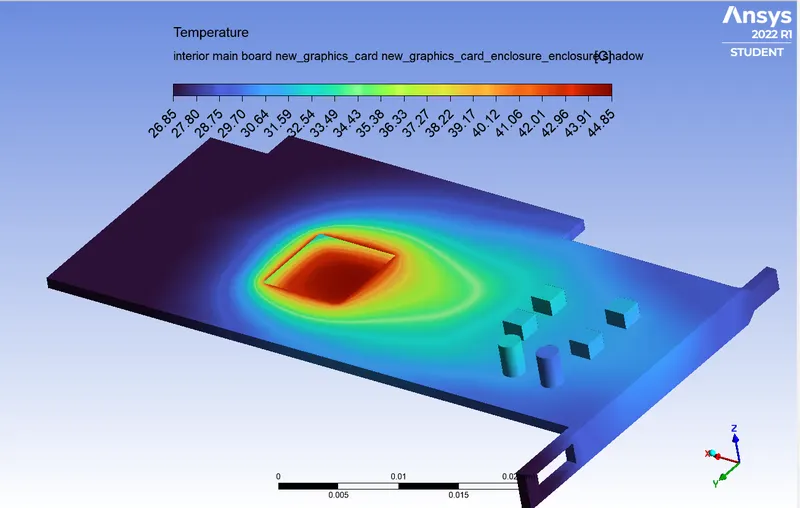
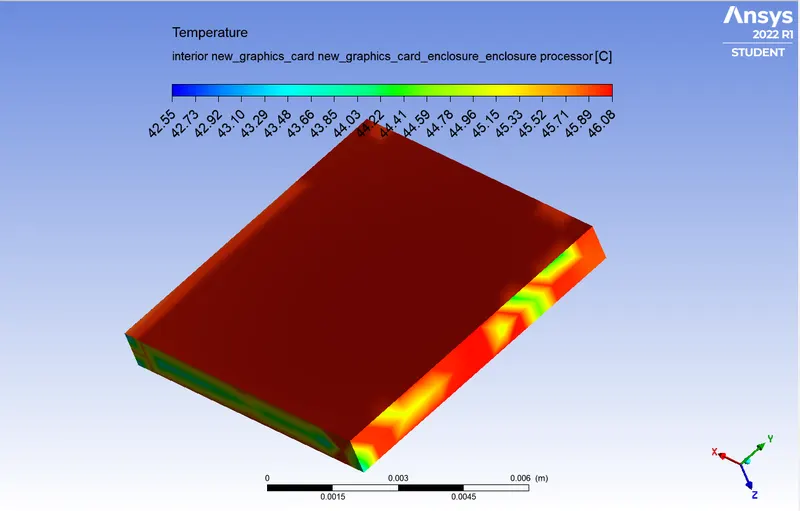
CASE III (V = 5 m/s):
CONVERGENCE:
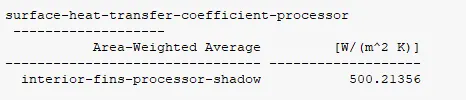
SURFACE HEAT TRANSFER COEFFICIENT FOR PROCESSOR:
TEMPERATURE PROFILE:
FINS (LOCAL DISTRIBUTION):
MAINBOARD (LOCAL DISTRIBUTION):
PROCESSOR (LOCAL DISTRIBUTION):
CONCLUSION:
Comparison:
| CASE | Velocity | Max. Processor Temperature | Surface Heat Transfer Coefficient |
| CASE I | 1 m/s | 78.71°C | 236.15 W/m^2 K |
| CASE II | 3 m/s | 53.03°C | 406.31 W/m^2 K |
| CASE III | 5 m/s | 46.08°C | 500.21 W/m^2 K |
We can infer from this tabulation that:
- Increasing the velocity of air, facilitates more cooling, as the operating temperature was reduced by 20°C.
- This is only effective until a certain velocity is reached, the result shows that the efficiency of this method decrease since when we increase to 3m/s the heat transfer rate increase by a value of 170, however, when we increase to 5 m/s we ca only observe a change of 94 W/m^2 K.
Potential Hotspots:
- The major hotspot is the surface in contact with the processor, for both fins and main-board.
- Other potential hotspots can be the inner fins, the fins at the far end from the inlet, the bases of the fins and the wall just behind the last row of fins.
- The major cause of these potential hotspots is the obstructive nature of fins, since they are placed in the way of the flow, they act as a bluff body and cause disruption, hence the cooler air is not able to reach the last row of the fins in a streamlined manner and neither it is able to effectively cool the fins at the centre, this is why the fins on extremities of each row are cooler than the ones in the centre.
- If these fins are aligned along with the flow i.e. the thinner side facing the inlet, then the air will flow right through and be able to reach the end regions as well as the central fins.