Week 6 - CHT Analysis on a Graphics card
CHT-Analysis on Graphic Card
Aim:
To study, steady-state conjugate heat transfer analysis on the graphic card.
Objective:
- To run the simulation by varying the velocity from 1m/s to 5m/s for at least 3 velocities and discuss the results.
- Find out the maximum temperature and heat transfer coefficient attained by the processor.
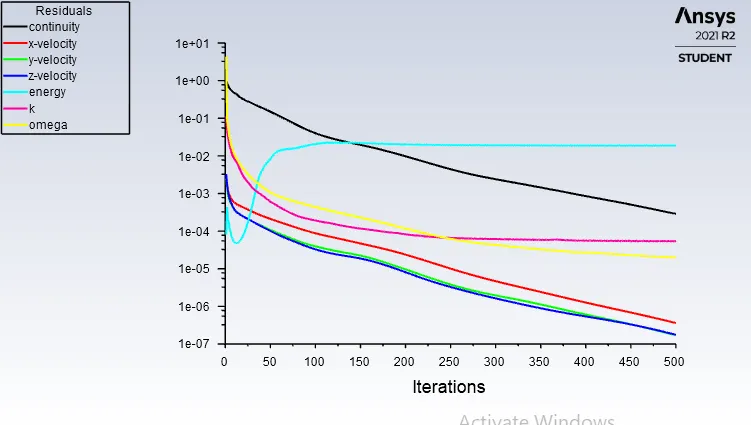
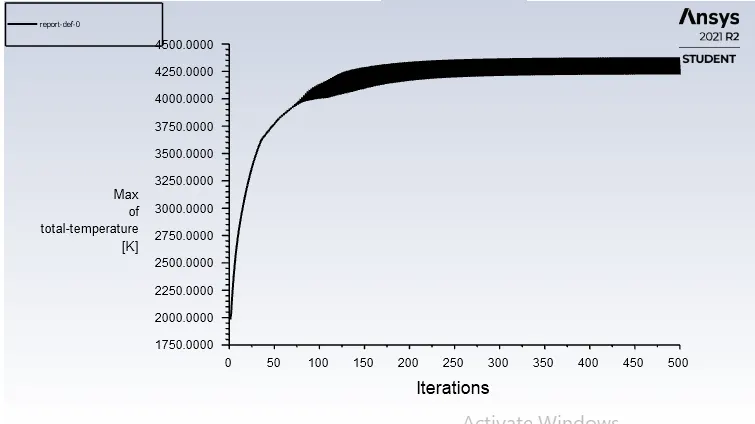
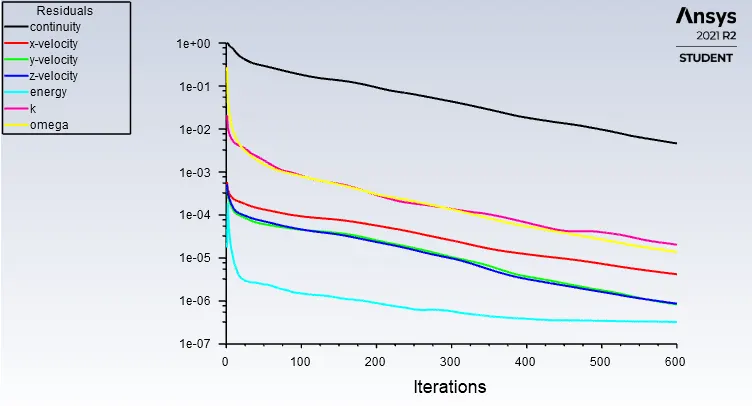
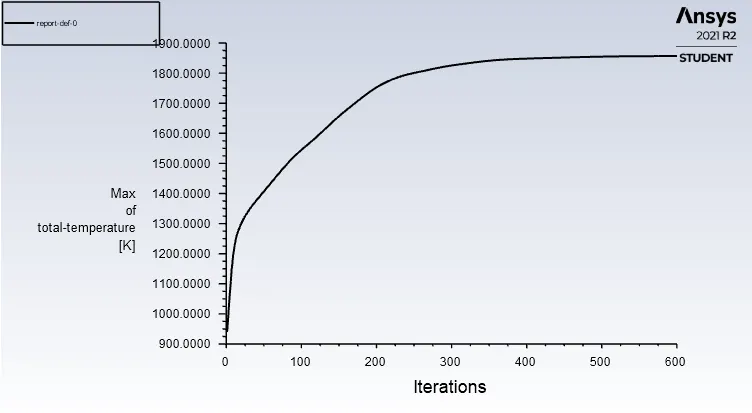
- Prove that the simulation has achieved convergence with appropriate images and plots.
- Identify potential hotspots on the model.
Introduction:
Conjugate heat transfer corresponds with the combination of heat transfer in solids and heat transfer in fluids. In solids, conduction often dominates whereas in fluids, convection usually dominates. Conjugate heat transfer includes both conduction and convection.
As the hot air passes through the exhaust port it is obvious that it will heat the inner exhaust wall by exchange of energies between the hot air and wall, the exchange of temperature depends on the wall heat transfer coefficient, and in this simulation we are supposed to examine the wall heat transfer coefficient and hotspots produce on the wall due to flow of hot air.
Applications:
Some of the applications include, efficiently combining heat transfer in fluids and solids is the key to designing effective coolers, heaters, or heat exchangers. The fluid usually plays the role of energy carrier on large distances. Forced convection is the most common way to achieve high heat transfer rate. In some applications, the performances are further improved by combining convection with phase change (for example liquid water to vapor phase change). Even so, solids are also needed, in particular to separate fluids in a heat exchanger so that fluids exchange energy without being mixed. [1]
Formulations:
`Q^.=hAΔT`
Where,
`Q^.`= Heat transfer rate
`h`= heat transfer coefficient
`ΔT`= temperature difference between the body and surrounding
Approach and solving:
- Firstly I performed baseline simulation using coarse mesh by giving specific materials to different solid volumes, and ran the simulation for steady-state with velocity of 1m/s and evaluated the maximum temperature attained by the processor.
- Then I refined the mesh by providing proper sizing to each and every component and I ran the simulation for different velocities and compared the results.
Material Selection:
A graphics card (also called a video card, display card, graphics adapter, video adapter, or display adapter) is an expansion card which generates a feed of output images to a display device (such as a computer monitor). Frequently, these are advertised as discrete or dedicated graphics cards, emphasizing the distinction between these and integrated graphics. At the core of both is the graphics processing unit (GPU), which is the main component that performs computations, but should not be confused with the graphics card as a whole, although "GPU" is often used as a metonymic shorthand to refer to graphics cards.
Base- Aluminium
- High thermal conductivity
- Less expensive
- Light weight
- High ductility [4]
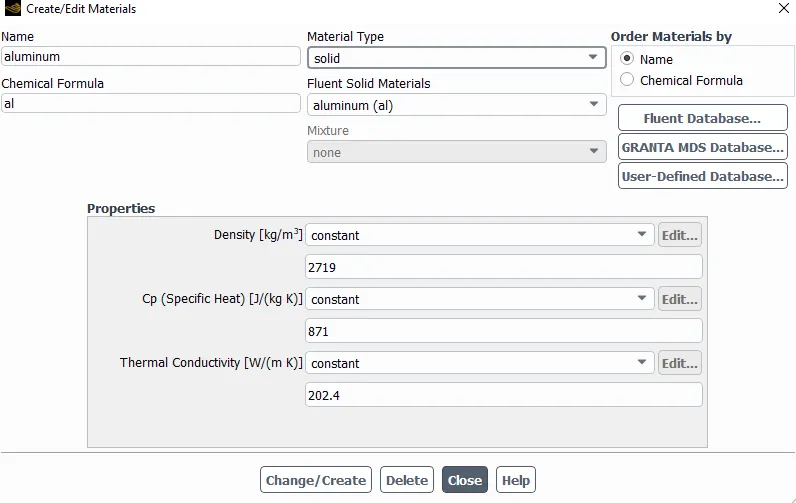
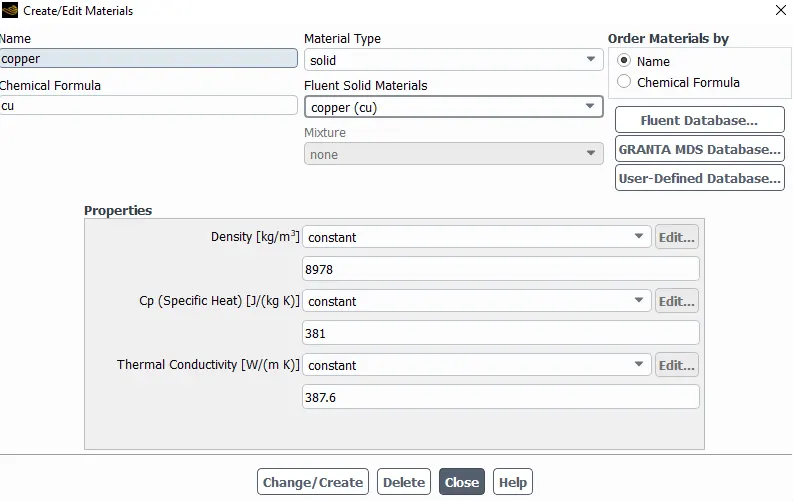
Fin- Copper
- Twice the thermal conductivity than aluminium
- Three times denser than aluminium
- High electric conductivity [4]
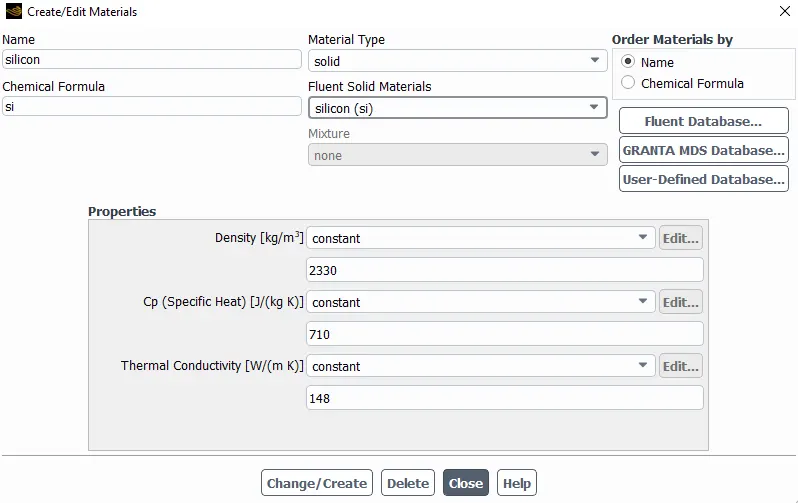
Processor- Silicon
Silicon- Layered with tantalum to stabilize the chip and allow for better data storage with a smaller chip. [3]
Power demand:
As the processing power of graphics cards has increased, so has their demand for electrical power. Current high-performance graphics cards tend to consume large amounts of power. For example, the thermal design power (TDP) for the GeForce Titan RTX is 280 watts. When tested while gaming, the GeForce RTX 2080 Ti Founder's Edition averaged 300 watts of power consumption. [2]
PROCEDURE:
- Geometry
- Mesh
- Setup
- Solution
- Results
Pre-Processing:
Geometry:
- Export Geometry
- Geometry contain solid volumes- base, fin, processor
- Fluid volume- enclosure
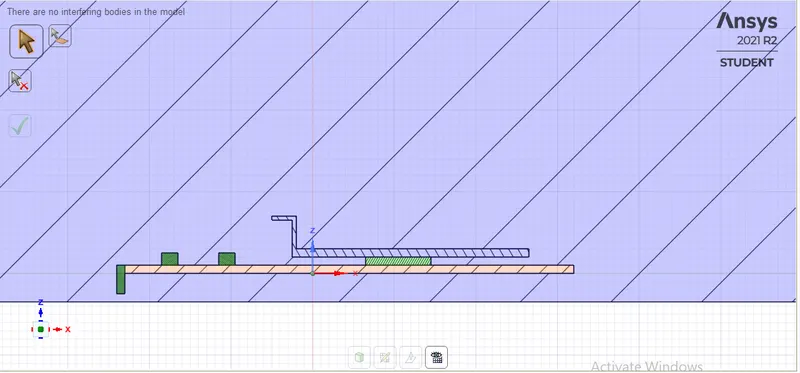
- Interference check
- Share topology
- Extra-edges
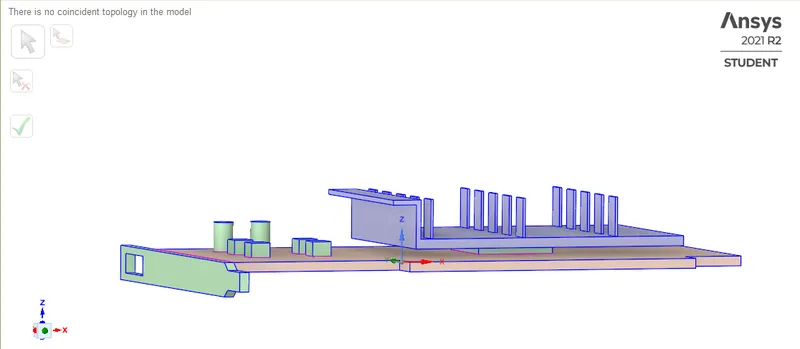
Interference check
Mesh:
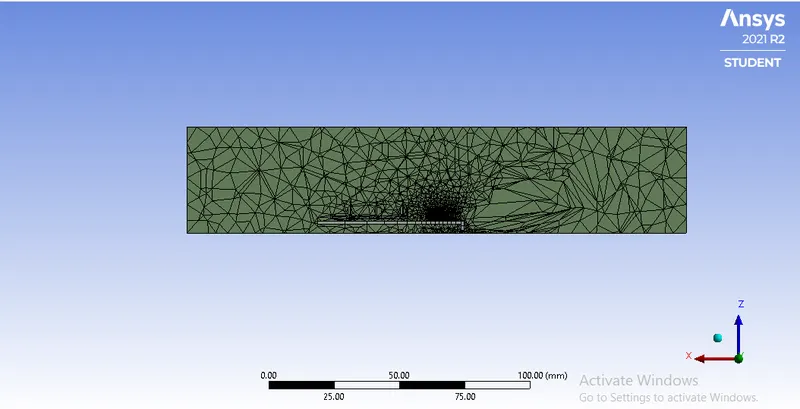
Baseline mesh (Coarse)
Element size: Default (10.289mm)
No of Elements: 82363
Refined Mesh
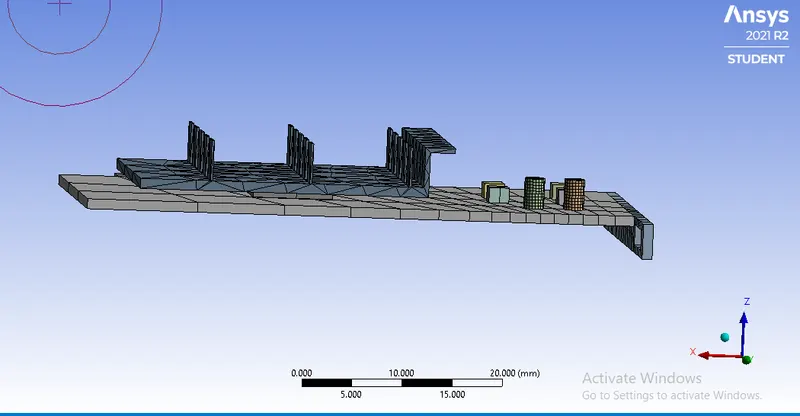
The mesh was refined properly by giving element sizing for each separate solid volume:
Enclosure: 3mm
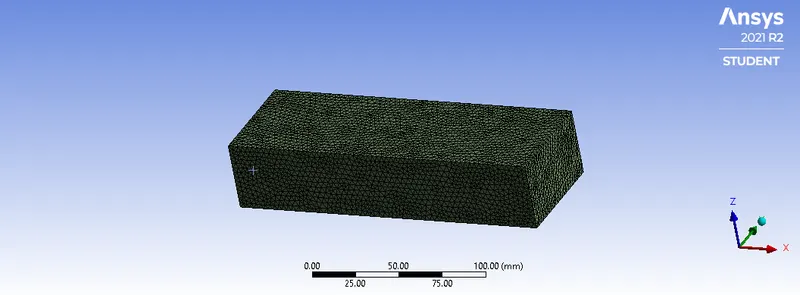
Base: 0.6mm, and Processor: 0.5mm
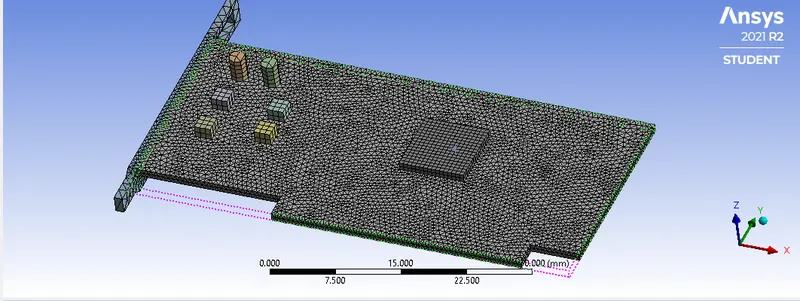
Fin: 0.8mm
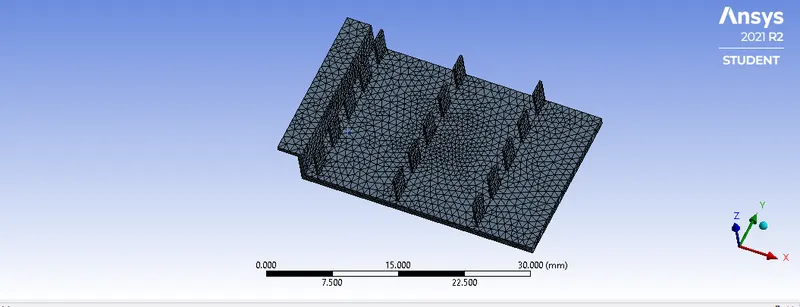
No of Elements: 500294
Setup:
General: Pressure based, absolute, Steady state
Energy: Yes
Model: K-omega>SST
Material: Fluid- Air
Solid- Aluminium (Al), Silicon (Si), Copper (Cu)
Cell zone: fff_fluidvolume-> material-> air
fff_solidvolume
Fin-> copper
Base-> aluminium
Processor-> silicon, Source term-> energy = 4687500000 W/cu.m
Boundary condition: inlet-velocity= 1m/s, 3m/s, 5m/s
Outlet = 0 Pa (1 atm)
Temperature = 300K
Method: Scheme- Simple
Momentum- 1st order upwind
Definitions: Volume report-> Max temperature-> Processor
Initialization: Hybrid initialization
Results: Temperature contour
Run-calculation: 600-iterations
Results
Post-Processing
Baseline
Velocity: 1m/s
Residual Plot
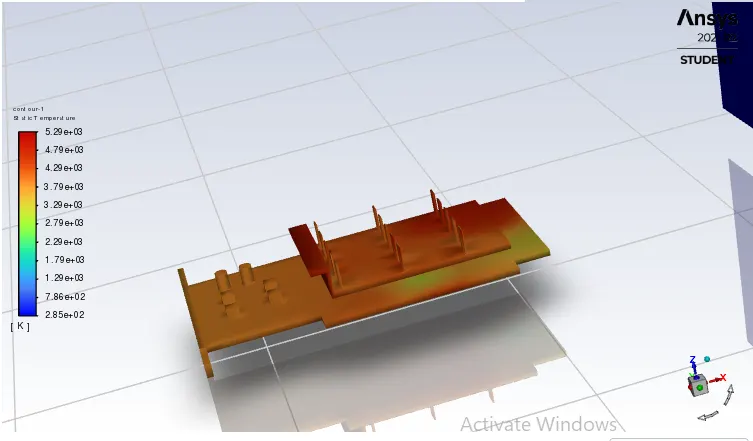
Temperature plot:
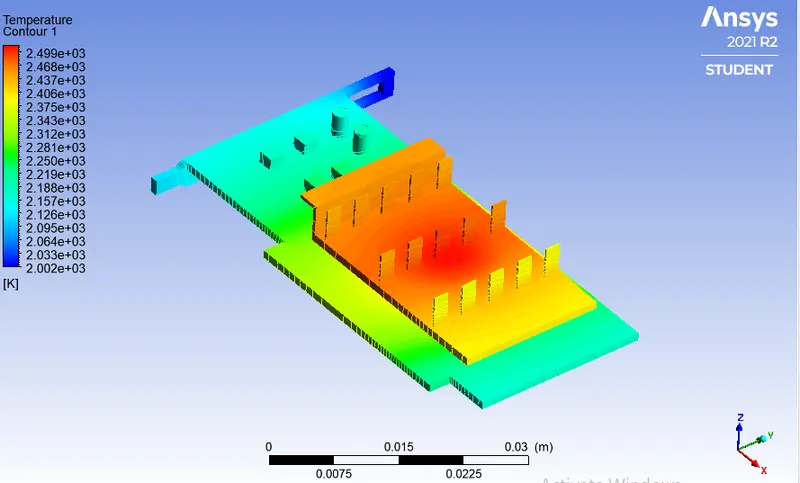
Temperature contour
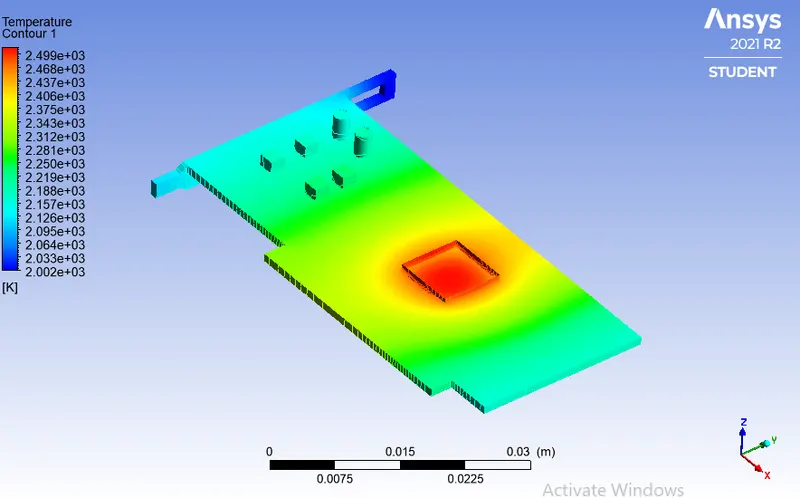
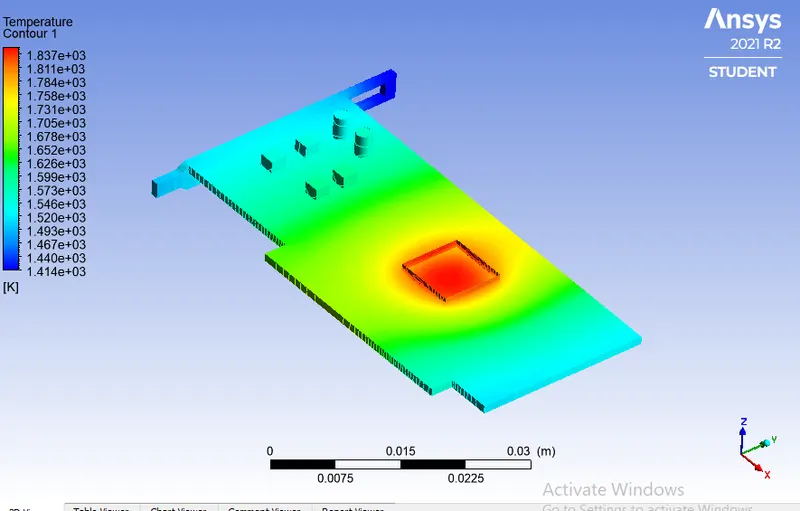
Temperature hotspot
Refined Mesh
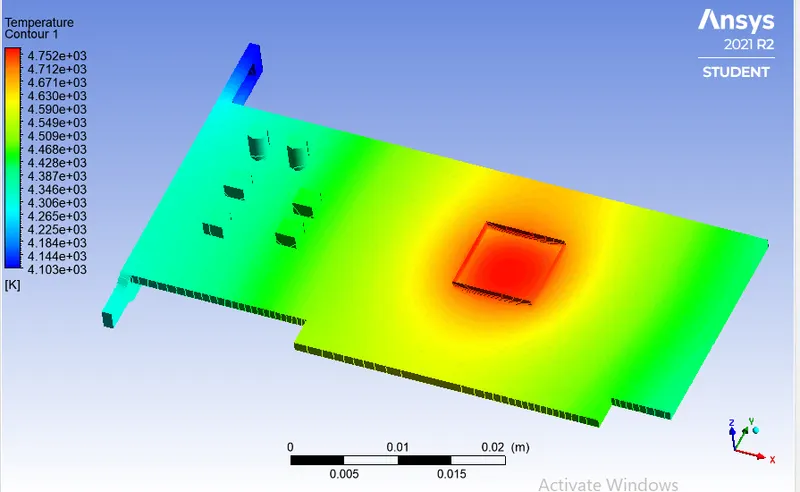
Case1
Velocity: 1m/s
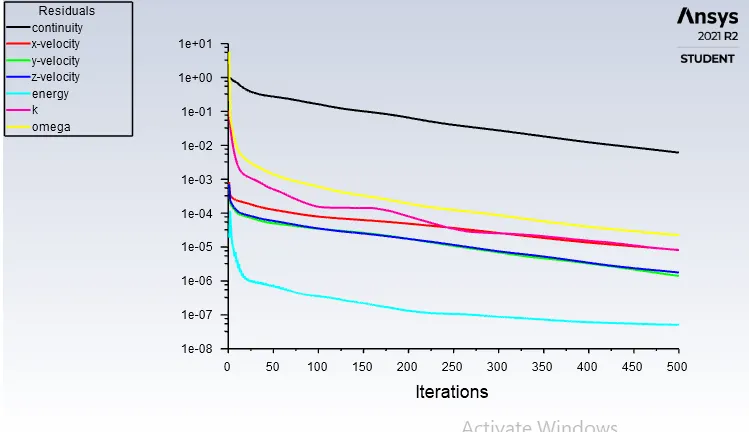
Residual Plot
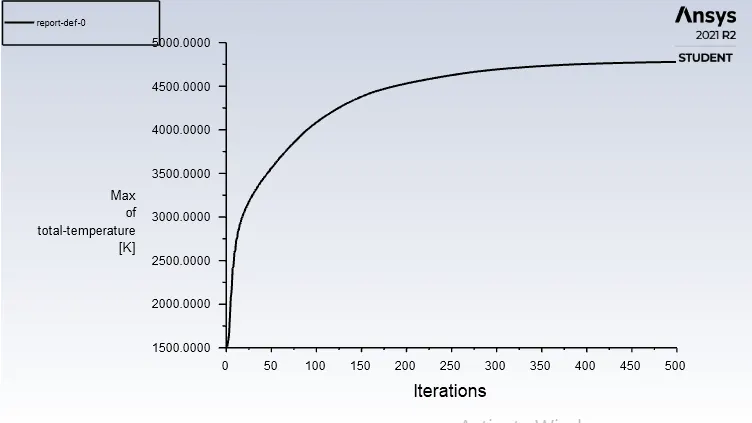
Temperature graph
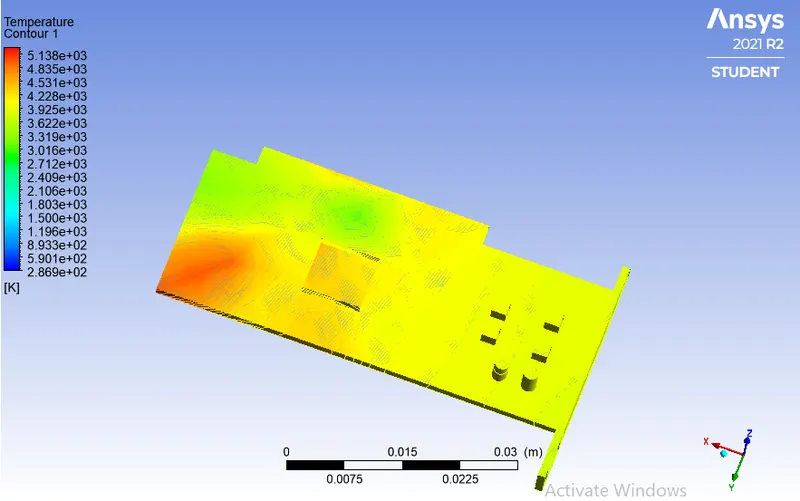
Temperature contour
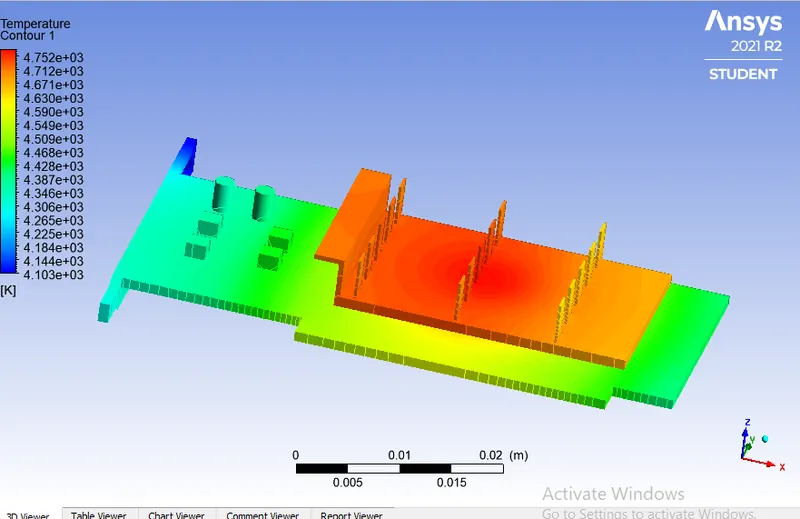
Hotspot
Case 2
Velocity: 3m/s
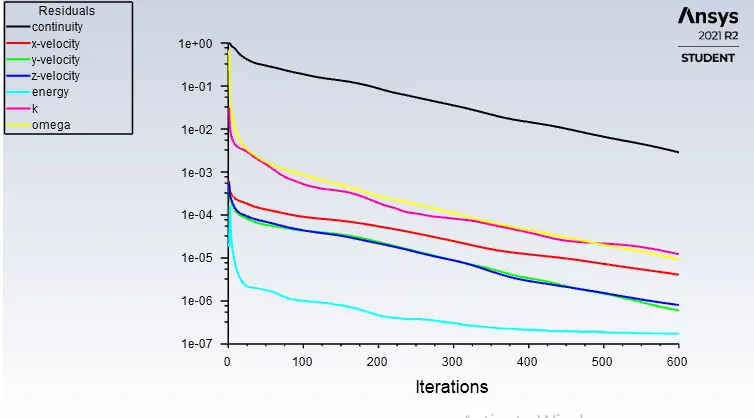
Residual Plot
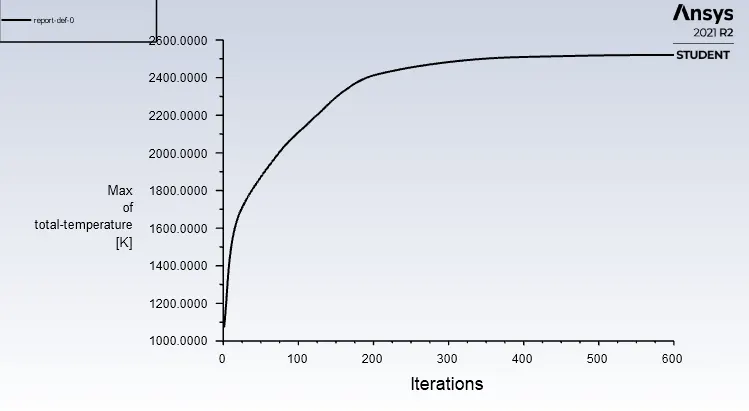
Temperature graph
Temperature contour
Hotspot
Case 3
Velocity: 5 m/s
Residual Plot
Temperature graph
Temperature contour
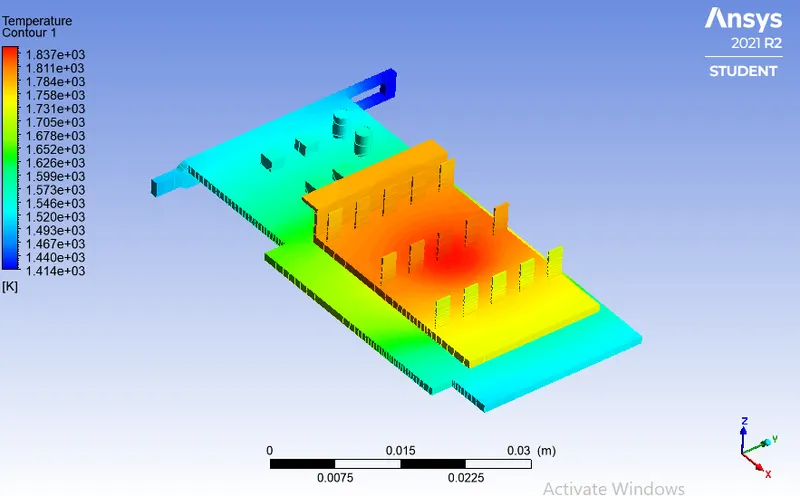
Hotspot
Calculations:
Heat generated per unit volume= heat generated/volume of the processor
Volume of processor=`6.4 ×〖10〗^(-8)`
Heat generated by processor= 300W
Convection:
`Q^.=hAΔT`
`A= 4(8x1) = 32mm^2=3.2×〖10〗^(-5) m`
`T_2=`temperature of processor
`T_1=` temperature of the surrounding air= 300K
Case1
Velocity= 1 m/s
`h=Q/A(T_2-T_1 ) =2093.5 W/m^2 K`
Case2
Velocity = 3m/s
`h=Q/A(T_2-T_1 ) =4228.6W/m^2 K`
Case3
Velocity = 5 m/s
`h=Q/A(T_2-T_1 ) =6032.8 W/m^2 K`
Table of comparison
|
Velocity (m/s) |
Max Temperature (K) |
Heat Transfer Coefficient (`W/m^2 K`) |
|
1 |
4778 |
2093.5 |
|
3 |
2517 |
4228.6 |
|
5 |
1854 |
6032.8 |
Conclusion:
From the above results we can conclude that,
- The maximum temperature and Heat Transfer Coefficients for different velocities were evaluated and compare. It was found that as the velocity increases the temperature of the processor decreases and Heat Transfer Coefficient increases, as the higher velocity cools down the processor quickly which results in faster heat transfer between solid and fluid due to convection.
- The convergence of the solution can be seen from the temperature and residual graph as the graph was constant after some iteration and maximum temperature value was constant.
- The potential hotspot was found on and near the processor as the main source of heat generation was the processor itself.
References:
[1] https://www.comsol.com/blogs/conjugate-heat-transfer/
[2] https://en.wikipedia.org/wiki/Graphics_card#Parts
[3] https://www.quora.com/What-are-the-raw-materials-used-in-making-a-graphics-card-for-a-PC