STRETCH RATIO CALCULATION BY COMPARING THE ELFORM (-2,-1,1,2) WITH OGDEN_MATERIAL MODEL. USING LS DYNA
OBJECTIVE
To perform tensile test on a ogden material cubic block to calculate stretch ratio for different element formulation and to plot the stress vs stretch ratio plot and Compare the results for the simulation using ELFORM = 1, 2, -1, -2.
PROCEDURE
Create a block of 10mmx10mmx10mm dimension with 10 elements for each direction and use the material card attached (Ogden_Material.k).
Define boundary condition using NODE_SET.
Create a section using SOLID_SECTION card.
The simulation time is set using CONTROL_ TERMINATION card.
create output files by using database keyword for ASCII and BINARY D3PLOT entities.To calculate the strain we need to enable database binary extent, after defining all entities save the keyword file.
RESULT
POST PROCESS IN LS PREPOST
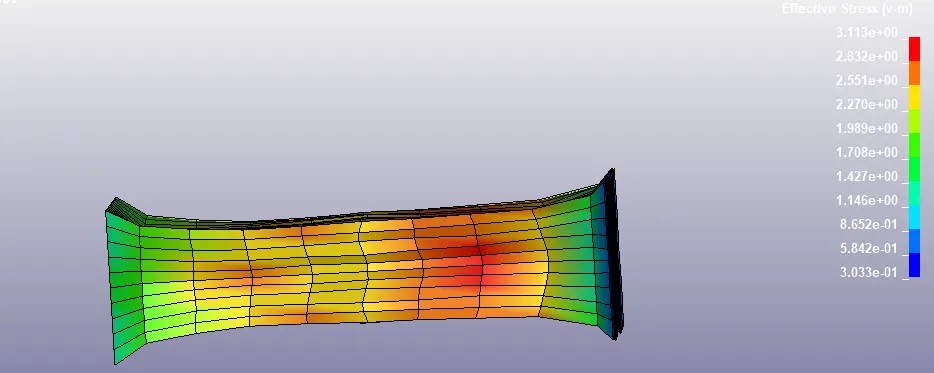
GRAPHS
ELEMENT FORMULATION -2
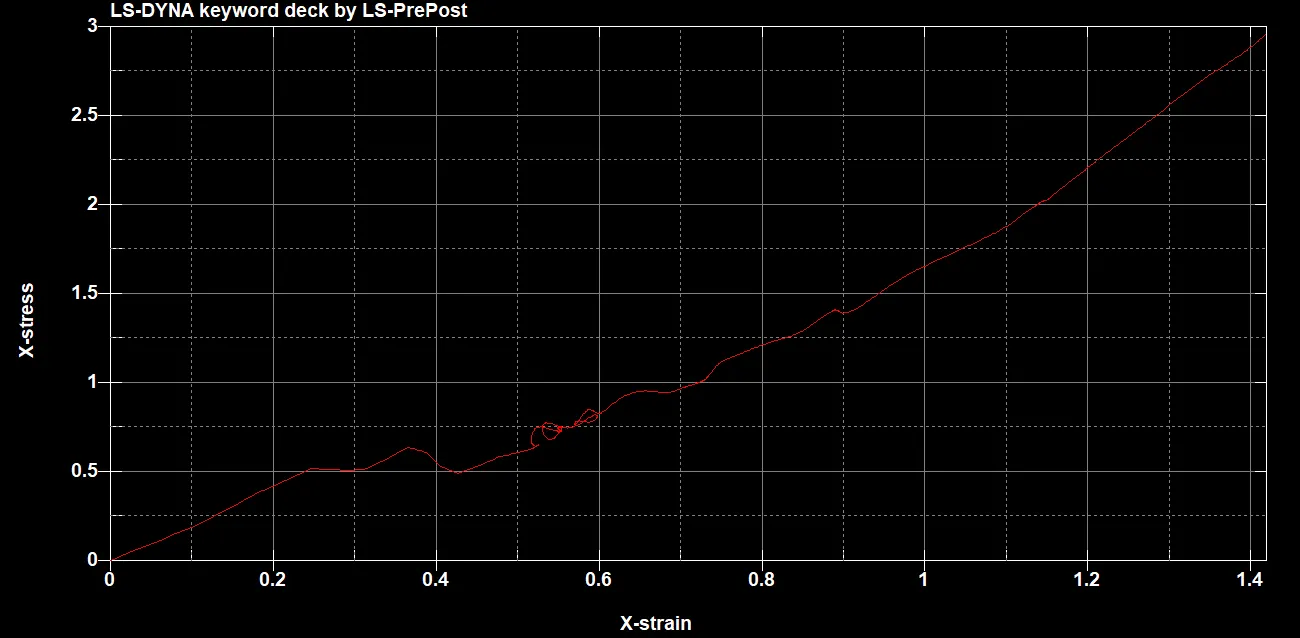
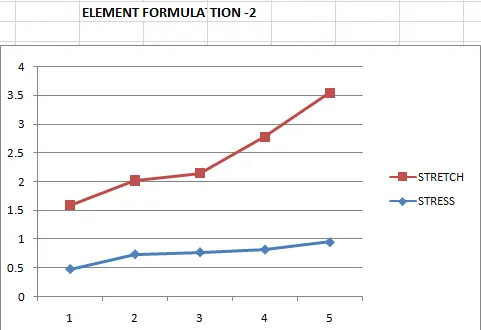
Above graph shows the when stress increases correspondingly strain also increases it obeys hooks law.
stretch ratio is the difference between final length and intial length, stretch ratio also increases when stress increases.
stretch ratio=1 + engineering strain
engineering strain=exp(strain)-1
engineering stress=stress/stretch
stress and strain values taken from stess and strain graphs.
ELEMENT FORMULATION -1
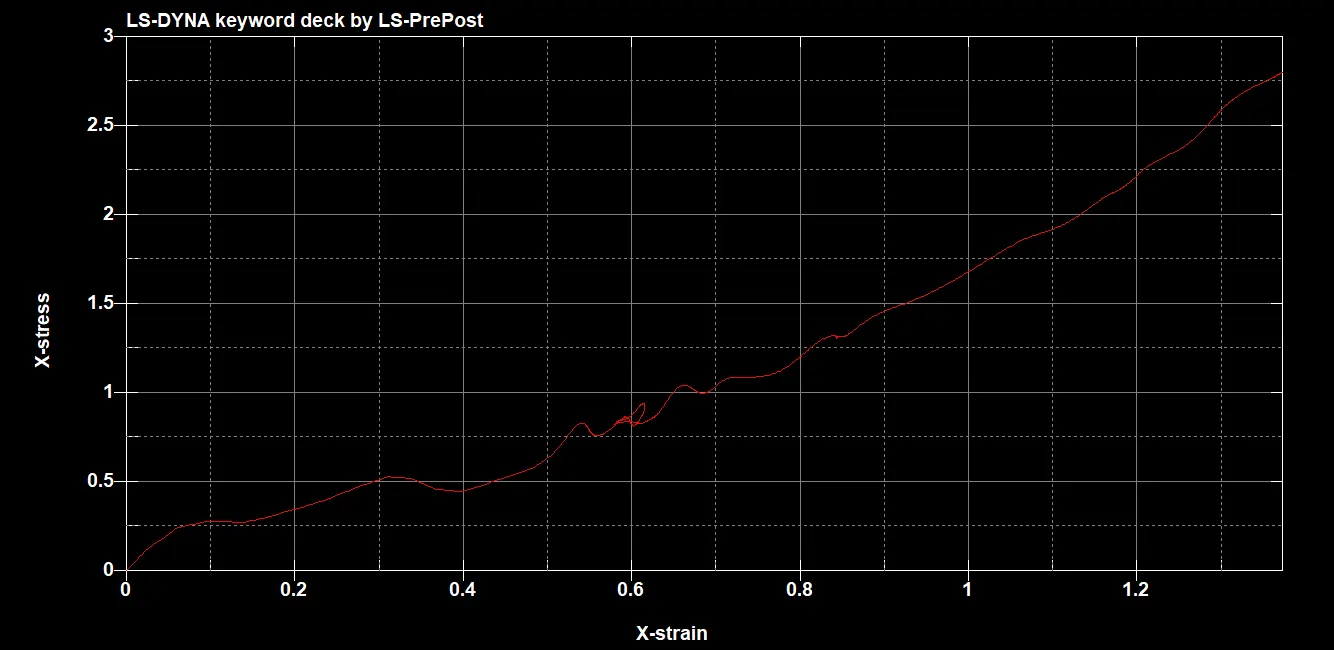
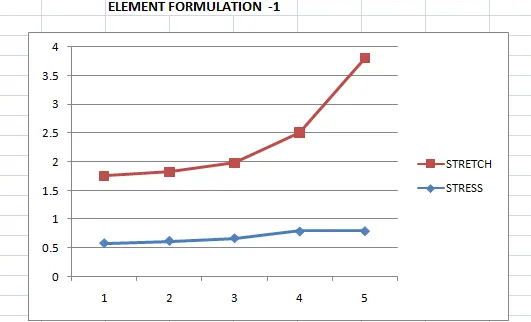
Above graph shows the when stress increases correspondingly strain also increases it follows hooks law.
stretch ratio is the difference between final length and intial length, stretch ratio also increases when stress increases.
ELEMENT FORMULATION 1
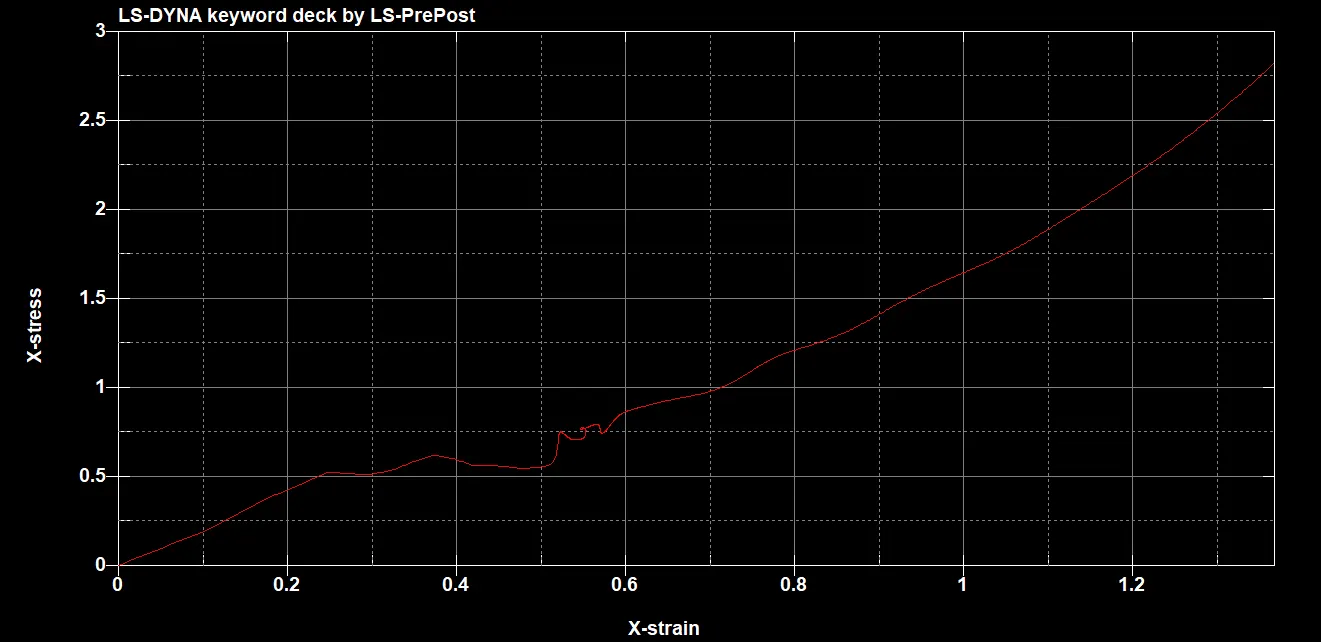
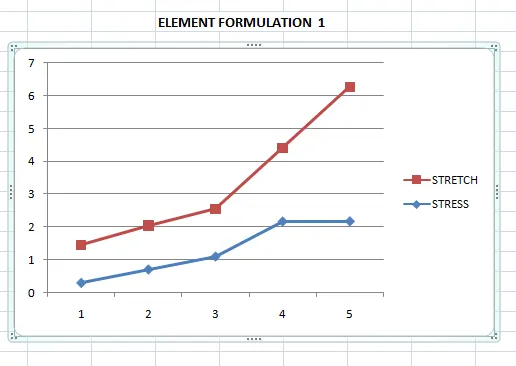
Above graph shows the when stress increases correspondingly strain also increases it follows hooks law.
stretch ratio is the difference between final length and intial length, stretch ratio also increases when stress increases.
ELEMENT FORMULATION 2
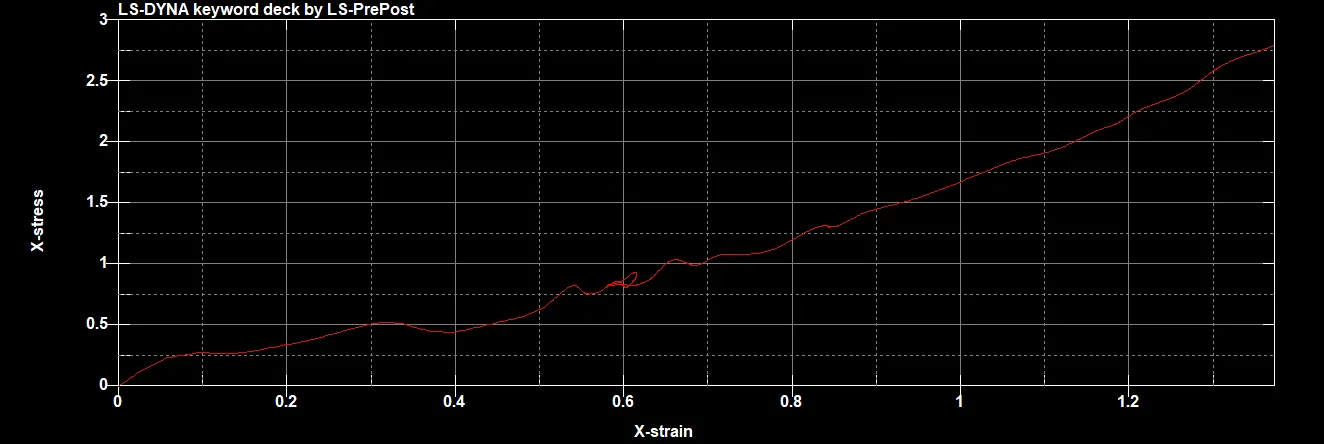
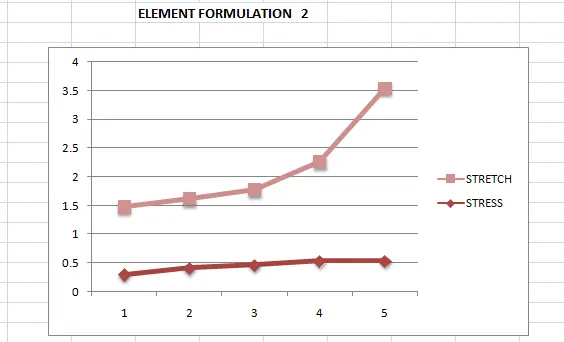
Above graph shows the when stress increases correspondingly strain also increases it obeys hooks law.
stretch ratio is the difference between final length and intial length, stretch ratio also increases when stress increases.
Comparison
1. Using different element formulation it shows that the simulation time varies.stretch ratio graph clearly shows that there is slight variation in stress and strain values .
2.when stress increases correspondingly strain also increases.
3.The graphs clearly shows that by comparing element formulation -1,-2,2,1. all graphs are similar there is no much difference.
conclusion
The different element formulation are compared by doing tensile test.all graphs are similar but slight variations in values.