Week 5 Battery characteristics using drive cycle
Aim:
To Simulate generic battery model charge discharge using UDDS data.
Software used:
MATLAB R2020a (Simulink)
Drive cycle:
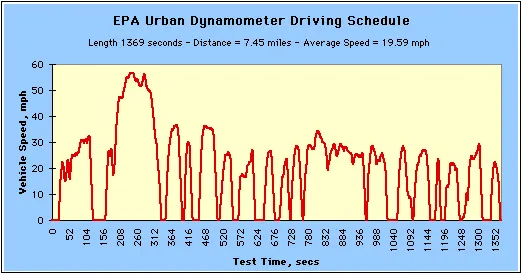
A driving cycle is a series of data points representing the speed of a vehicle Vs time. Driving cycles are produced by different countries and organizations to assess the performance of vehicle in various ways, as for instance fuel consumption, electric vehicle autonomy and polluting emissions.
Another use for drive cycles is in vehicle simulations. Especially they are used in propulsion system simulations to predit performance of IC engines, transmissions, electric drive systems, batteries, fuel cell systems and similar components.
UDDS stands for Urban Dynamometer Driving Schedule, and refers to a United States Environmental Protection Agency mandated dynamometer test on fuel economy that represents city driving conditions which is used for light duty vehicle testing.
Though it was originally created as a reference point for fossil fueled vehicles, it is also used to give estimates on how many miles an electric vehicle will travel on a single charge.
Reference UDDS drive cycle: https://drive.google.com/file/d/1nF3mllpsY7j7ejqudDfoBmBJT0LHCdj3/view?usp=sharing
Genetic Battery source:
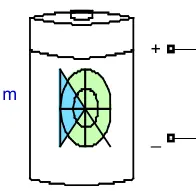
The Battery block implements a generic dynamic model that represents most popular types of rechargeable batteries.
This figure shows the equivalent circuit that the block models.
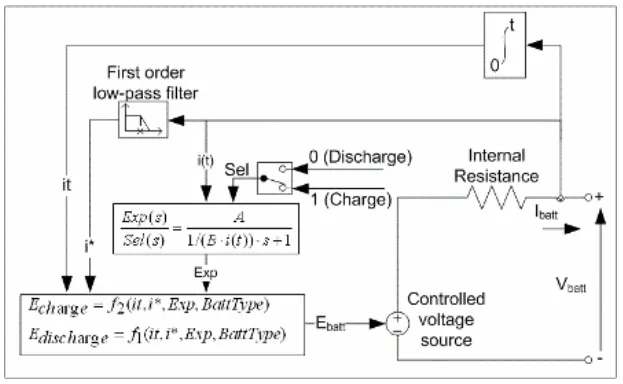
Equivalent circuit
Charge and Discharge Characteristics:
The circuit parameters can be modified to represent a specific battery type and its discharge characteristics. A typical discharge curve consists of three sections.
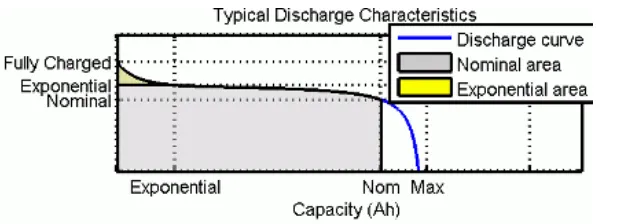
The first section represents the exponential voltage drop when the battery is charged. The width of the drop depends on the battery type. The second section represents the charge that can be extracted from the battery until the voltage drops below the battery nominal voltage. Finally, the third section represents the total discharge of the battery, when the voltage drops rapidly.
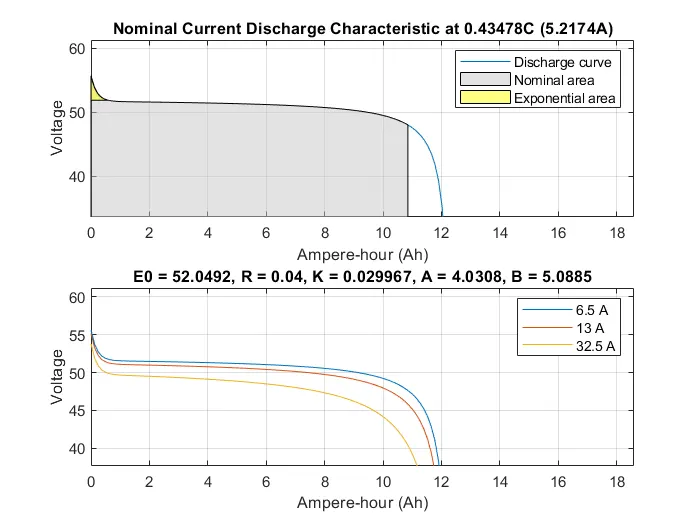
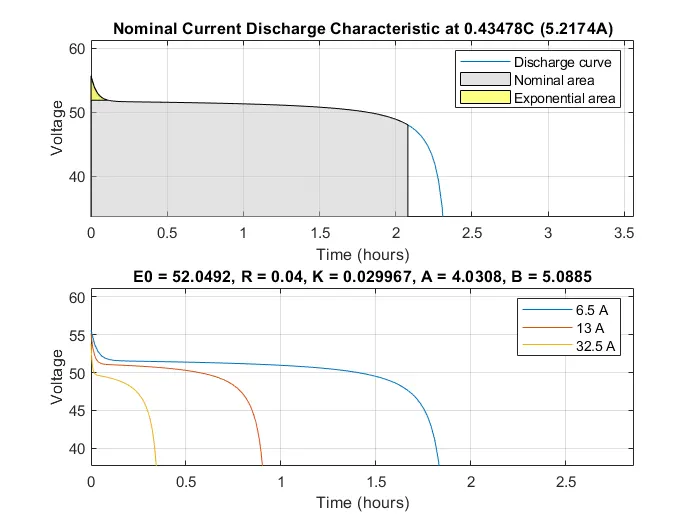
This plots shows the Voltage Vs Time and Capacity for discharge currents 6.5A, 13A and 32.5A
Battery parameters:
| Battery type: | Lithium-ion |
| Nominal Voltage: | 48 V |
| Rated capacity: | 12 Ah |
| Initial state of charge: | 100% |
| Battery time response: | 1400 Sec |
Simulink model:
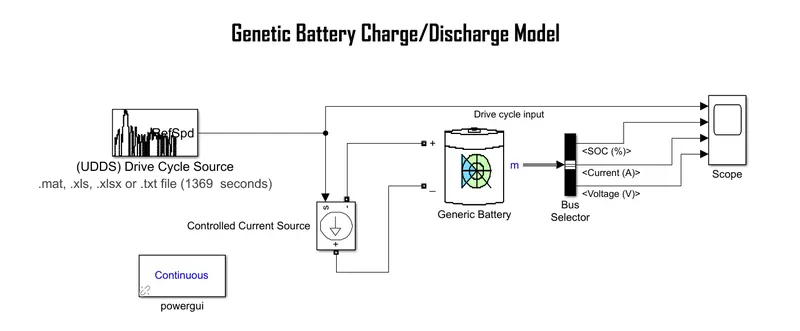
Blocks used:
Generic battery: Used as power source.
Drive cycle source: For the reference input Speed Vs Time data (UDDS)
Controlled current source: Converts the Simulink input signal into an equivalent current source. The generated current is driven by the input signal of the block.
Scope: To display the results (graphs)
Powergui: To Set simulation type, simulation parameters, and preferences.
Procedure:
- The positive terminal of the battery is connected to the -ve terminal of the controlled current source and Negative terminal of the battery is connected to the +ve terminal of the controlled current source. Through 'm' - SoC (%), Current (A) and Voltage (V) is plotted. And Drive cycle is connected to the 'S' to convert the Simulink input signal into an equivalent current source.
- When the simulation starts the drive cycle input and battery power flows through the controlled current source, by that will detect the state of charge of a battery.
- The powergui sets the simulation type, simulation parameters, and preferences. Here the simulation type is Continuous.
Results:
USSD Drive cycle Input Plot:
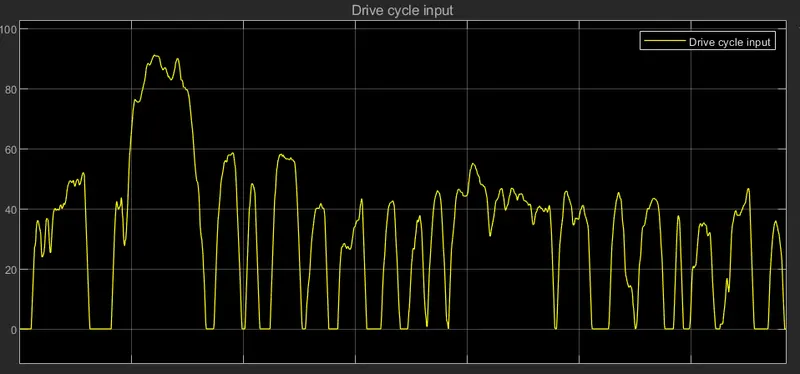
- This plot indicates the Speed (Kmph) Vs Time (sec), Maximum speed is approx.90 kmph.
Current Plot:
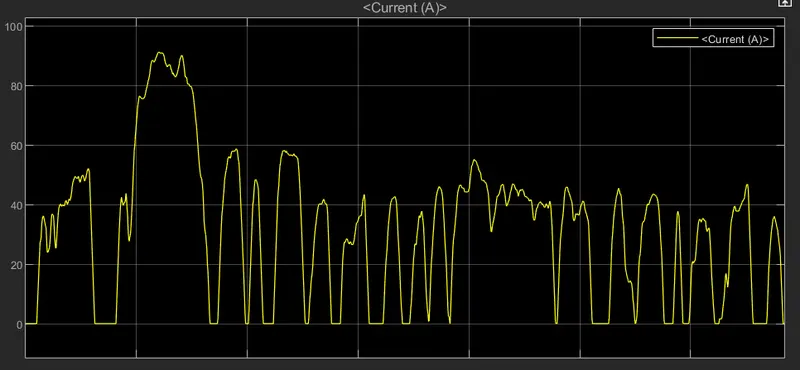
- This plott indicates the Current (A) Vs Time (Sec). Current is varing with respect to the reference speed.
Voltage Plot:
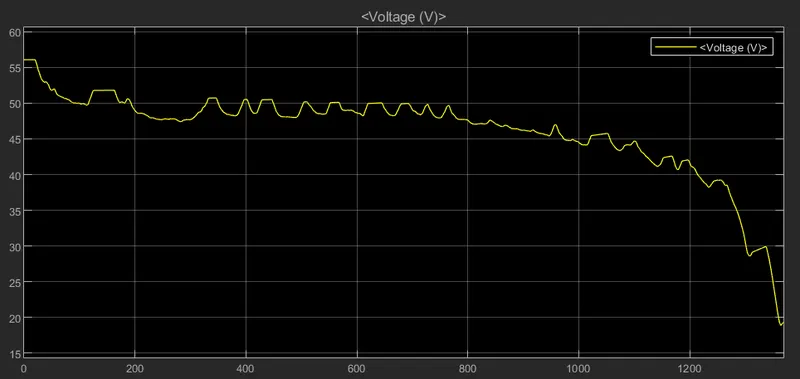
- This plot indicates the voltage (V) Vs Time (sec). The voltage of generic battery is fluctuating gradually and reducing as the cycle proceeds till 1300 sec and after that it droped suddenly to 20V.
SoC%:
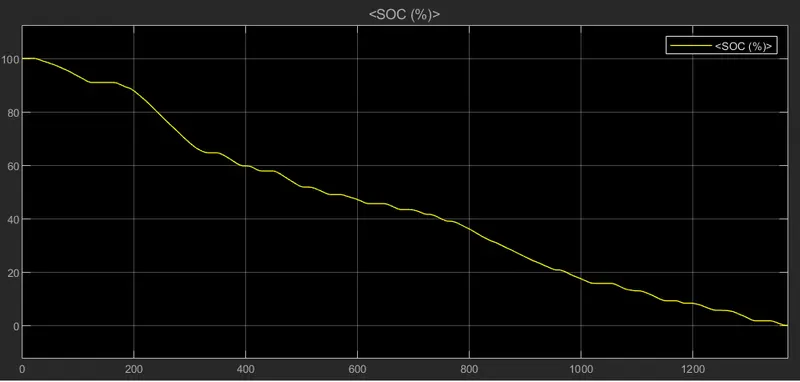
This plot shows the State of charge of a battery (Charging/Discharging) as the cycle prodeed. The initial SoC is 100%, as the cycle time increased the battery get draind out and in between it also get charged as shown in the above plot.
Conclusion:
Hence, Simulated the generic battery model charge discharge using UDDS data.