Week - 4 - Crash Box Simulation
REPORT 4
AIM:
To simulate the crash test for a crash box having a different thickness of 1.2 and 1.5 mm into the rigid wall at 50 kmph and to obtain the required output data given below.
OUTPUT DATA :
- Input. k file and output files (d3plot,glstat,sleout,rcforc)
- Animation of the final simulation
- The cross-sectional force generated in the middle of the crash box (along its length).
- Acceleration plot of a node in the middle of the crashbox (along its length)
- Maximum directional stress and strain along the length of the crashbox (X strain, Y strain etc)
- Plot of all energies (total,internal,kinetic,hourglass,sliding)
- Compare the accelerations and stress/strain plots of 1.2 / 1.5 mm crash boxes.
THEORY:
A crash box is energy, structure that is equipped at the front end of the car for absorbing the energy during the crash. the crash box is very helpful during a low-speed collision such that it reduces the load impact and reduces the impact of the load to other components. Additionally, it also reduces the repair cost of the other automobile components. The crash boxes are mounted near the bumper of the car and during the impacts, it takes the load axially and provides safety and comfort during the impact.
PROCEDURE:
- Initially, open the new_crash_box.k file in the LS -prepost.
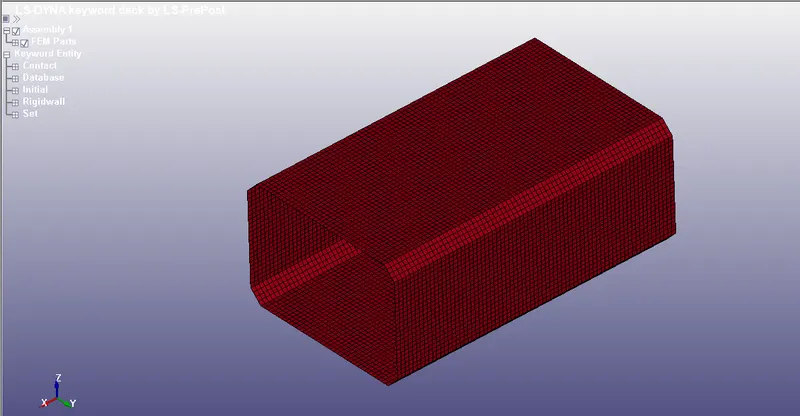
Fig, shows the component crash box with the meshed shell elements
- The unit system followed here is gm-mm-ms
- Then we create a shell section for the crash box and the shell section can be created using model >keyword manager>section>select shell section.
- Now, thickness 1.2 mm and Element formulation =2, and SECID is provided for the shell section.
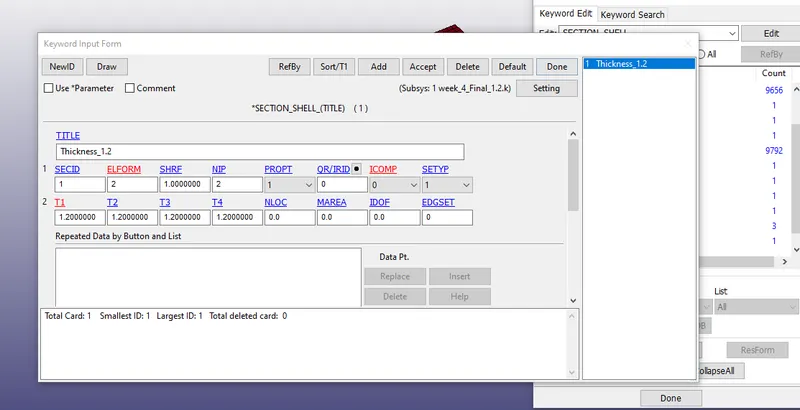
Fig, shows the section shell card defined
- once, the shell section for the crash box is defined and now the material cardfor the crash box is defined
- The material card is defined by using Model & part >keyword manager >MAT>024-LINEAR-PIECEWISE-PLASTICITY, the material card is chosen.
- Then the material steel is assigned with the properties such as Young's modulus, Poisson ratio, yield stress value, and other parameters are assigned.
Density = 0.00783 gm / mm^3
poisson ratio = 0.33
Young's Modulus = 2.1*10^5 gm / mm.ms^2
Yeild strength = 210 gm/mm.ms^2
Tangent modulus = 1400 gm/mm.ms^2
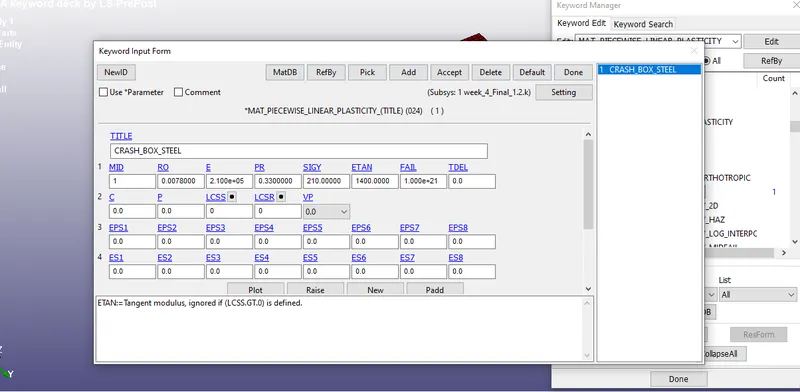
Fig, shows the linear_Piecewise_Plasticity card is defined and the properties of the steel are assigned.
- Then go to the part and assign the section ID and Material ID to the crash box component.
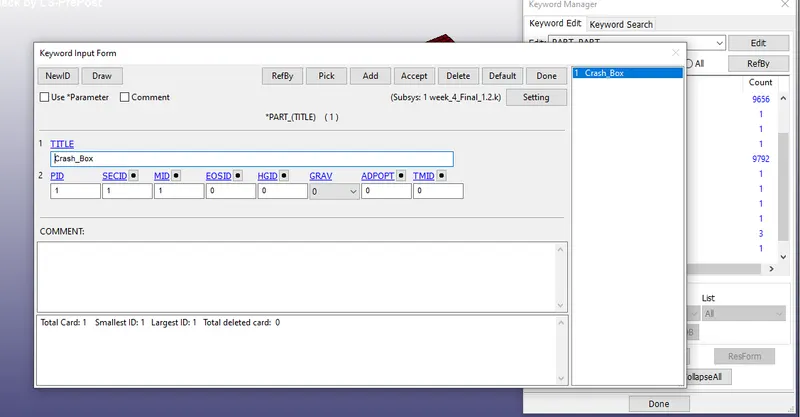
Fig, represents the Material card ID and section ID has been defined to the PART ID
- Then, we create a rigid wall by using create entity option and with 1n +NL option.
- The rigid wall is created and translated at 15 mm away from the crash box.
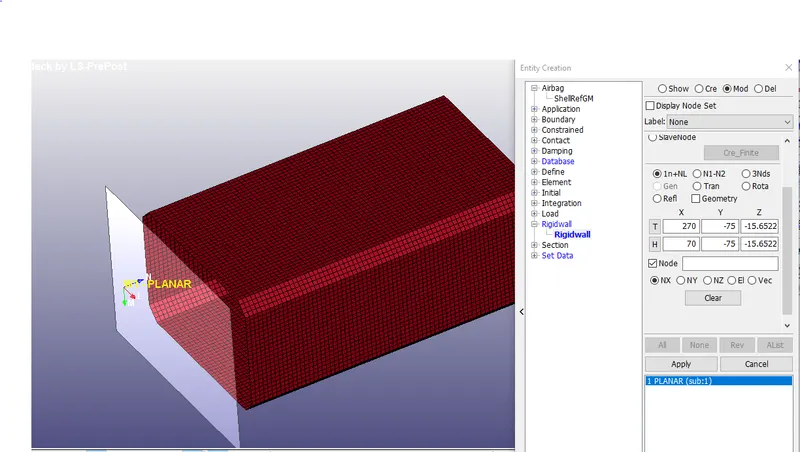
Fig, shows the creation of a rigid wall with a 1+NL option.
- The Normal should be in the opposite direction to the velocity of the crash box, such that it should offer a reaction force during the impact and avoid the penetration of the crash box into the rigid wall.
- If the Normal and velocity of the crash box are in the same direction, penetration of the crash box onto the rigid wall would occur.
- Then, the next step is to create an initial velocity.
- Before doing that, in the create entity option > SET-NODE, selected the entire area of the nodes in the crash box and create an NSET ( a node set). The purpose of creating NSET is to define the initial velocity for the crash box.
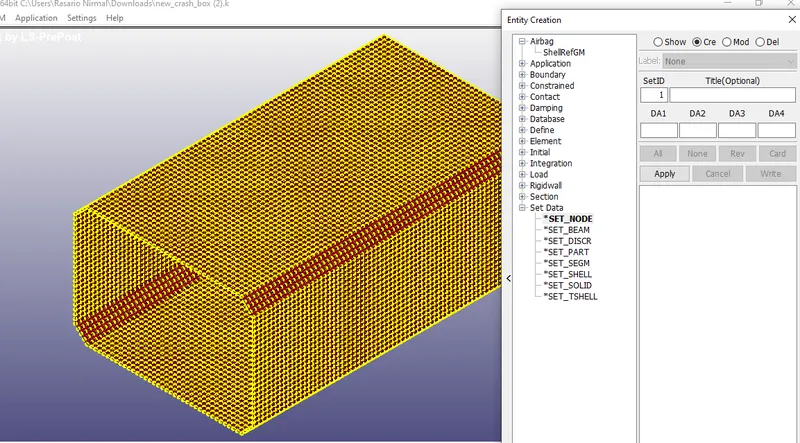
Fig, shows the creation of NODE SET for assigning the initial velocity for the crash box.
- once, the node-set for the velocity is created, the velocity of 50kmph(13.889 mm/ms) is assigned by model & part >keyword manager>initial> velocity is defined.
- Now, the initial velocity is assigned in the initial velocity card.
- The velocity of 13.889 mm/ms is assigned in the x direction.
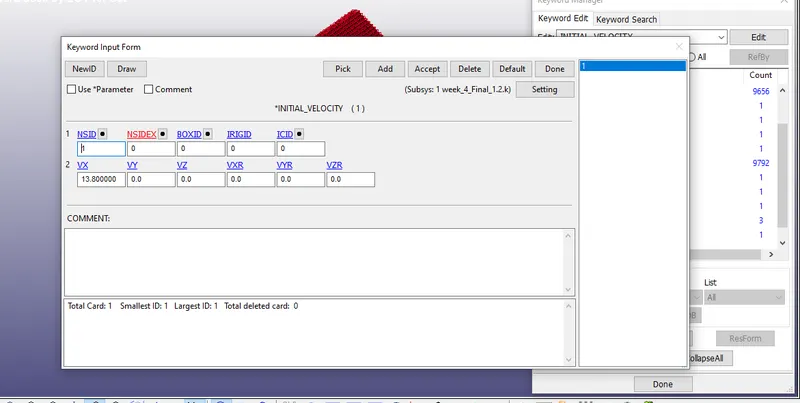
Fig, represents the velocity assigned in the x-direction
- Then, we need to create a contact by using Model & part>keyword manager > contact > automatic single surface contact.
- In the automatic single surface contact only, the slave set id is defined and we don't need to define the master set ID.
- In the automatic single surface contact , the crash box acts as a slave and Master and we can define only one SET ID either Master or slave. In this case, SSID is defined and in the SSID part set ID of the crash box is assigned.
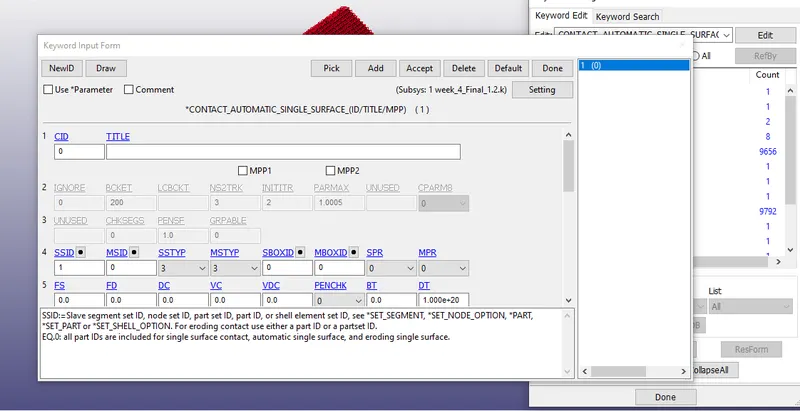
Fig, shows the assigning of SSTYP and SSID for Automatic single surface contact.
- Next, the termination is assigned by the *CONTROL_TERMINATION card and here the end time can be calculated by taking the ratio between distance and the velocity.
- The distance between the rigid wall and the crash box is taken as 15 mm and the velocity given for the crash box is taken as 13.8889 mm /ms.
End time = 15 / 13.8889 = 1.079 mm/ms
- In order to extend the simulation and to know what is happing during the bouncing back of the crash box, an extra time of 4 ms is provided.
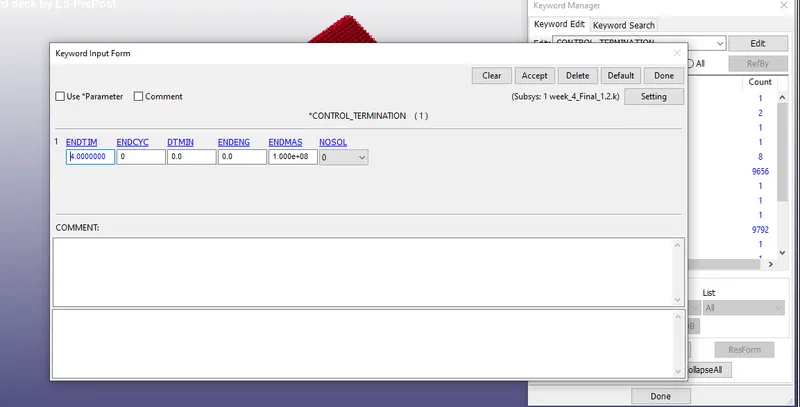
Fig, shows the assignment of End time
- Finally, the required output files such as (d3plot, glstat,sleout, rcforc)is created in the Database >ASCII Option, and the time step of 0.1ms is provided for each output files that are provided above.
- The same procedure is done for the crash box by increasing the thickness to 1.5 mm and then simulated and the output data is obtained in a similar fashion.
Now, the following output files are obtained by *DATABASE card and a time step of 0.1 ms is assigned to each output card.
DATABASE_BINARY_D3PLOT = used for animation process
DATABASE_ASCII_NODOUT = used to find nodal motions
DATABASE_ASCII_GLSTAT= used to find global statistics and energies
DATABASE_ASCII_RCFORC= used to find resultant contact interface forces
DATABASE_ASCII_MATSUM= used to find material energies
DATABASE_ASCII_SLEOUT= used to find contact interface energies
DATABASE_ASCII_SECFORC= used to find the cross-section forces data
- The cross-section force can be obtained by using create entity option and in that, the node-set and shell set is created by picking the area of nodes using *SET_NODE and picking the area of shell elements by *SET_SHELL respectively.
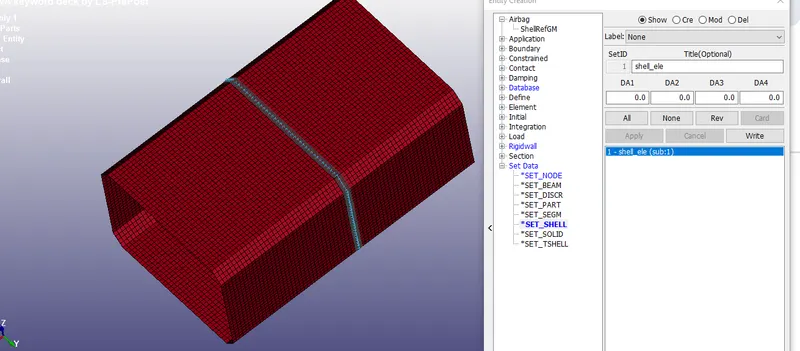
Fig, shows crating of cross-section by picking Nodes and elements
- The acceleration plot of the node in the middle of the crash box can be determined by picking a node in the middle by using the *DATABASE_HISTORY_NODE option.
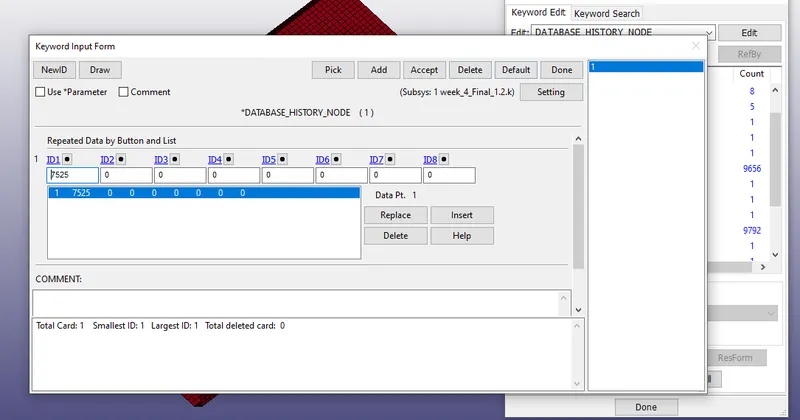
Fig, shows picking a node ID for generating an acceleration in the middle of the crash box by *DATABASE_HISTORY_NODE.
- Finally, the .k file is saved and the file is opened in the LS- RUN and the problem is solved by using LS-RUN.
- The same procedure is repeated by increasing the thickness of the crash box to 1.5mm.
LS -RUN solves the problem
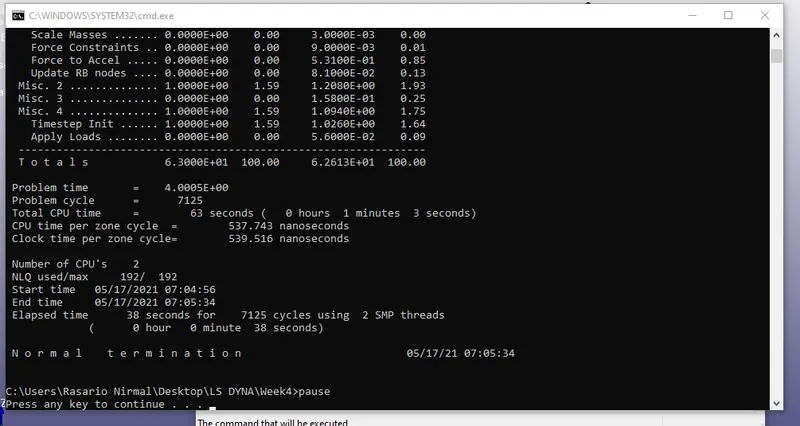
OUTPUT RESULTS
ANIMATION OF THE FINAL SIMULATION
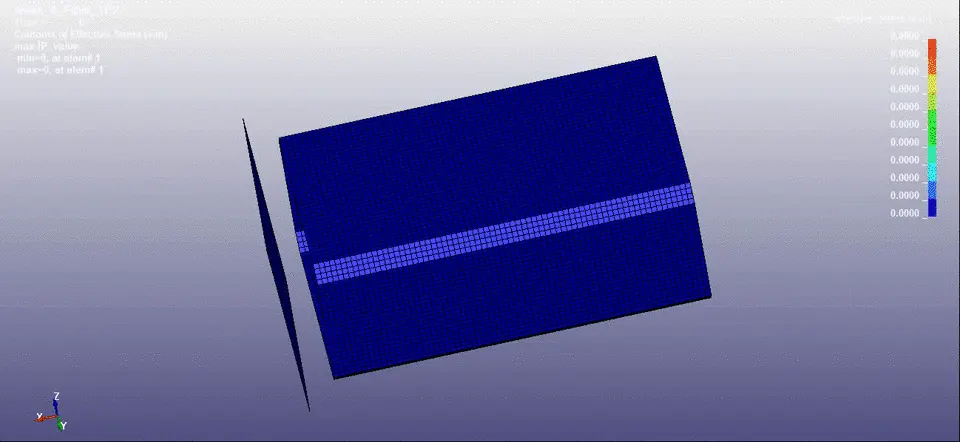
VON -MISES STRESS ANIMATION FOR CRASH BOX 1.2 MM
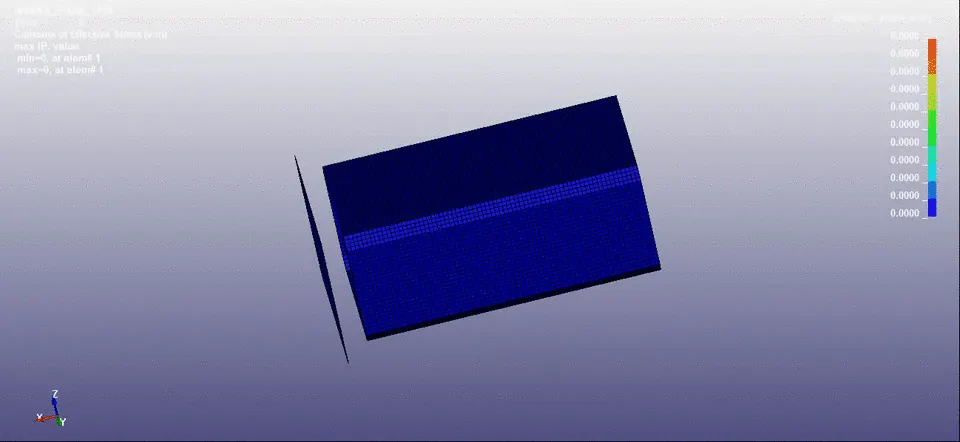
VON -MISES STRESS ANIMATION FOR CRASH BOX 1.5 MM
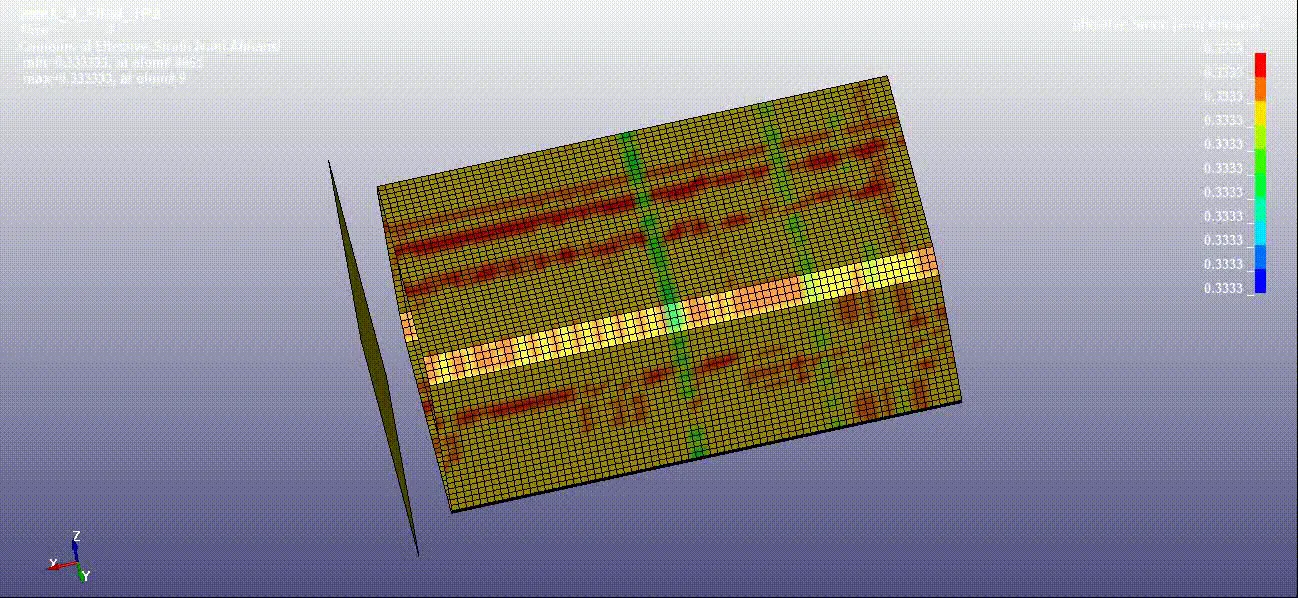
VON -MISES STRAIN ANIMATION FOR CRASH BOX 1.2 MM
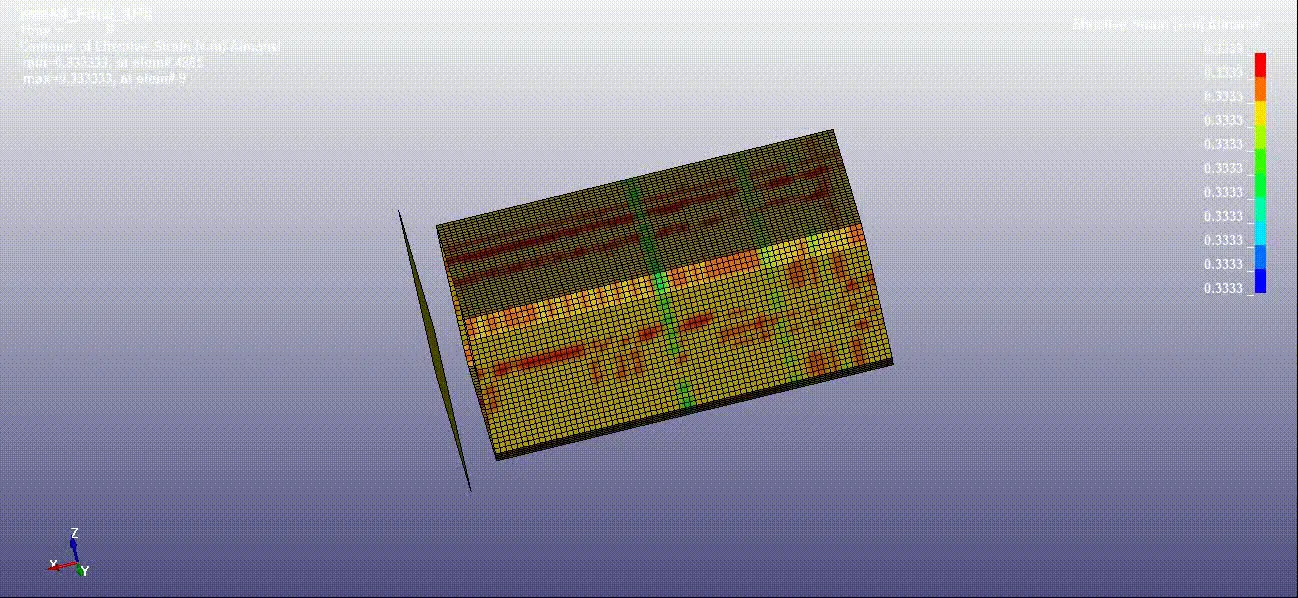
VON -MISES STRAIN ANIMATION FOR CRASH BOX 1.5 MM
CROSS-SECTIONAL FORCE GENERATED IN THE MIDDLE OF THE CRASH BOX
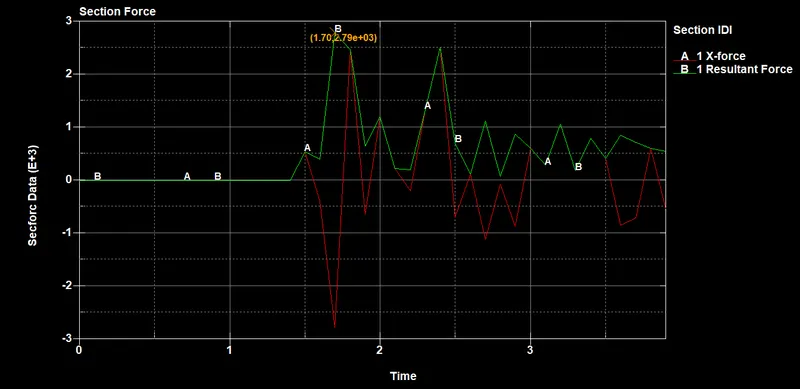
Fig (a), represents the cross-sectional force generated in the x-direction along with resultant force for 1.2 mm shell thickness for the crash box.
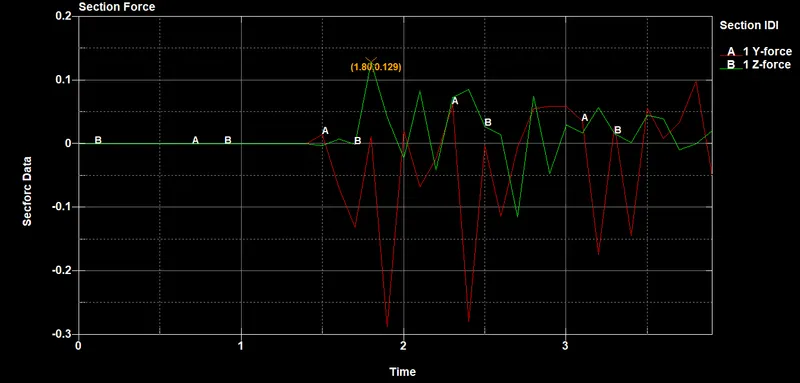
Fig (b), represents the cross-sectional force generated in the y & Z direction for 1.2mm shell thickness crash box
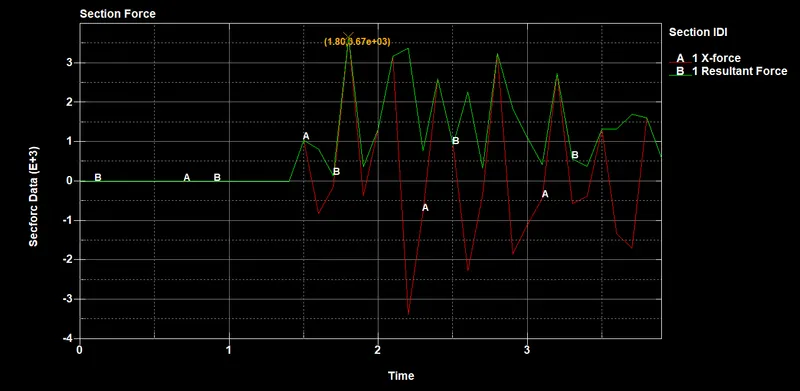
Fig(c), represents the cross-sectional force generated in the x-direction along with resultant force for 1.5 mm shell thickness for the crash box.
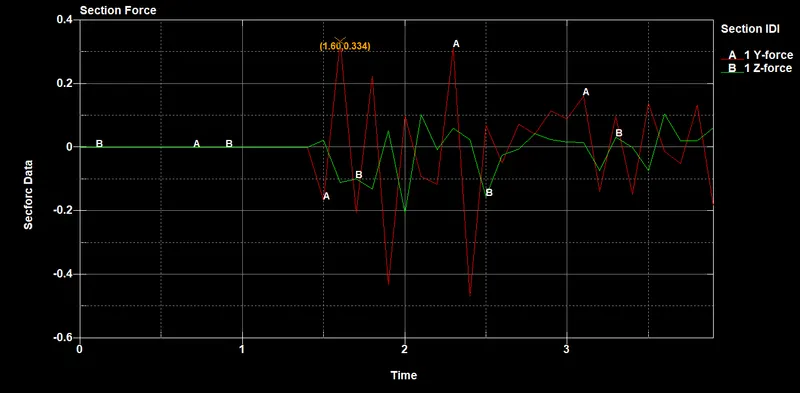
Fig(d), represents the cross-sectional force generated in the y & Z direction for 1.5mm shell thickness crash box
From fig (b) & fig (d), it is observed that the values of the cross-sectional force are negligibly small in the y & Z-direction since the velocity is given in the particular x-direction. The cross-sectional forces in the Y & Z are comparatively small when compared to the x-direction.
From, the figure (a) & (c), it is observed that the cross-sectional forces for the crash box having thickness 1.5 mm is comparatively higher than the crash box having a thickness of 1.2 mm. This is because of increase in mass increases the force (F=ma) and so, the crash box having a thickness of 1.5mm, experiences higher cross-sectional forces than compared to the crash box having 1.2 mm thickness.
Additionally, a resultant force is plotted to understand the effect of a single force which is equivalent to all the forces acting at the cross-section. It is evident that the resultant force for the crash box having 1.5mm thickness is comparatively larger than the crash box having 1.2 mm thickness.
ACCELERATION PLOT OF A NODE IN THE MIDDLE OF THE CRASH BOX
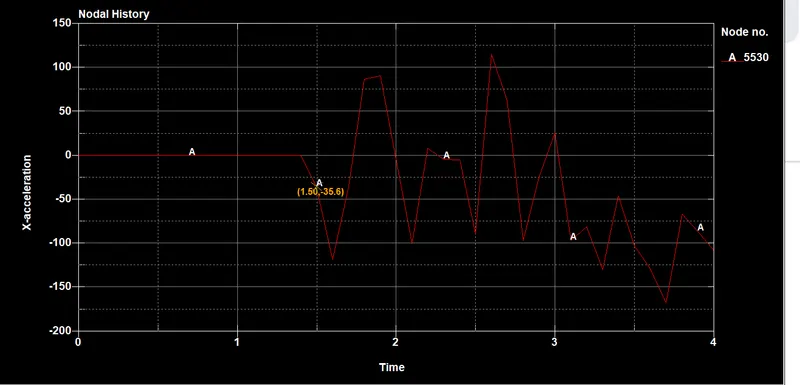
Fig(a), shows the x-acceleration plot of node 5530 for a crash box having 1.2 mm thickness
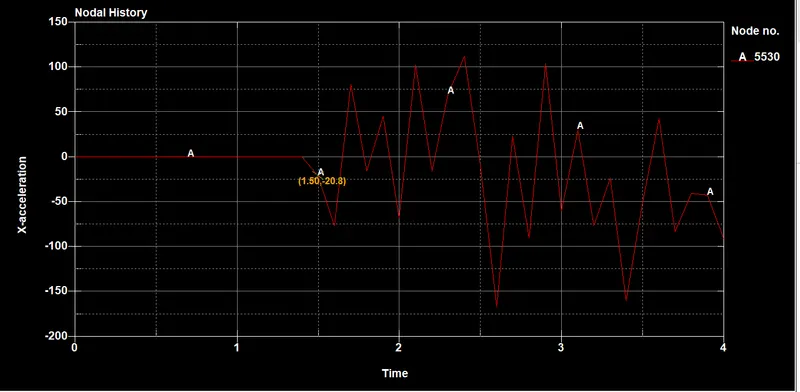
Fig(b), shows the x-acceleration plot of node 5530 for a crash box having 1.5 mm thickness
From figures (a) & (b), it is observed that the deacceleration occurs during the impact at 1.5ms and it is evident the crash box having a thickness of 1.5 mm thickness deaccelerated at a faster rate than the crash box having the thickness of 1.2mm. This is due to increases in the thickness of the crash box increases the deacceleration rate in a faster manner during the impact. After, the impact rebounce happens, and the crash box accelerates and deaccelerates until the end time.
MAXIMUM DIRECTIONAL STRESS
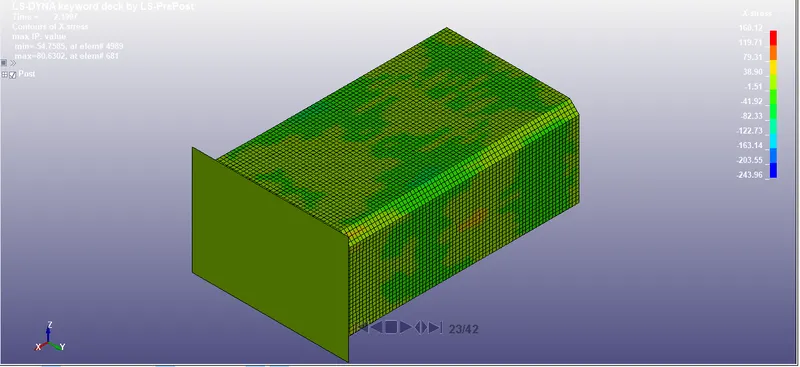
Fig (a) shows the Maximum directional stress in the x-direction for the crash box having 1.2 mm thickness
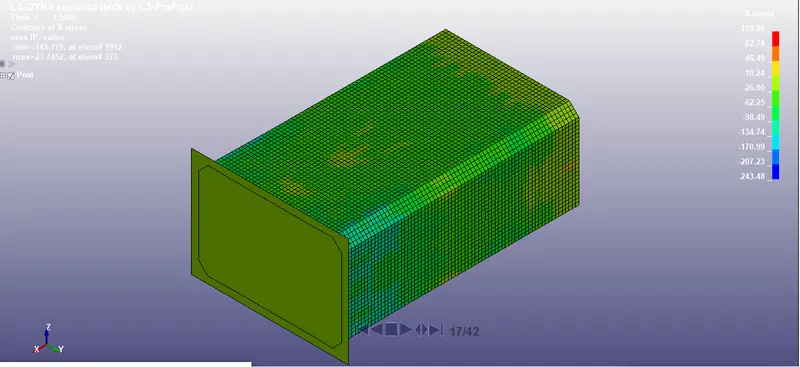
Fig (b) shows the Maximum directional stress in the x-direction for the crash box having 1.5mm thickness
From, the above figures (a) & (b), it is observed that the maximum directional stress for the crash box with a thickness of 1.5 mm having x stress value of 118.98 MPa is lower than the crash box with a thickness of 1.2mm which has (160.12 MPa). The value of stress in the crash box with a thickness of 1.5mm reduced since there is an increase in the thickness which also increases the cross-section. As we, know that the increase in cross-section area decreases the stress value.
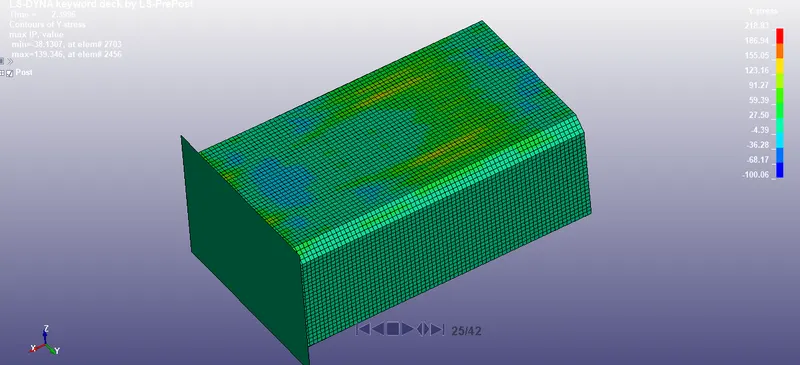
Fig (a) shows the Maximum directional stress in the Y-direction for the crash box having 1.2 mm thickness
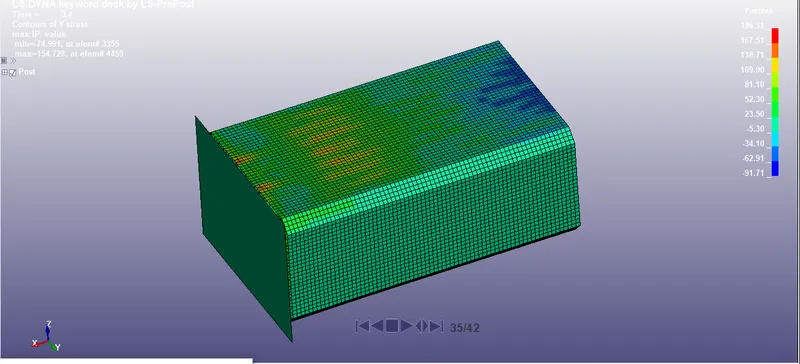
Fig (b) shows the Maximum directional stress in the Y-direction for the crash box having 1.5 mm thickness
From, the above figures (a) & (b), it is observed that the maximum directional stress for the crash box with a thickness of 1.5 mm having a Y stress value of 196.31 MPa is lower than the crash box with a thickness of 1.2mm which has (218.83). The value of stress in the crash box with a thickness of 1.5mm reduced since there is an increase in the thickness which also increases the cross-section. As we, know that the increase in cross-section area decreases the stress value.
MAXIMUM DIRECTIONAL STRAIN (X & Y)
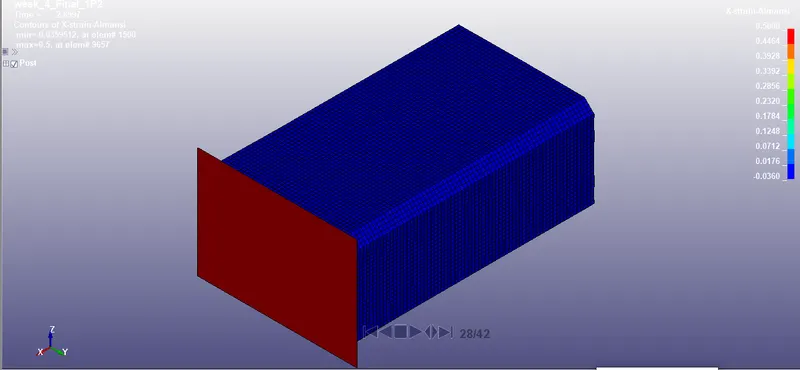
Fig (a) shows the Maximum directional strain in the X-direction for the crash box having 1.2 mm thickness
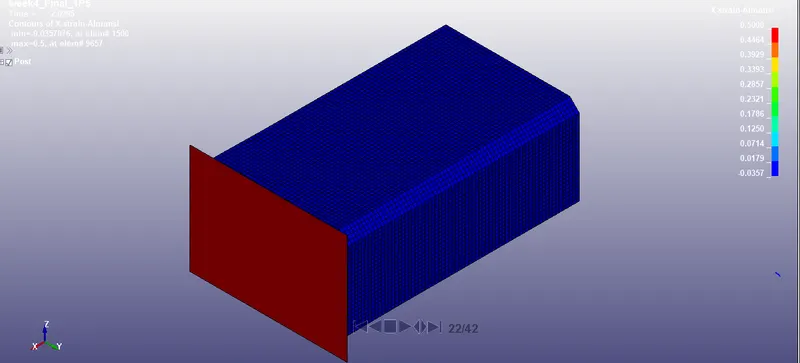
Fig (b) shows the Maximum directional strain in the x direction for the crash box having 1.5 mm thickness
From, Fig (a) and (b), it is observed that the x strain of both crash boxes is almost the same since there is only a slight change in the thickness for the crash boxes.
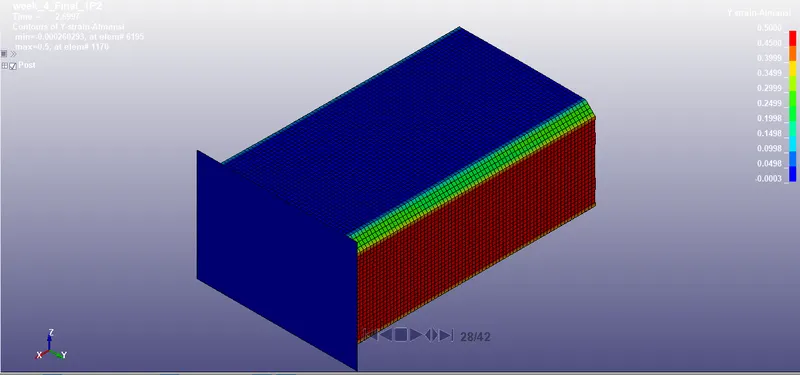
Fig (a) shows the Maximum directional strain in the Y direction for the crash box having 1.2 mm thickness
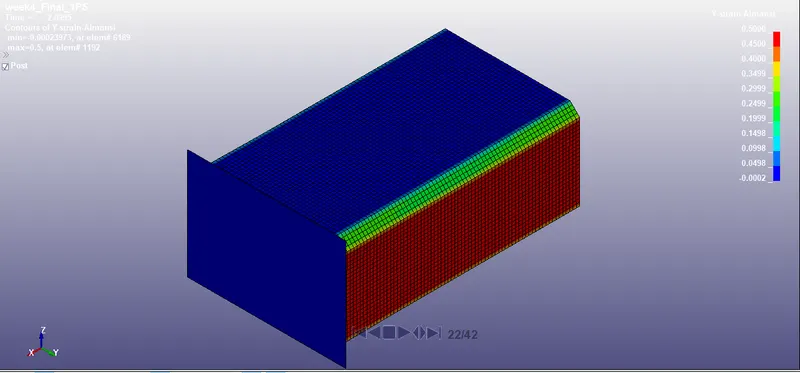
Fig (b) shows the Maximum directional strain in the Y direction for the crash box having 1.5 mm thickness
From, Fig (a) and (b), it is observed that the Y strain of both crash boxes is almost the same since there is only a slight change in the thickness for the crash boxes.
PLOT OF ALL ENERGIES
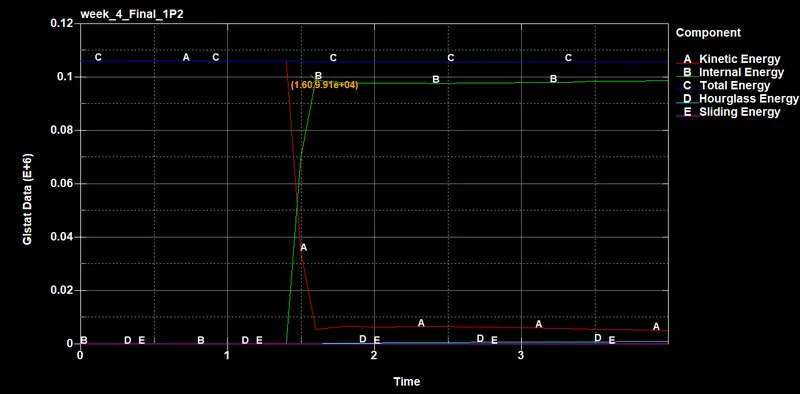
Fig (a) , represents, GLSTAT DATA Plot for the crash box (1.2mm thickness)
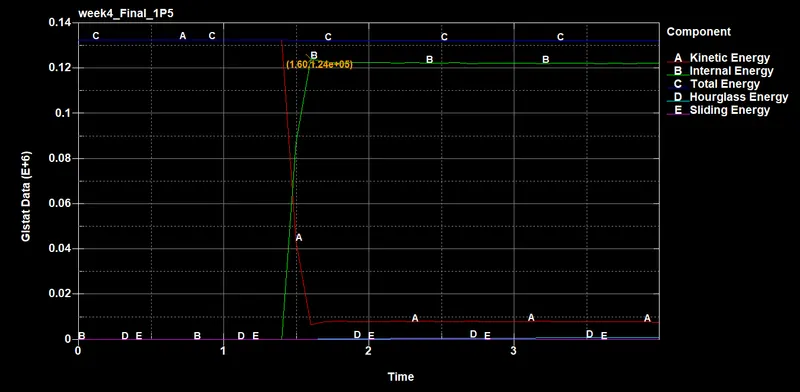
Fig(b), represents GLSTAT DATA Plot for the crash box (1.2mm thickness)
From, the figure (a) & (b) it is observed that the during the impact, the kinetic energies of the crash box drops down due to the impact and on the other hand, the internal energies of the crash box having 1.5mm thickness increases and this a due to the increase of thickness of the crash box which in turn increases the momentum of the crash box. Since the momentum is high when the crash box having a thickness of 1.5 mm hits the rigid wall, the kinetic energy drops down and it gets converted to internal energy. As we know, according to the law of conservation once energy gets converted into another form of energy. In this case, the kinetic energy gets converted into internal energy. Since the crash box (1.5mm thickness) has a higher momentum when it hits the internal energy is higher when compared to the crash box of 1.2 mm thickness. The crash box of 1.2 mm thickness has a lower momentum since its thickness is very small and so it has very little internal energy when compared to the crash box of 1.5 mm thickness. Additionally, in both cases of the crash box, the sliding and hourglass energies are negligible since sliding and contact surfaces are absent.
STRESS PLOT
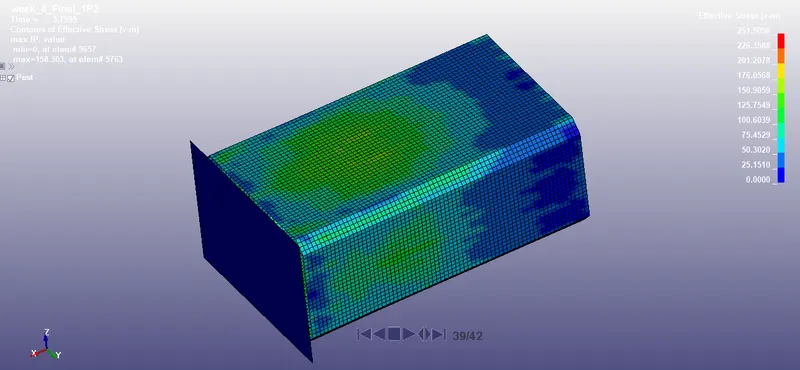
Fig(a), represents the von-mises stress of the crash box having 1.2 mm thickness
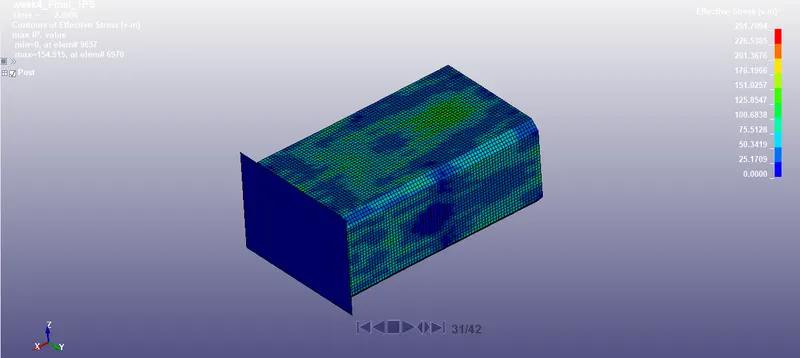
Fig(b), represents the von-mises stress of the crash box having 1.5 mm thickness
From, Fig (a) & (b) it is observed that the von-mises stress is slightly higher for the crash box of thickness 1.5 mm than the crash box of thickness 1.2 mm. It is also observed that the von-mises stress has exceeded the yield limit and it is evident the material has undergone some deformation. The von-mises stress is around 251.7094 Mpa for the crash box having 1.5 mm thickness and whereas the von -mises stress is around 251.5098 Mpa.
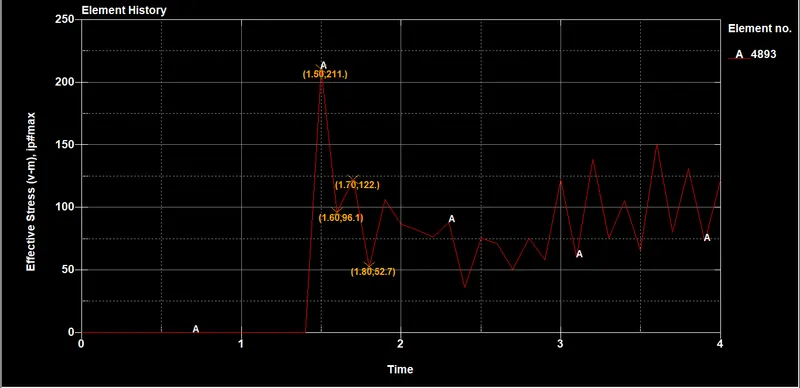
Fig(a), represents the Effective (v-m) of the crash box having 1.2 mm thickness
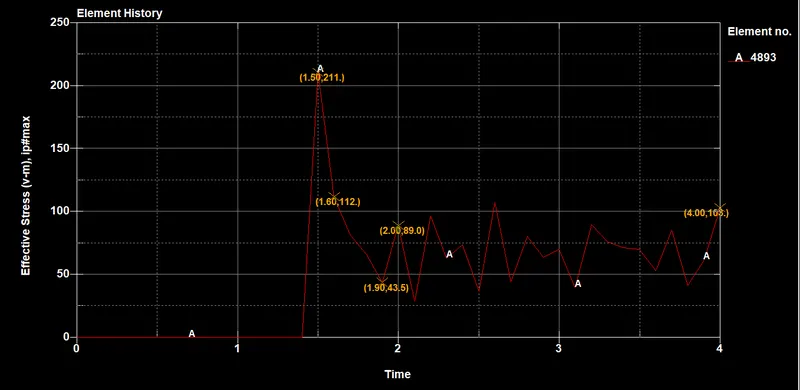
Fig(b), represents the Effective (v-m) of the crash box having 1.5 mm thickness
From, fig (a) & fig (b) it is evident that the effective von-mises stress for an element 4893, for the crashbox with a thickness of 1.5 mm is lower than the crash box of thickness 1.2mm. During, the impact both of the crash boxes has an equal magnitude of von-mises stress and after the impact, it is observed that the von-mises stress is reduced for the crash box having a thickness of 1.5 mm , since the increase of thickness decreases the effective von-mises stress of the crash box having a thickness of 1.5 mm with an element 4893.
STRAIN PLOT
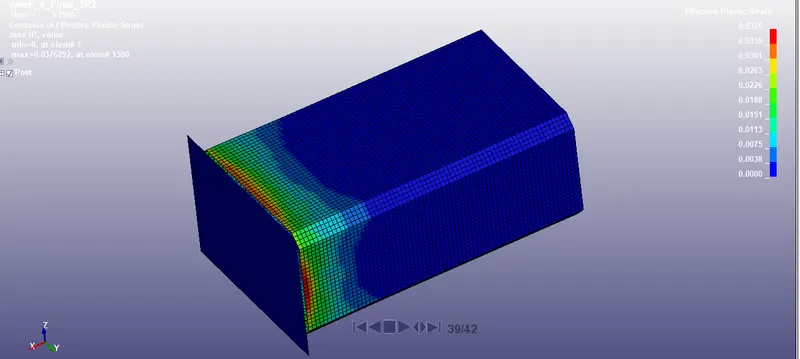
Fig(a), represents the effective plastic strain of the crash box having 1.2 mm thickness
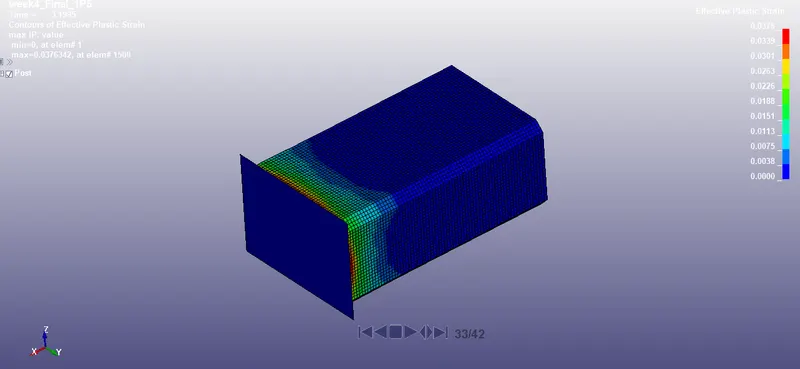
Fig(b), represents the effective plastic strain of the crash box having 1.5 mm thickness
From, Fig (a) and (b), it is observed that the effective plastic strain of both crash boxes is almost the same since there is only a slight change in the thickness for the crash boxes and also there is only a slight variation of von-mises stress and so there is not much variation in strain for both crash boxes.
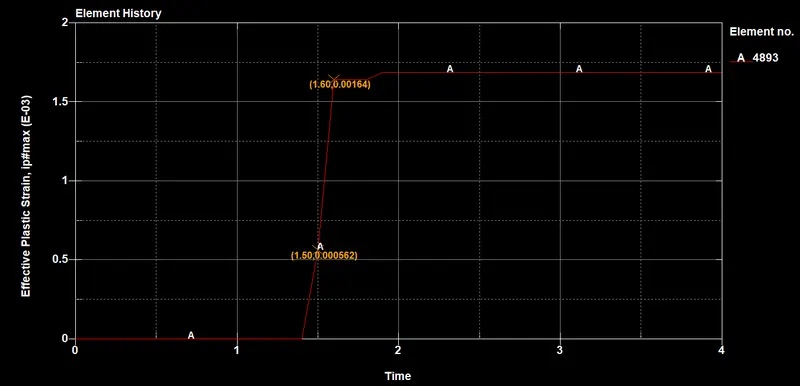
Fig(a), represents the effective plastic strain plot of the crash box having 1.2 mm thickness (element 4893)
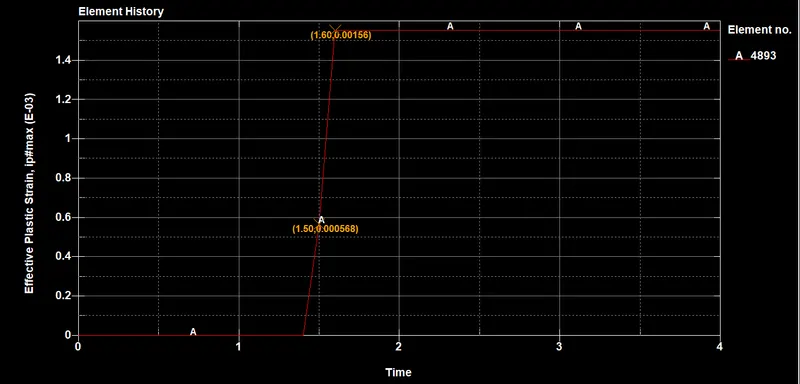 Fig(a), represents the effective plastic strain plot of the crash box having 1.5 mm thickness (element 4893)
From fig (a) & (b), it is observed that the effective plastic strain for the crash having 1.5mm thickness with an element ID of 4893 has a higher strain during the impact when compared to the other crash box. On the contrary, after the impact, the effective plastic strain for the crash having 1.5 mm thickness is lower than the other crash box. To sum up, the effective plastic strain for both the crash boxes having the same element ID has only a slighter variation in strain.
CONCLUSION
Thus, the crash test for the crash box is simulated with different crash box thickness, along with the given material properties, boundary conditions, and required output data are delivered, plotted, and compared successfully.