Week-4 Challenge WOT Condition Part-2
Ans 1: Mapped Model also called the static model is the one where we have predefined data of motors/gen in the form of look up table whereas the dynamic model is the one where we represnt the actual components using the actual motor/gen data. For eg inverter model, controller can be altered/control as per the requirement in the dynamic model.
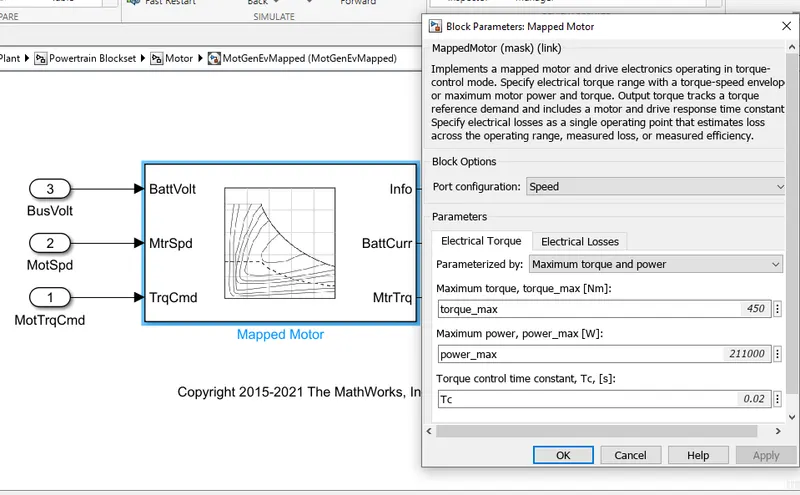
Mapped Model: Motor Elec parameters can be mapped/loaded directly
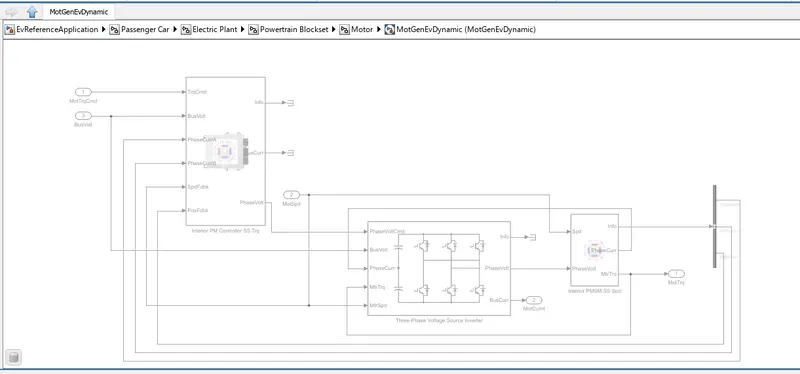
Dynamic Model: Components level design is possible
Static/Mapped model run faster than the dynamic model.
Also, Mapped model is used to study the behaviour of drivetrain at system level while the dynamic model is used when we need to analyse the model behaviour at components level.
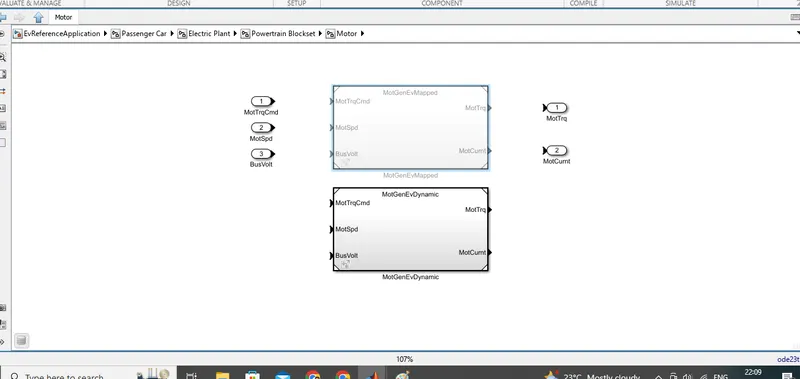
Part 2: Model type can be changed by 'variant manager' in Modeling section of Simulink.
In variant manager, go to 'passenger car' => 'Electric plant' => 'motor' and right click and click 'set as label mode active' to activate Dynamic model. As shown below dynamic model is acivated and Mapped model is disable.
Ans 2: Miles per gallon is calculated in Performance Calculation block in Visualisation as shown below
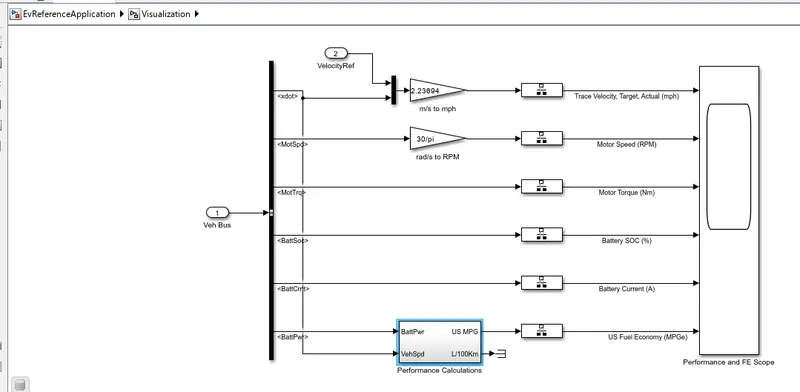
This block takes the input from Battery Power and Speed. The calculation schematics is shown below.
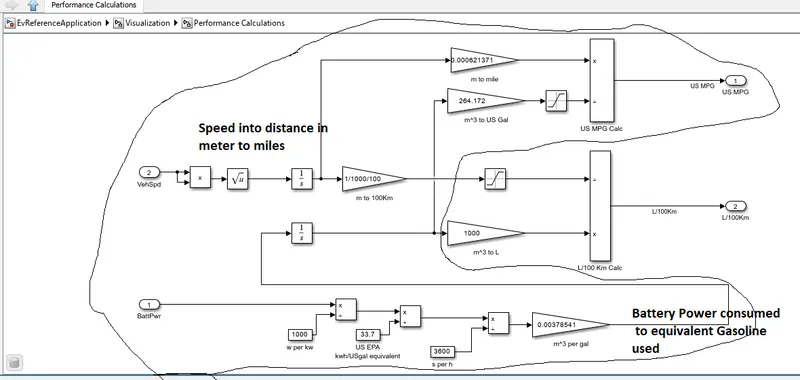
i) From Vehicle speed, it is converted into distance by integrating first in meter then into miles using conversion
1m = 0.000621371 miles to get say 'x' miles
ii) At the bottom, the battery power consumed is converted into equivalent gallon of miles used by dividing it by 33.7 since as per the US environmental protection agency(EPA), 1 gallon of gasoline is equal to 33.7 kWh.
we will get let's say 'y' gallon of gasoline
iii) Dividing x/y is done to give miles per gasoline(US mpg).
Part 2: The above calculation is shown for pure EV vehicle. For HEV, this gallon(gasoline-equivalent of battery power) is added with gallon used by IC engine then the distance in miles is divided by this total gallons calculated to get miles per gallon(US mpg).
Ans 3: HEV reference application with WOT is simulated as shown below:
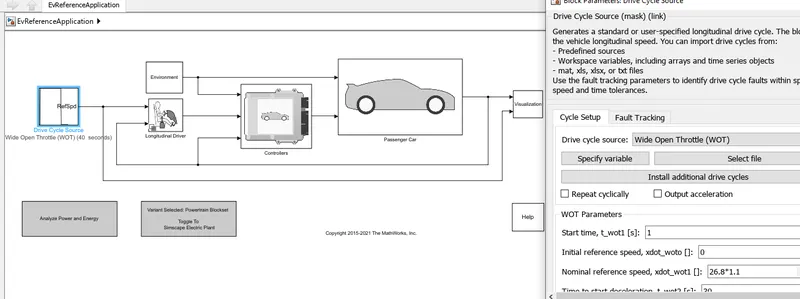
Start time is set as 5s. Ref Speed: 50m/s or 112mph, Decceleration time:50s and total simulation time as 70s.
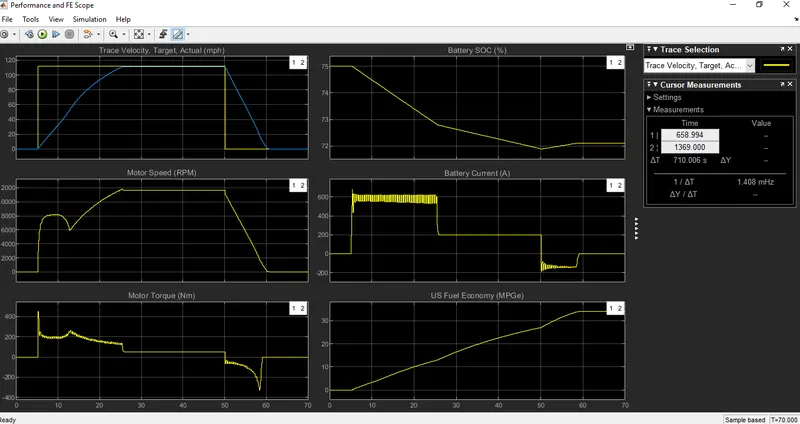
The result is plotted as follows
Now the grade and wind is changed to 10 and 5m/s respectively and it is simulated again as follows
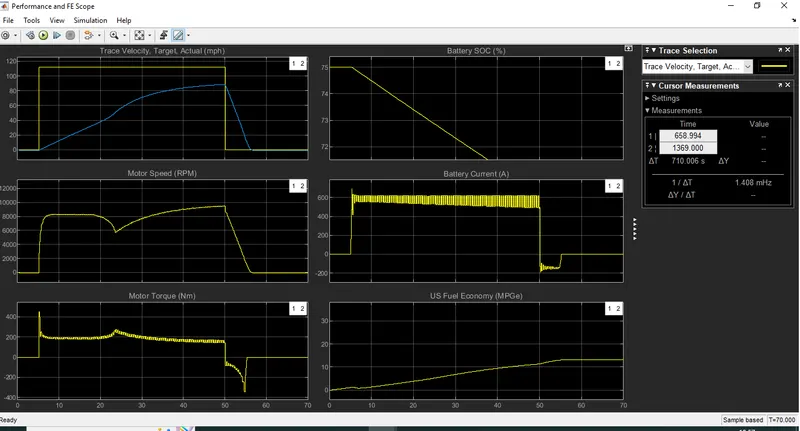
Result/Conclusion: The results for the above two cases is summarised as follow:
|
HEV simulation in WOT condition with and without environment change |
||
|
Parameters |
Without change |
With change |
|
Grade in degree |
0 |
10 |
|
Wind velocity in m/s |
0 |
5 |
|
Top speed in mph |
112 |
88 |
|
Acceleration time in sec |
20.3 |
45 |
|
Deceleration time in sec |
10.1 |
6.2 |
|
Initial SOC |
75 |
75 |
|
SOC at end of acceleration |
72.8 |
70.2 |
|
SOC at end of simulation |
72.1 |
70.3 |
|
Max fuel economy |
33.9 |
13.1 |
|
Min fuel economy |
0 |
0.8 |
In both cases,battery current reverses i.e, it changes to charging mode during decceleration called as regenerative braking.
In the second case due to increase ingrade and wind velocity, the vehicle could not reach to the reference speed in the given time due to limitation imposed on motor. The maximum motor torque delivered by the motor is 200Nm.
The fuel economy is also reduced drastically from 33.9 to 13.1 because of this high demand of power/energy.
Ans 4: The Pure EV and HEV is simulated for the same environmental condition of 10 grade and 5 wind velocity in x direction and the result is compared as follows
Pure EV result PLot
HEV Result Plot
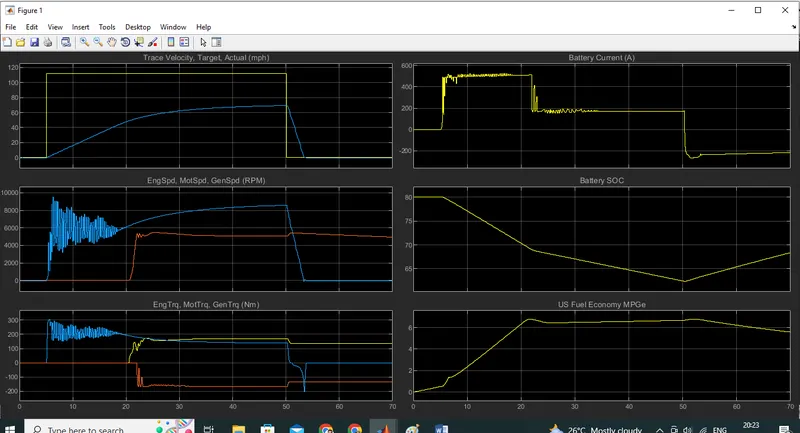
Result/Conclusion
|
HEV and Pure EV simulation in WOT condition |
||
|
Parameters |
HEV |
Pure EV |
|
Grade in degree |
10 |
10 |
|
Wind velocity in m/s |
5 |
5 |
|
Top speed in mph |
69.8 |
88 |
|
Acceleration time in sec |
45 |
45 |
|
Deceleration time in sec |
4.3 |
6.2 |
|
Initial SOC |
80 |
75 |
|
SOC at end of acceleration |
62.4 |
70.2 |
|
SOC at end of simulation |
68.1 |
70.3 |
|
Max fuel economy |
7 |
13.1 |
|
Min fuel economy |
0.9 |
0.8 |
Here, Due to high acceleration demand, in HEV, initially battery supplies the power but due torque limitation of motor, it could only reach to 69.8mph.
After the battery SOC comes down to 70%, engine starts supplying the power and both engine and battery together works to reach to the reference speed.
The decceleration time of HEV is 4.3s and of Pure EV is 6.2 since in HEV, it deccelerates faster due to high charging demand from the battery.
The fuel economy of HEV is also worse than Pure EV as in general engine efficiency is lesser than the motor efficiency.
Note: The plots are attached for the reference.