Week-4 Challenge WOT Condition Part-2
1. AIM
- Find the difference between the mapped and dynamic models of engine, motor, and generator.
- Find how the model calculates miles per gallon and also find the factors considered to model fuel flow.
- Run the HEV ReferenceApplication with the WOT drive cycle and change the grade and wind velocity in the environment block.
- Comparison between HEV and EV.
2. OBJECTIVE
- Making changes in the default system model such as grade, wind velocity, and cycle change and checking the outputs.
- To see how the model calculates miles per gallon.
- Comparing HEV and EV.
3. METHOD
3.1 Difference between the mapped and dynamic model of engine, motor, and generator.
Mapped
- The model uses a steady-state look-up table to characterize the engine performance.
- They provide overall engine characteristics like torque, BSFC, etc.
- USES
- It gives data from a dynamometer and also for design tools such as GT-POWER.
- For Quasi Steady-State Engine Simulations.
Dynamic
- The model breaks down the engine behavior into engine characteristics that are separated into lower-level components similar to the master-slave controller relation.
- By combining them in such a way, the dynamic effects are captured by the model.
- USES
- When a detailed dynamic model is needed having component-level data.
- Analysis of how individual components affect the overall engine performance.
To change the model type.
- Right-click
- Variable
- LAbel mode Active Choice
- Select which is needed
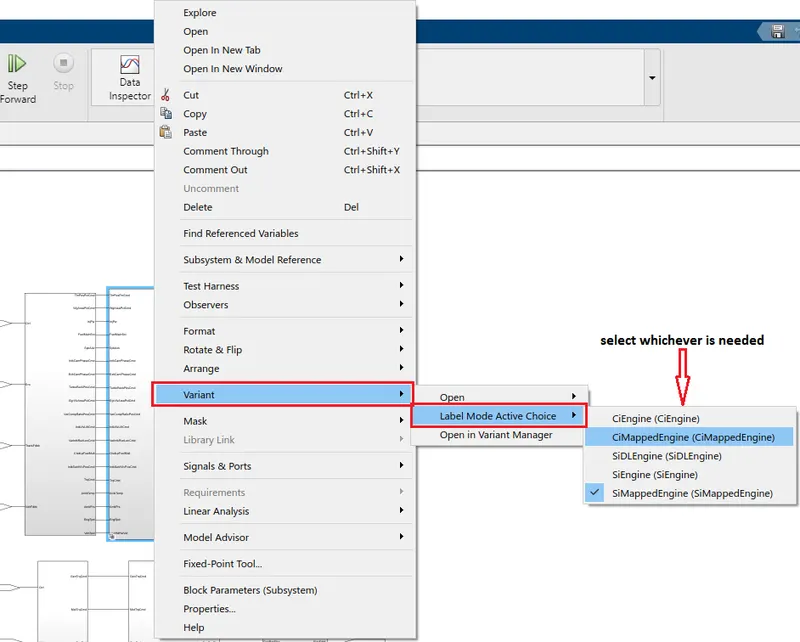 |
| FIG. Showing how to change the model type |
3.2 Calculation for miles per gallon.
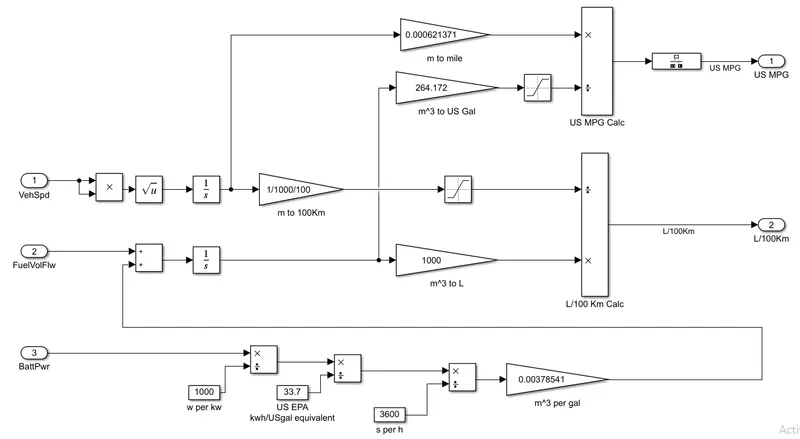 |
| FIG. Performance Calculation block |
- We get the above block from the visualization block and it shows how the miles per gallon are calculated i.e the amount of fuel consumed.
- Since this is an HEV, it also has a battery and the amount of battery needs to be taken into consideration. But the current provided by the battery needs to be converted before its taken for the calculation.
- The blocks on the lower part are used for the conversion of electric current to equivalent fuel quantity. Since the engine is running on fuel, we need to convert the battery capacity to equivalent fuel.
- Battery power in watts is first converted to kW, then kWh to US gallon equivalent, and then secs to hrs. Finally `m^3` per gallon.
- Fuel flow and battery power now having the same units are added and then integrated.
- The velocity is taken and integrated to find the distance which is the required unit for calculations.
- Gain blocks are used for converting units.
- Saturation blocks are used to give the upper and lower limits.
- Product blocks are used to get the final required output.
- Factors affecting are Vehicle Speed, Fuel Volume Flow (Fuel consumption), and Battery Power.
- The values are integrated so that we can find the displacement which is needed to calculate the fuel economy.
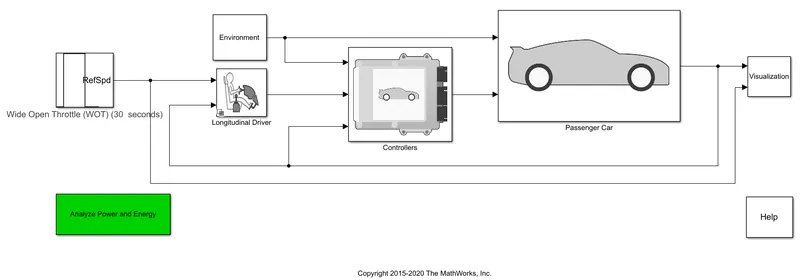
3.3 Run the HEV ReferenceApplication with the WOT drive cycle.
- Below are the inputs given to the HEV model.
 |
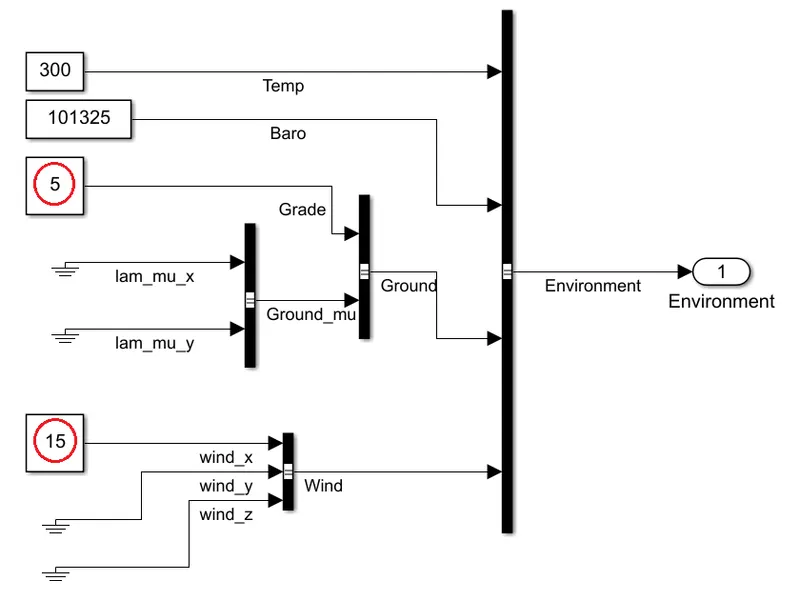 |
| FIG. HEV with WOT Drive cycle | FIG. Changing the Grade and Wind Velocity |
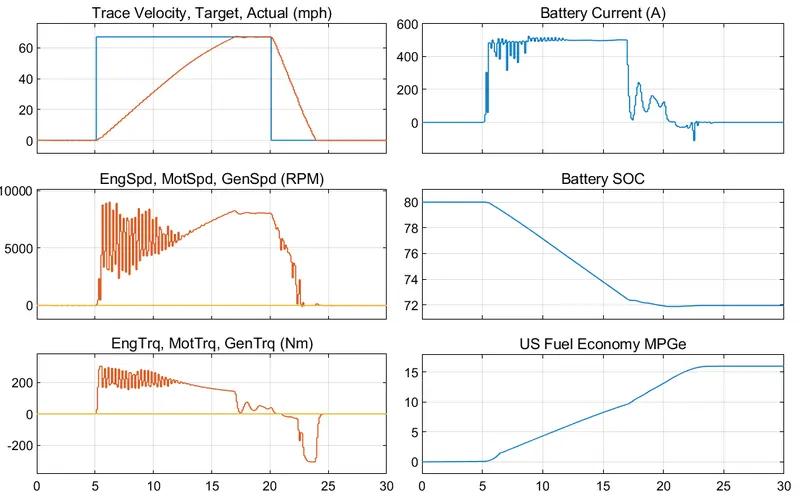 |
This plot is for the WOT cycle for default parameters. It is seen that the time taken for acceleration is less and since there is no grade and no wind velocity to provide resistance, the vehicle reaches top speed in less time. |
| FIG. Default parameters | |
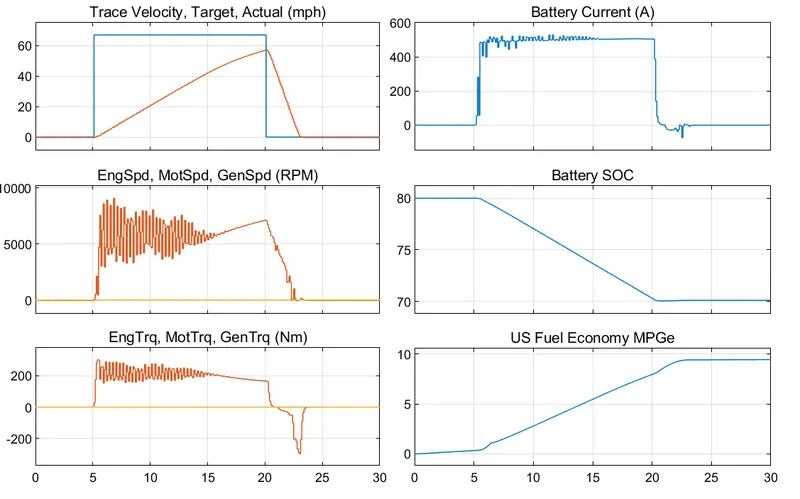 |
This plot shows the WOT cycle after the grade is changed to 5 and wind velocity is changed to 15 and the cycle is run for 30 secs. |
| FIG. plot after changed parameters |
- WOT is the cycle in which the throttle is open fully from the start.
- The battery is not charged in this cycle as it gets used up of the acceleration and after a certain level of discharge, it drops directly.
- Since the throttle is put from zero position to maximum position, it causes the velocity to change drastically in a short interval of time, then it's constant for some time and then decreases as there is deceleration.
- In normal circumstances, the battery provides continuous power for the duration of the cycle but in WOT, the current is provided during the sudden acceleration the current is provided and then it goes back to zero.
- The same kind of behaviour is seen in the other plots which is only during the acceleration.
3.4 Comparing the simulated results of hybrid and pure electric powertrains.
The inputs given for the simulation are Grade = 5 and wind velocity = 15 and the drive cycle is taken as WOT.
|
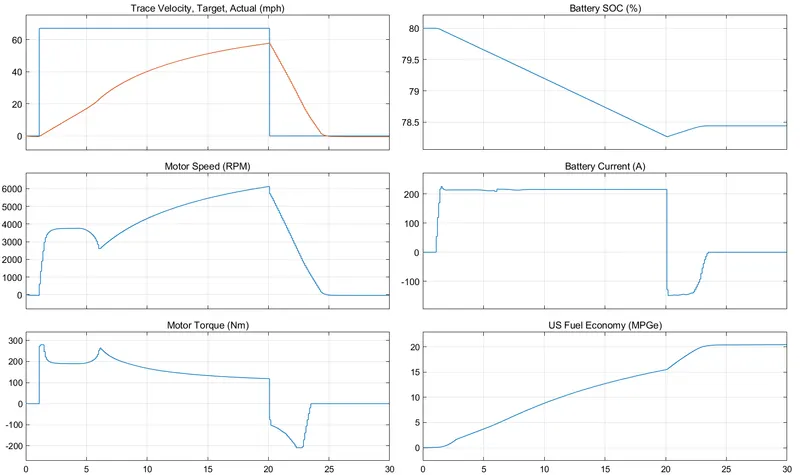 |
| FIG. Plot for HEV after changing cycle, grade and wind velocity | FIG. Plot for EV after changing cycle, grade and wind velocity |
- We give the same inputs for the EV and HEV simulations.
- We see that even if the conditions are the same we see the difference in plots and performance.
- The acceleration achieved by EV is more than HEV.
- The battery current fluctuations in HEV are more for the cycle and in EV the battery current has very little fluctuations and is nearly constant.
- The SOC for an EV never falls below 75 whereas in HEV it drops to 70. There is also regeneration when the SOC drops below 77.5.
- In HEV the parameters are continuously varying the current which is the dynamic current but this does not happen in EV.
4. LEARNING OUTCOME
- We learn how to us the Powertrain Blocksets.
- We learn the comparison between an EV and an HEV.
- We learn how the fuel economy is calculated in miles per gallon which is a US standard.
- We learn how to compare the HEV with default parameters and change in cycle that is WOT cycle.