Parsing NASA thermodynamic data using MATLAB
1. AIM
To write a program extracts the 14 co-efficients and calculates the enthalpy, entropy, and specific heats for all the species in the data file which is NASA Thermodynamic data.
2. OBJECTIVE
- Extracting the Data line by line.
- Calculate the Specific Heat, Entropy, Enthalpy using the Data file.
- Plot the Specific Heat, Entropy, Enthalpy vs Temperature graph.
- Write a code to calculate the Molecular weight of all the species.
3. METHOD
3.1 THEORY
Parsing a file means reading in a data stream and then making an in-memory model of the semantic content of the data. This aims in facilitating some kind of transformation on the data.
In order to perform file parsing, we first need to extract the data from the given data file. The first step is to open the file, then reading the file and saving the entire data in a variable that can be used as and when needed.
For this, we use the 'open' command. As per the requirement, we can read the file or write to it. In the code, we use 'r' which indicates that we need to read the file. The syntax for it is
fileID = fopen(filename)Next, we need to read a line from the data file. For this purpose, we use 'fgetl' command. This command takes the first line and stores it in a variable. The syntax is
tline = fgetl(fileID)Since the line contains various string and numbers we need to assign these to different variables as needed.
In order to get the different values, we need to separate those from the line and then assign the variables respectively. But after we split we get a cell array, which is an array that takes values as spaces or sizes. We can perform the above method by using 'strsplit' and 'str2double' these take the values and convert them into integers and save them in variables. The syntax is.
C = strsplit(str,delimiter) %splits str at the delimiters

X = str2double(str)
X = str2double( converts the text in str)str to double-precision values. str contains text that represents real or complex numeric values. str can be a character vector, a cell array of character vectors, or a string array. If str is a character vector or string scalar, then X is a numeric scalar. If str is a cell array of character vectors or a string array, then X is a numeric array that is the same size as str.
In order to take up the values from the cell array we use {} instead of ().
While loop
while expression
    statements
end
We use this loop for repeated iterations and the loop performs these iterations until the condition specified in the loop comes true.
There is a need to create a folder to store all the plots. We use 'mkdir' for this.
mkdir([foldername])We use 'cd' command to change the directory from the current folder to the location where the files are going to be saved.
cd
cd newFolder
oldFolder = cd(newFolder)
For saving the images we use the 'saveas' command.
saveas(fig,filename)
saveas(fig,filename,formattype)
Formulas used for calculating Specific Heat, Entropy, Enthalpy

3.2 MATLAB Program
% File Parsing Program

clear all
close all
clc

% opening the data file in the program
f1 = fopen('THERMO.dat','r')

% Coding for getting the number of species in a generic way
% we call the first line using fgetl command
x = fgetl(f1);

counter = 1    %counter for calculating the number of lines

% This loop is used for calculating the number of lines in the data file
while strcmp(x,'END')==0
    counter = counter+1
    x = fgetl(f1);
end

%we know that we have to skip 6 lines in total
% 1 title, 1 global temperature, 3 headers and the last line
% Hence we can get the number of species in the data file as shown below
No_of_species = (counter-6)/4

frewind(f1)     %This is used to get back to the first line

fgetl(f1);      %This is the title line which we have to skip

% Now we have to get the global temperature values from the 2nd line
% temp is string and we make it into integer
% strsplit splits the line according to our input like f2
% a cell array is formed containing the different values
% the global temperature values are taken from this array
f2 = fgetl(f1);
temp_split = strsplit(f2);
global_low_temp = str2double(temp_split{2});
global_mid_temp = str2double(temp_split{3});
global_high_temp = str2double(temp_split{4});
temp = linspace(global_low_temp,global_high_temp,1000);

% This loop is used to skip the next 3 comment lines
for w = 1:3
    f3 = fgetl(f1);
end

for i = 1:No_of_species     %for every species

% We extract the values of local high, mid and low temperatures following
% the same method used above for Global temperature values
f4 = fgetl(f1);
local_temp_split = strsplit(f4);
en = length(local_temp_split);
species_name = local_temp_split{1};
local_low_temp = str2double(local_temp_split{en-3});
local_mid_temp = str2double(local_temp_split{en-1});
local_high_temp = str2double(local_temp_split{en-2});

% A temperature range is fromed from low to high local temperatures
T = linspace(local_low_temp,local_high_temp,1000);

% We have to get the 14 Coefficients of every species
% First line of the coefficients
coefficient_L1 = fgetl(f1);
a = strfind(coefficient_L1,'E');
% strfind takes the Coefficient_L1 as input and will find all E and
% then form an array containing the position of every E in that line
% a(1) is the first position of E and likewise
% all the coefficient values are found using this method
c1 = str2double(coefficient_L1(1:a(1)+3));
c2 = str2double(coefficient_L1(a(1)+4:a(2)+3));
c3 = str2double(coefficient_L1(a(2)+4:a(3)+3));
c4 = str2double(coefficient_L1(a(3)+4:a(4)+3));
c5 = str2double(coefficient_L1(a(4)+4:a(5)+3));

% Second line of coefficients
coefficient_L2 = fgetl(f1);
a = strfind(coefficient_L2,'E');
c6 = str2double(coefficient_L2(1:a(1)+3));
c7 = str2double(coefficient_L2(a(1)+4:a(2)+3));
c8 = str2double(coefficient_L2(a(2)+4:a(3)+3));
c9 = str2double(coefficient_L2(a(3)+4:a(4)+3));
c10 = str2double(coefficient_L2(a(4)+4:a(5)+3));

% Third line of coefficients
coefficient_L3 = fgetl(f1);
a = strfind(coefficient_L3,'E');
c11 = str2double(coefficient_L3(1:a(1)+3));
c12 = str2double(coefficient_L3(a(1)+4:a(2)+3));
c13 = str2double(coefficient_L3(a(2)+4:a(3)+3));
c14 = str2double(coefficient_L3(a(3)+4:a(4)+3));

% Creating a folder to store all the data
mkdir(['C:UsersSkill_LyncDownloadsTANMAYMATLABNASA FILE DATA',species_name])

% Value of universal gas constant (unit J/molK)
R = 8.314;

% for getting an array of all the values of specific heat, entropy, enthalpy
% we have to itrate the loop for all values of coefficients
% we also put conditions so that we can calculate for high temp coeffs
% c1 to c7 and low temp coeffs c8 to c14
for z = 1:length(T)
    if T(z) > local_mid_temp
        CP(z) = R*(c1 + c2*T(z) + c3*T(z)^2 + c4*T(z)^3 + c5*T(z)^4);
        H(z) = R*T(z)*(c1 + c2*T(z)/2 + c3*T(z)^2/3 + c4*T(z)^3/4 + c5*T(z)^4/5 + c6/T(z));
        S(z) = R*(c1*log(T(z)) + c2*T(z) + c3*T(z)^2/2 + c4*T(z)^3/3 + c5*T(z)^4/4 + c7);
    else
        CP(z) = R*(c8 + c9*T(z) + c10*T(z)^2 + c11*T(z)^3 + c12*T(z)^4);
        H(z) = R*T(z)*(c8 + c9*T(z)/2 + c10*T(z)^2/3 + c11*T(z)^3/4 + c12*T(z)^4/5 + c13/T(z));
        S(z) = R*(c8*log(T(z)) + c9*T(z) + c10*T(z)^2/2 + c11*T(z)^3/3 + c12*T(z)^4/4 + c14);
    end
end

% plot for Cp vs T
figure(1)
plot(T,CP,'color','r')
xlabel('Temperature')
ylabel('Specific Heat')
title('Cp vs T')

% plot for H vs T
figure(2)
plot(T,H,'color','c')
xlabel('Temperature')
ylabel('Enthalpy')
title('H vs T')

% plot for S vs T
figure(3)
plot(T,S,'color','k')
xlabel('Temperature')
ylabel('Entropy')
title('S vs T')

% cd newfolder changes the current folder to new folder
% in this case to the desired folder
cd(['C:UsersSkill_LyncDownloadsTANMAYMATLABNASA FILE DATA',species_name])

% saveas command stores the figures to specified file format 'jpg'
% syntax is saveas(fig,filename,formattype)
saveas(1,'Specific heat','jpg')
saveas(2,'Enthalpy','jpg')
saveas(3,'Entropy','jpg')

% Calculating the Molecular weight of all the species
% we form 2 arrays for Atoms and Atomic_Weight
% we intialize molecular_mass as 0 which also defines our output variable
Atoms = ['N','A','C','H','O'];
Atomic_Weight = [14.0067,39.95,12.01,1.0079,16];
Molecular_Mass = 0;

for m = 1:length(species_name)
    for j = 1:length(Atomic_Weight)
        if strcmp(species_name(m),Atoms(j))
           Molecular_Mass = Molecular_Mass + Atomic_Weight(j);
           t = j;
        end
    end

    n = str2double(species_name(m));

    if n > 1
        Molecular_Mass = Molecular_Mass + (Atomic_Weight(t)*(n-1));
    end
end
fprintf('molecular weight of %s is = %f n',species_name,Molecular_Mass)
end
Idea behind the code
- First, we read the given data file in the code.
- Then we use a while loop to calculate the number of lines.
- We use a counter to count the number.
- We use a false condition for the loop and it terminates as soon as the condition is satisfied.
- The condition is that we count each line till we find the word END.
- Then we know that we have to skip 6 lines in total and that each species has 4 lines.
- Hence we get the number of species by subtracting the 6 lines and dividing it by 4.
- Then we have to skip the first line so we use fgetl
- Then from the next line, we have to extract the values of Global low, mid and high temperatures. We use the strsplit command for that and then we assign the individual values to the variables.
- Then we use a for loop to skip the next three lines since they are comment lines in the data file.
- Then we use a for loop and then from the next line we start with finding the species name and the local low, mid and high temperatures.
- Then we find all the 14 coefficients from the next 3 lines using E as the position marker and finding the values with respect to the position of E.
- We make a range of local temperatures from low to high.
- We then create a folder to store all the plots and figures of each species using mkdir command.
- Then we start with the calculation of specific heat, enthalpy, entropy.
- We assign the value of Universal gas constant to variable R
- Then we formulate the equations and add a if-else loop because we the first 7 coefficients and for high temperature and the next 7 are for low temperature.
- Then we plot the graphs for Cp, H, S vs Temperature.
- Then we change the current folder to a new folder using cd command.
- Then we use saveas command to save the plots.
- Then we make a loop to Calculate the molecular masses, the explanation is given below.
3.3 Calculating the Molecular Weight
% Calculating the Molecular weight of all the species
% we form 2 arrays for Atoms and Atomic_Weight
% we intialize molecular_mass as 0 which also defines our output variable
Atoms = ['N','A','C','H','O'];
Atomic_Weight = [14.0067,39.95,12.01,1.0079,16];
Molecular_Mass = 0;

for m = 1:length(species_name)
    for j = 1:length(Atomic_Weight)
        if strcmp(species_name(m),Atoms(j))
           Molecular_Mass = Molecular_Mass + Atomic_Weight(j);
           t = j;
        end
    end

    n = str2double(species_name(m));

    if n > 1
        Molecular_Mass = Molecular_Mass + (Atomic_Weight(t)*(n-1));
    end
end
fprintf('molecular weight of %s is = %f n',species_name,Molecular_Mass)
Loop explanation
- First, we make an array of Atoms like O, H, C, etc.
- Then we make an array of the Atomic weights of the above-mentioned atoms in the same order as the atoms.
- Since we need to calculate the value of molecular weights we initialize the variable Molecular_Mass by 0.
- For this calculation, we use nested for loops
- The first for loop will run for the total length of the species name.
- The second for loop will run for the length of the Atomic weight array.
- We use the if condition and compare each character of the species name to the Atoms array using strcmp command.
- We use the formula as Molecular mass = molecular mass + atomic weight of the compared value of atom wrt weight.
- Since we initialized the value of molecular mass is 0 the molecular weight will be given by the addition of atomic weights.
- While comparing if we get a number we store it in variable t.
- we use str2double so that we can get a proper value of the integer.
- Then we use a new if loop that if n is greater than 1 then we will multiply that number with the respective atom
- But we already have one atom added so we take n-1 so that the value is correct. For example O2, we have 2 as an integer but we already added one O so is we multiply by n we'll get 3*'O' values so hence we use n-1 so that the molecular mass value is correct.
- After the whole species name gets calculated we display the molecular weight value.
3.4 OUTPUTS
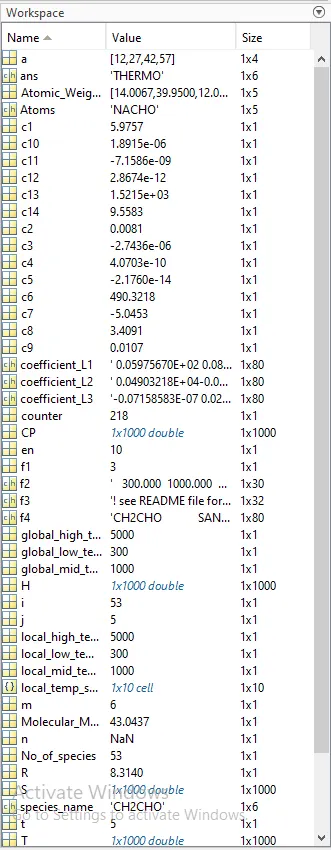
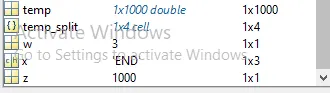
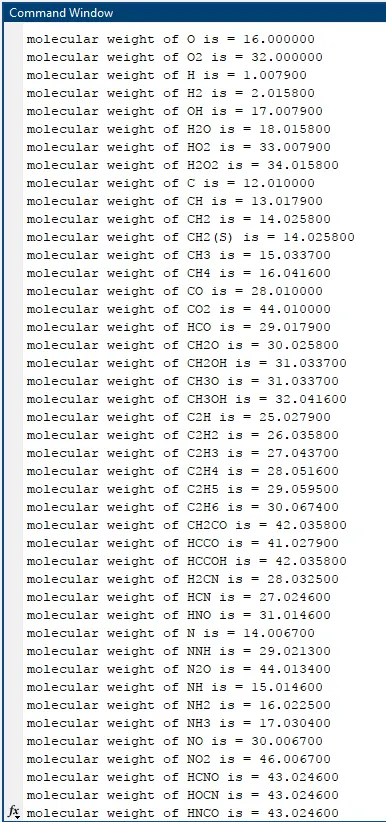
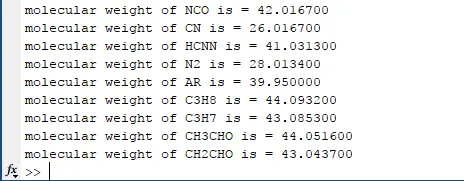
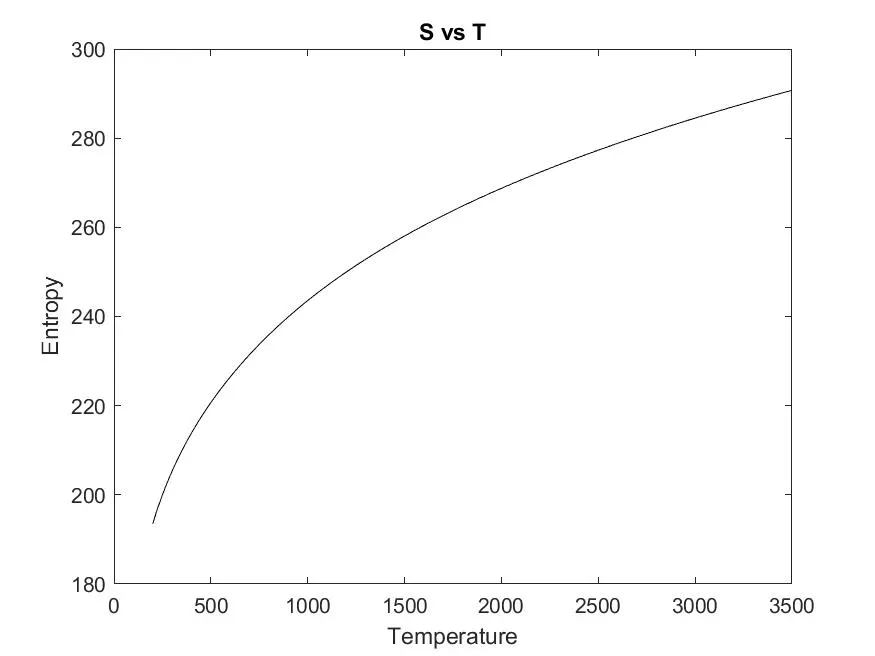
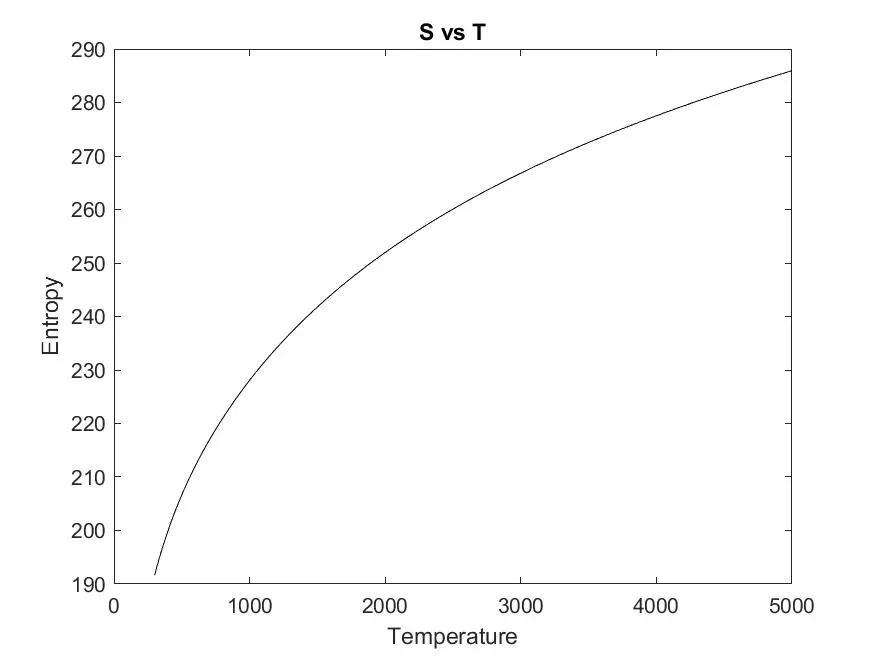
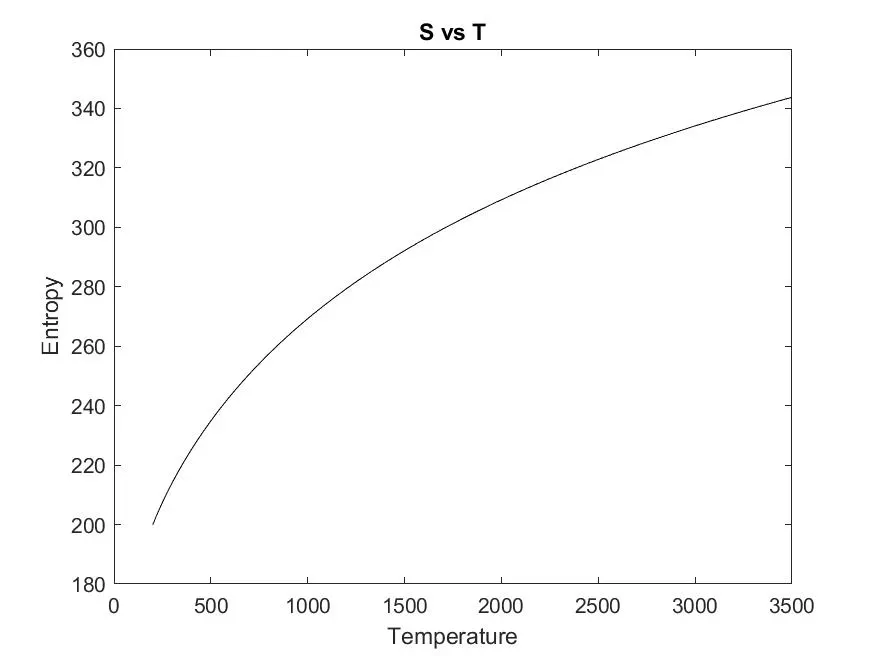
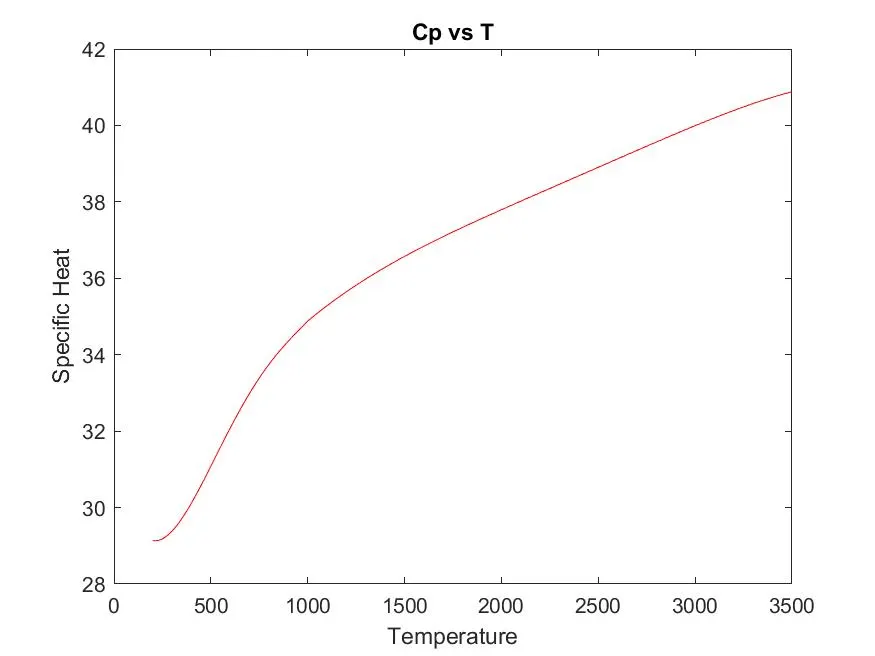
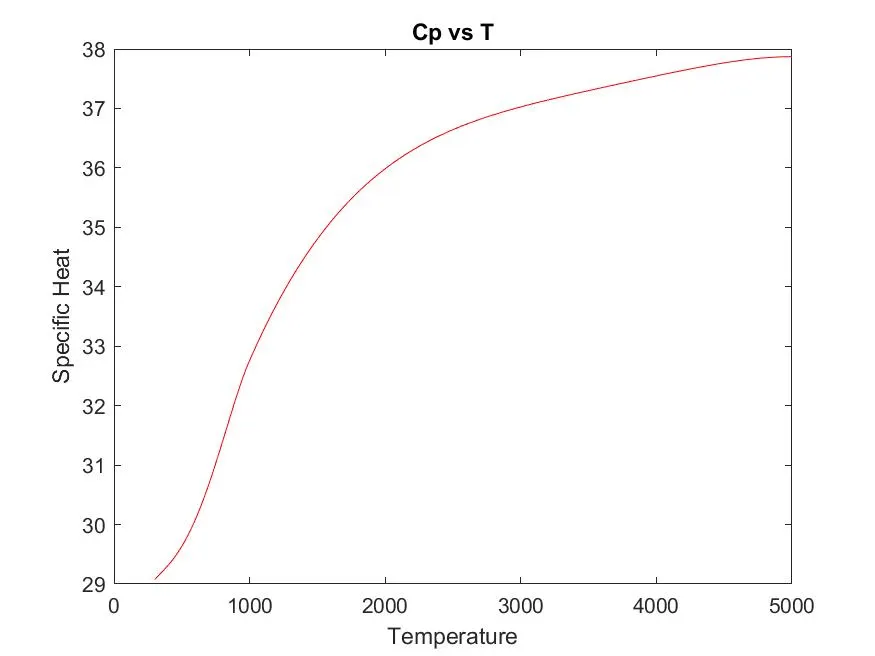
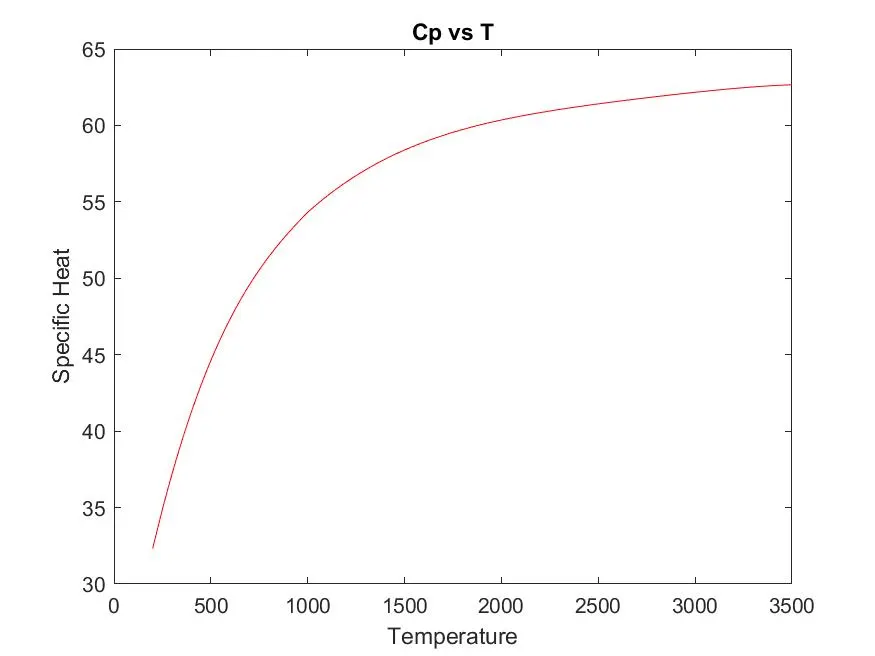
Given below are values in the workspace, command window showing the molecular weight values of all species, and the folder where the plots of all the species are stored.
|
|
|
| Fig. Workspace values | Fig. Command window showing the Molecular Weights |
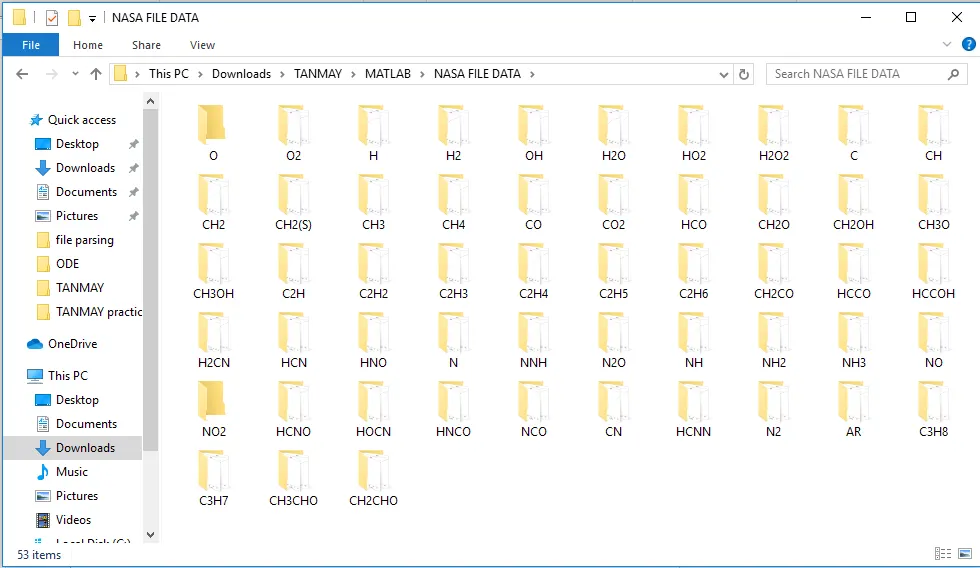 |
| Fig. The destination folder where all the plots for different species are stored |
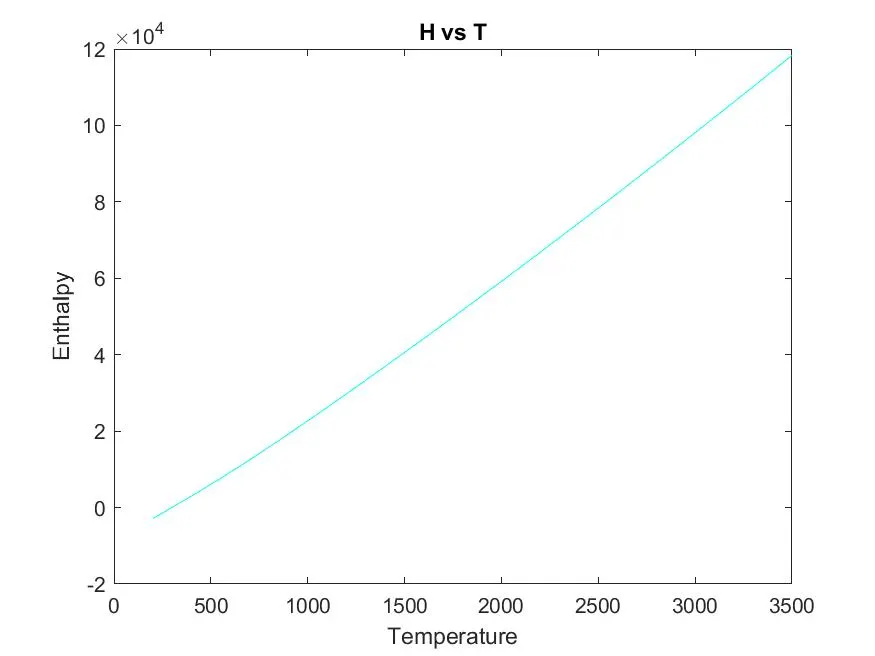
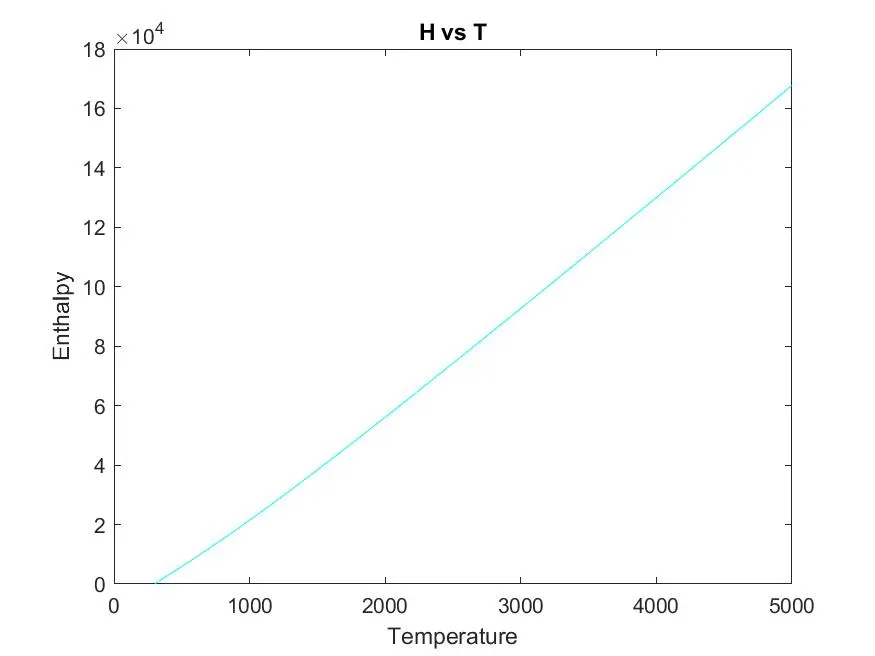
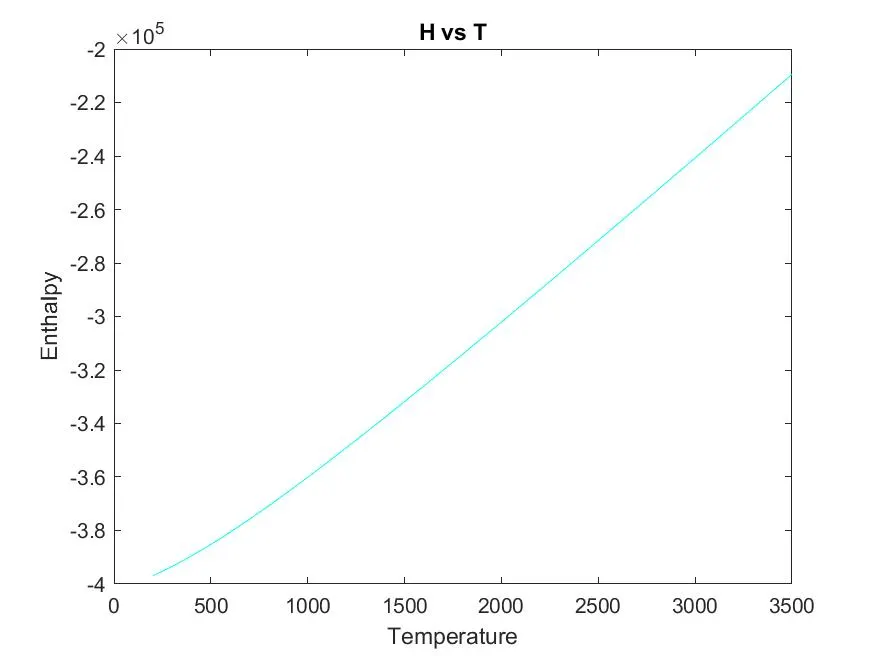
| Outputs for O2 | Outputs for N2 | Outputs for CO2 |
 |
 |
 |
 |
 |
 |
 |
 |
 |
3.5 ERRORS occurred
The main problem which was occurring was to get the values of the local low mid and high temperatures because for every species there was some problem with the spacing. The positions were not fixed. Hence we used the last value of the line as the starting point and use that to find the values of the temperature. We find the values from right to left and we use en-1 like take the second last position from the end and likewise. And because of the error, we were not able to plot the graphs.
| This code was causing the issue | This is the rectified code |
|
|
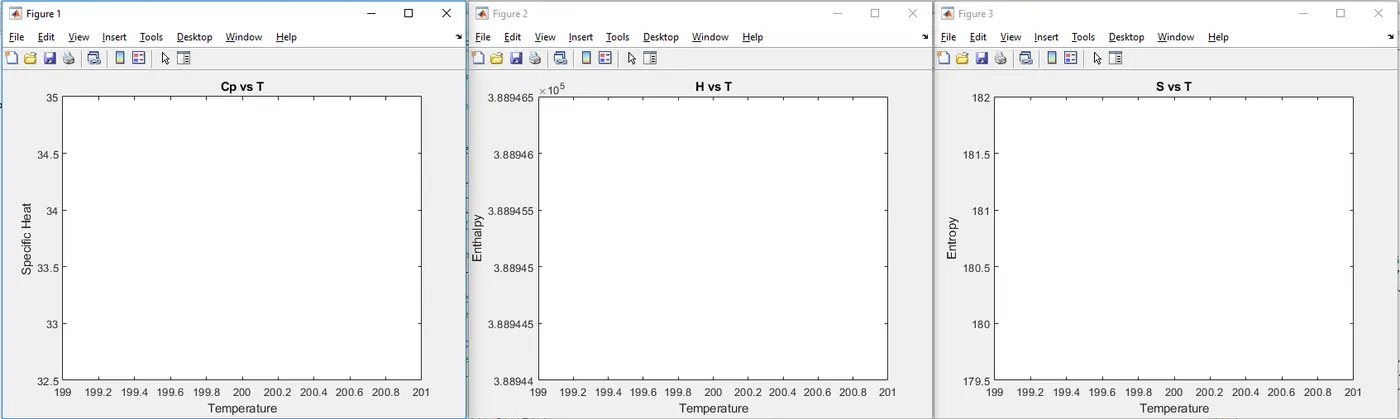 |
| Fig. Because of the inconsistency of the temperature values we don't get any plots. |
4. LEARNING OUTCOME
- Learned how to open data files and how to read the file.
- Learned how to count lines in the data file using a loop.
- Learned how to perform different operations on a file.
- Learned how to find a specific value from a line.
- Learned how to create a folder and then change directories and how to save plots in them.
- Learned the use of different loops.
5. CONCLUSION
- Many steps have to be followed to get the data from the data file.
- Before taking the data from the cell array we need to understand how the columns and rows are placed in the data file and form a loop accordingly to get the values.
- Plots are formed wrt to Temperature values.
- We also calculate the molecular weight of each species.