Week-4 Challenge WOT Condition Part-2
WEEK 4 – WOT Condition part 2
AIM:
To study and simulate the HEV reference application model with the WOT drive cycle and to compare the results simulated for the model.
Objective:
To study the difference between the mapped and dynamic model of engine, motor, and generator and changing the model type.
To observe the model calculation of miles per gallon, and the factors considered to model fuel flow.
To run HEV Reference application with WOT drive cycle and changing the grade and wind velocity in the environment block
To compare the simulated results of hybrid and pure electric vehicle.
1. Difference between the mapped and dynamic model:
Mapped model
In mapped models the data used for the operation ad simulation are to be entered in a form of a lookup table, which could be then configured with the operational parts and the analysis would be formed.
If the detailed specifications/lookup table data is available with us the simulation becomes easier and it gives the results on the basis of data interpreted, also known as the global-based model.
Engine performance could be simulated with the array of data interpreted in the system, whereas all conditions such as Engine operations, power, efficiency, could be measured accordingly.
Motor specifications such as rpm, maximum efficiency, heat, and such specifications are to be entered for simulating the results.
Generator specifications for battery torque, battery current, motor torque, and others are to be entered for simulation.
Dynamic Model:
In the dynamic model, it understands the behavior of the part/element and then it behaves accordingly. It gives detailed analysis for the variations entered by us in the specifications whereas it simulates according to real and dynamic operations.
It operates dynamically depending on the situation of operation detailed data and specifications are not required and the simulation gives the detailed analysis of the components simulated, also known as Real-Time based model.
Engine performance will be simulated as per the original/real engine specifications of the designated vehicle chosen for simulation. All results would be obtained from real-time details.
Motor specifications such as rpm, maximum efficiency, heat, and such specifications are to be entered for simulating results.
Generator specifications would be considered as per the actual and dynamic state the results of the same would be obtained then.
To change the model type:
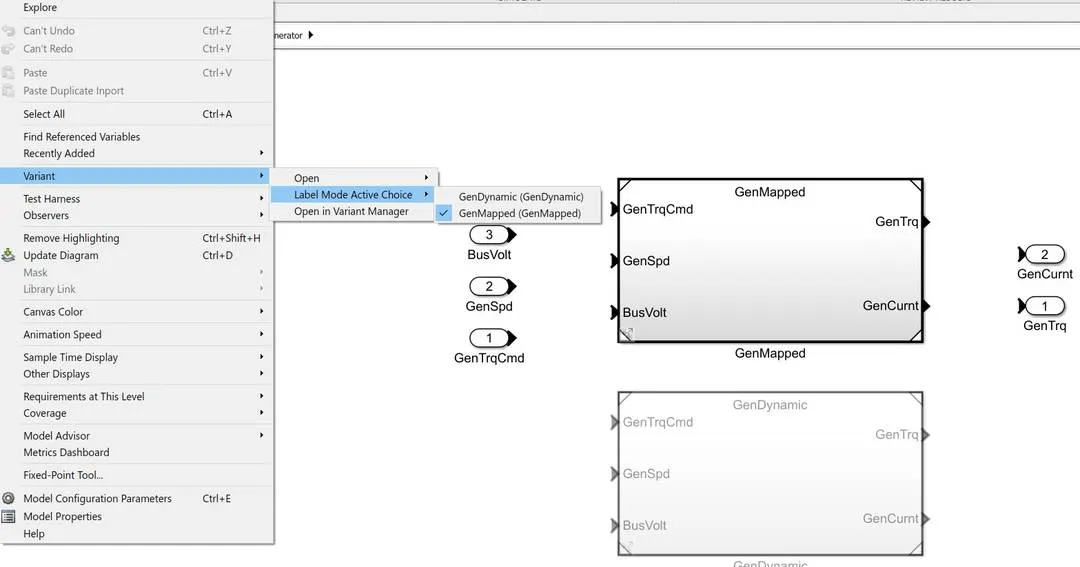
The procedure to change the model type is, to open the Hev multimode reference application model initially, then open the “passenger car” subsystem, then we could find “Electric plant” subsystem, open the subsystem and we could find “generator” block, while opening we could find two systems named “GenMapped” and “GenDynamic”. To switch between these two models, right-click on the open space of the model and you will find a dialog box as above, from that box select variant, there we could find “Label Mode Active Choice”, from there we could switch between given two modes.
2. Model calculation for miles per gallon
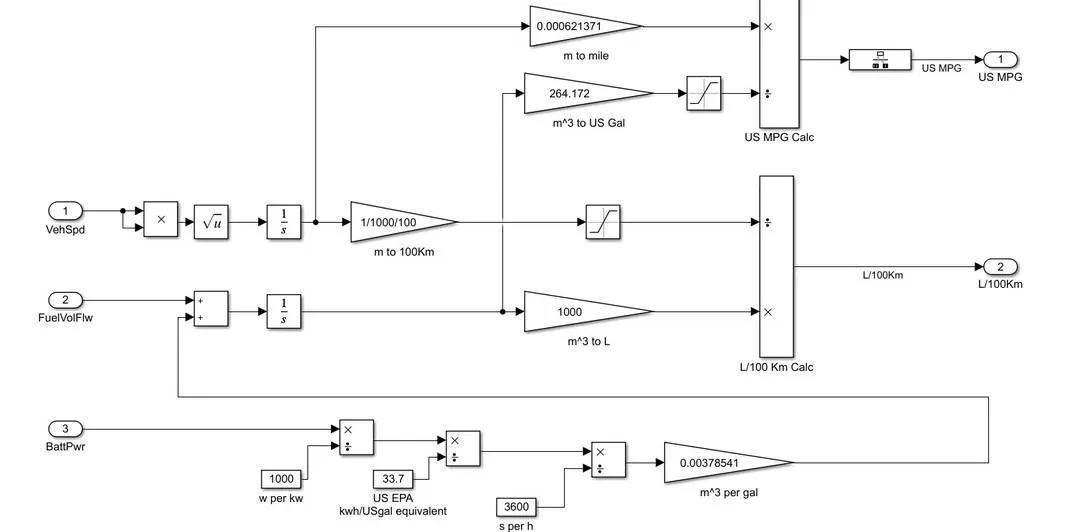
The block named “L/100km calc” which is on the right side of the picture shown above is used to represent the miles per gallon of the vehicle. However, this is an HEV and the amount of better charge consumed by the vehicle is not considered. The remaining blocks shown below are used to convert battery usage into an equivalent amount of fuel.
While integrating the velocity, we get the distance needed to be converted into proper units, to covert the units gain blocks are used above. Saturation block is used to give upper and lower limits for distance. The product block is used in order to get the final outputs as per requirement. For example, after converting the fuel unit and distance into miles and gallons, a product is provided which will convert the two separate quantities into miles/gallon.
- Factors considered for the fuel flow are velocity, fuel used, and battery, the battery charge used is converted into fuel used. in order to get the displacement, it is necessary to do integrate the velocity. After this, it is necessary to convert the units and it is done by the gain blocks.
3.Simulation of HEV reference application with the WOT drive cycle.
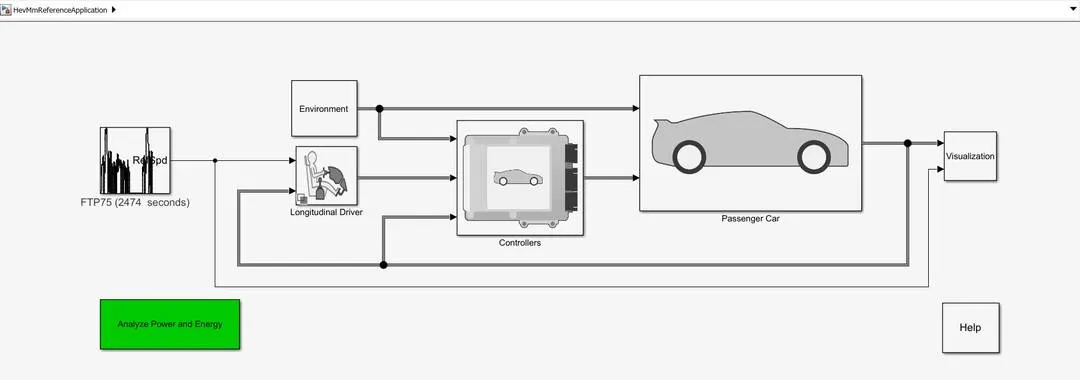
In order to run the model, we need to load the “Hev multimode reference application”, on loading the model we could see that the default model would be loaded with the “FTP75” drive cycle. Then open the drive cycle block, there we could explore options available with the drive cycle block.
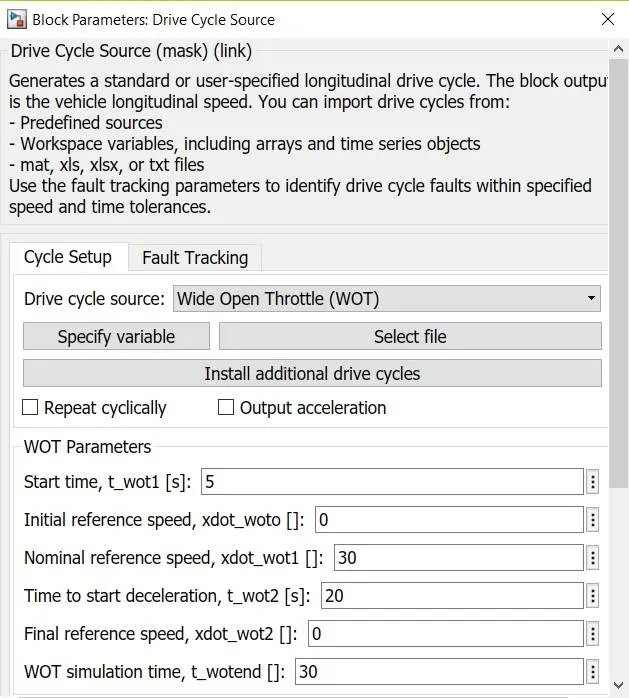
While selecting “drive cycle source” a drop-down list will be available with various drive cycle options, from the drop-down list select “Wide Open Throttle”(WOT) as below, then apply the changes to the model.
Then the model would look like as below specified image,
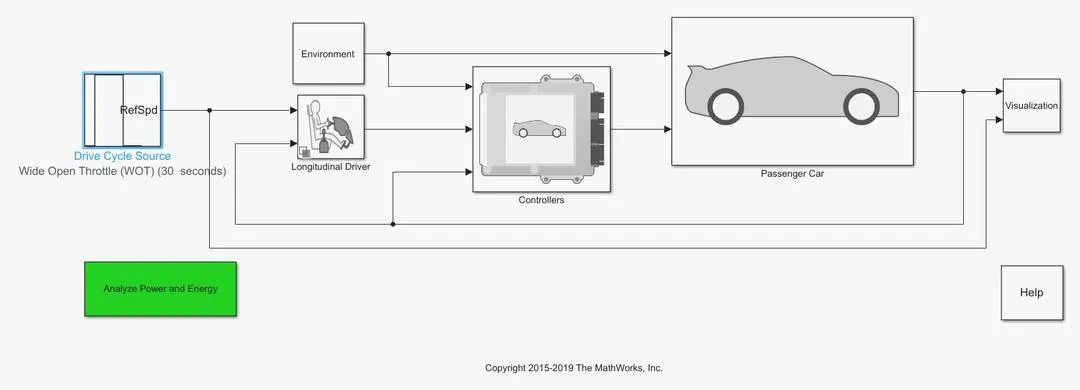
Thus the required changes are applied to the model and then the model is processed to “Run” and thus we could obtain results for the simulated WOT drive cycle over the Hev reference application model. The obtained results are as follows,
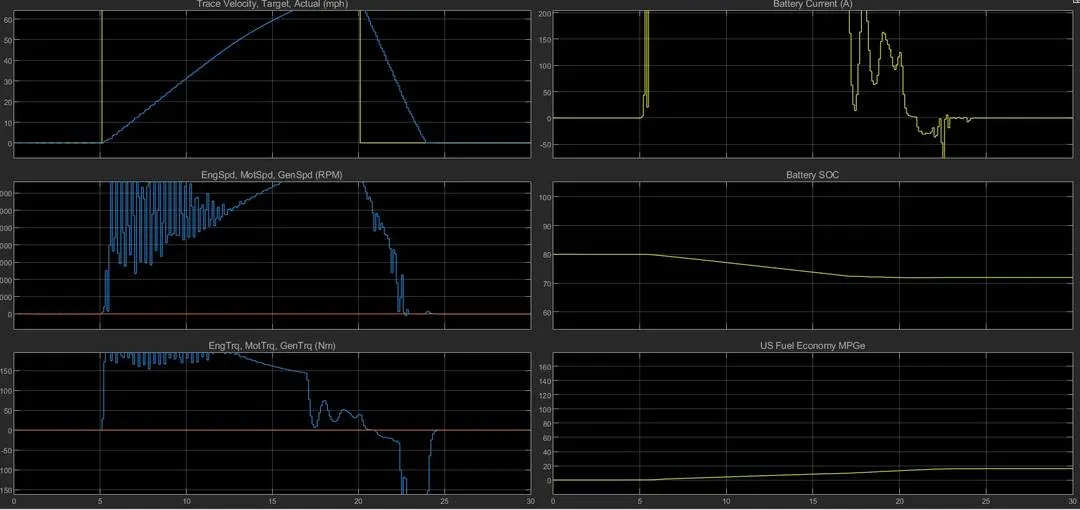
The above image shows the obtained output plot for wide-open throttle for the Hev model
Plot-1 represents the plot between trace velocity and target actual mph, in this plot the velocity is raised by the torque for a certain limit of speed, and power is transformed by acceleration force. The maximum velocity reached by the vehicle is 60mph. then the speed of the vehicle is driven at a constant speed, SOC is charging when the vehicle is decelerated.
Plot-2(Engine speed, motor speed) in this plot the supply of power from the battery is observed and distributed by the control system that power is generated to the motor.
Plot-3(Engine torque, motor torque) this plot shows the engine torque and motor torque, and the generator torque of the vehicle. The raise of velocity in vehicles at the initial stage is driven by this supply of torque. The velocity range to attain the maximum torque is applied for this system. A battery supplies the power to the motor and that conversion of energy is transmitted into torque.
Plot-4(battery current(A)) A battery capacity of the vehicle is varied depends upon the drive cycle of the engine system. This plot shows that the engine starts and battery power is also generated so graph points are increased in the initial point. The torque is produced by the battery so the level of power transmission is high in that state when it reaches maximum velocity limit it will interchange the engine system and the battery becomes low in that Stateflow, when the gear is shifted, the torque will rise again, therefore power transmission becomes high.
Plot-5(Battery SOC) the state of charge refers to the recharging condition of battery during deceleration, the plot shows the same system battery flow is raised while supplying the power and it will low by insufficient power when it rises again during the deceleration process.
Plot-6(Fuel economy) this plot shows the fuel consumption of vehicles per distance. This calculates the mileage of vehicles during the acceleration of vehicles.
Change in grade and wind velocity in the environment block:
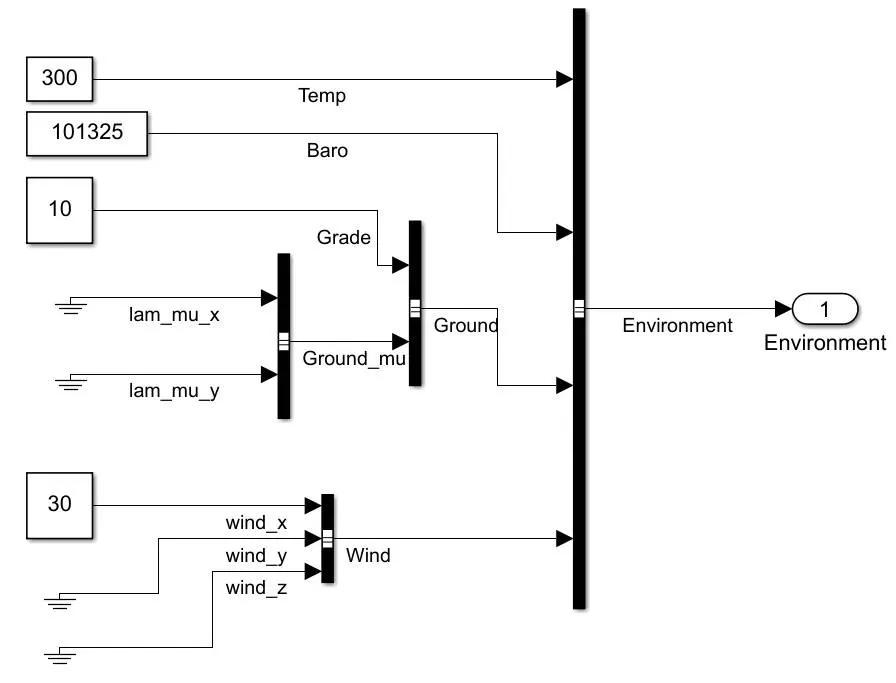
To change the wind velocity and grade open the “Environment” block from the loaded “Hev reference application model” there we could find constant blocks subjected to feed the input values for wind velocity and grade as shown in the below image. Here I had fed 10˚ as grade value and 30km/hr as wind velocity.
The obtained plot result is below,
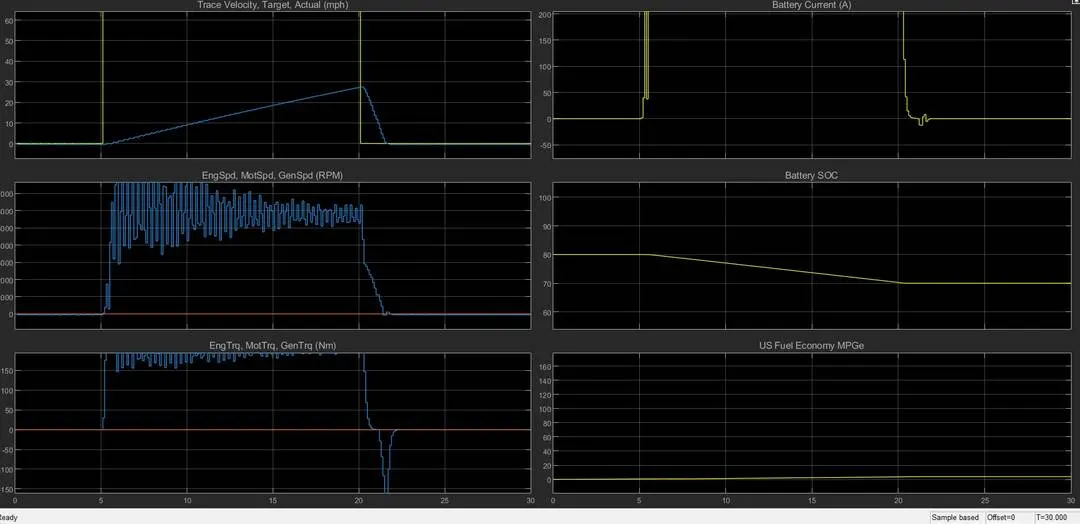
Plot:1, Torque of the model is low when compared with the default model, the maximum speed obtained is 50mph.
Plot:2, Motor speed, and engine speed are getting high compared with the default model since the grade value is greater than the default model.
Plot:3, Torque is raised as wind energy is applied in this model, therefore there will be increasing in torque when compared with the default model.
Plot:4, Battery current supply is also high, which gives more power to torque, the battery power is transmitted to torque and that should be passed to generator.
Plot:5, State of charge is not possible in the initial state by the continuous acceleration of the vehicle and raise in torque the SOC is not acting for some point when the slope portion is obtained and the torque will reduce then constant power will act that portion state of charge will acting.
Plot:6, Fuel economy is very high in this drive condition due to the wind and gradeability, the torque is gradually increased so that fuel consumption also becomes high.
4.Comparing the results of Hybrid and Pure Electric vehicle
Here all other parameters are kept constant and then the models are simulated to obtain results for both hybrid and pure electric vehicles.
(i) For hybrid electric vehicle model:
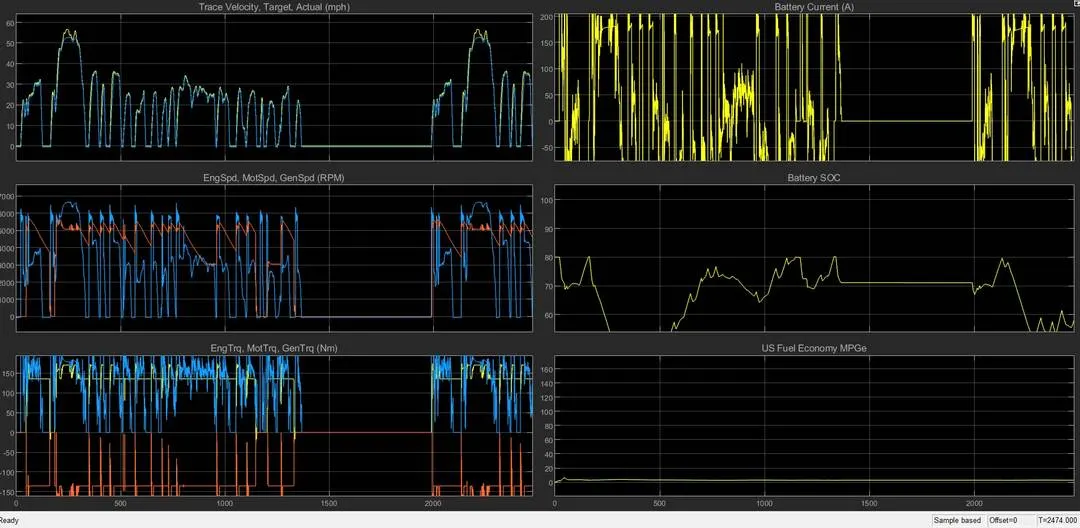
Hybrid electric vehicle obtains initial torque from the battery for the certain speed limit and it will interchange into IC engine after it reaches the required speed, hybrid vehicle can attain high speed in less time due to the torque offering by the battery.
The results obtained for the hybrid electric vehicle is shown below,
(ii) For Pure Electric vehicle model:
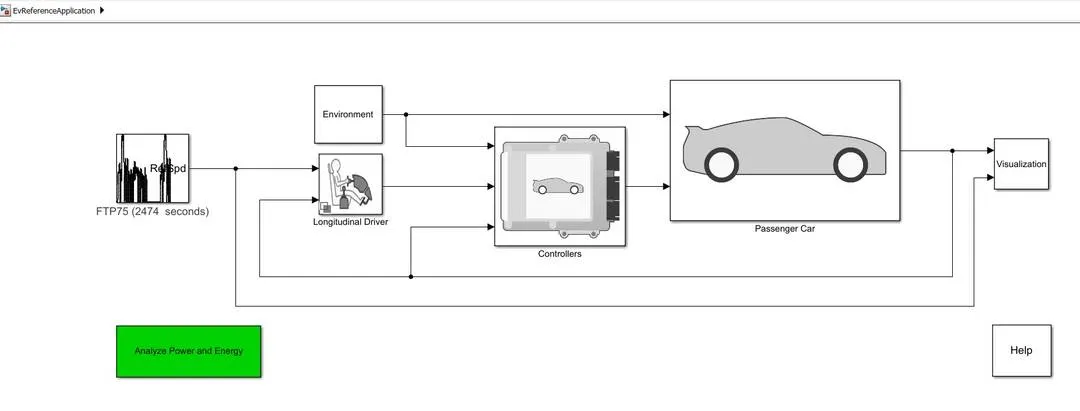
The electric vehicle reference application represents a fully electric vehicle model with a motor-generator, battery, direct-drive transmission, and associated powertrain control algorithms. Use the electric vehicle reference application for powertrain matching analysis and component selection, control, and diagnostic algorithm design.
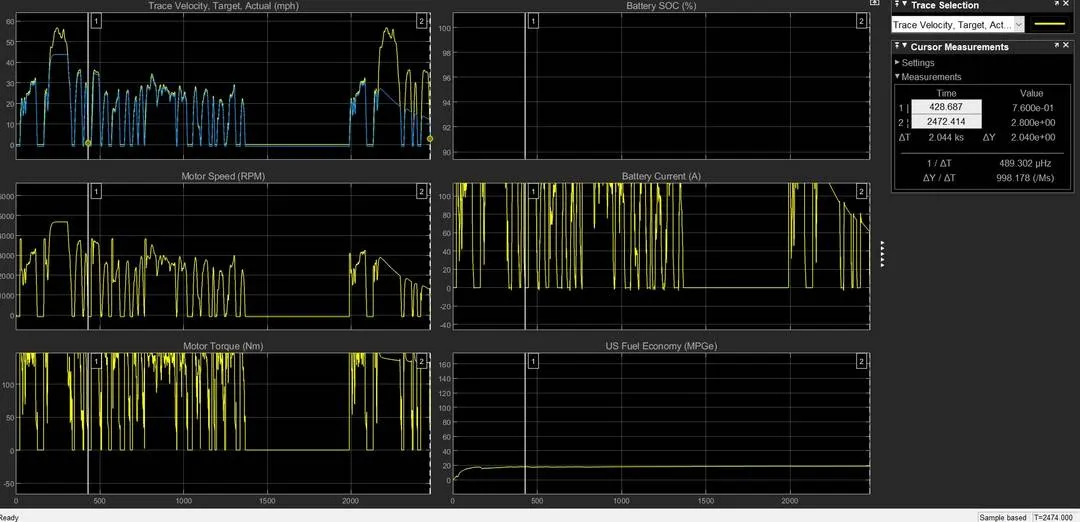
Comparison of hybrid electric vehicle model with an electric power train model.
The hybrid electric vehicle gives emission due to the result of fuel consumption, while the electric powertrain is a green technology that results in 0% emission.
Drivetrain loss for EV vehicle is more than that of HEV vehicle, but power loss in EV vehicle is less than HEV vehicle.
EV vehicle is more efficient than HEV vehicle because the battery used for electric vehicles is lithium-ion which has a low discharge rate than the battery used in HEV Ni-metal hybrid vehicle.
Conclusions:
- The mapped and dynamic model of engine, motor, and generator is studied, and the model type is changed by switching between mapped and dynamic mode.
- The calculation for miles per gallon is observed from the model and the factors considered for fuel flow are studied.
- HEV reference model is simulated with the WOT drive cycle condition and results are obtained, then again simulated with the change in wind velocity and grade in environment block, and results are obtained.
- The results for both hybrid and pure electric powertrains are obtained by simulation two different models and results are discussed.