Project
A simulation study of an all-terrain vehicle
This study is prepared in order to explain the given models in technical terms and to carry out system-level simulation of the given models. The given models are the all-terrain vehicle with CVT gear transmission,
Study:1 Baja ATV model
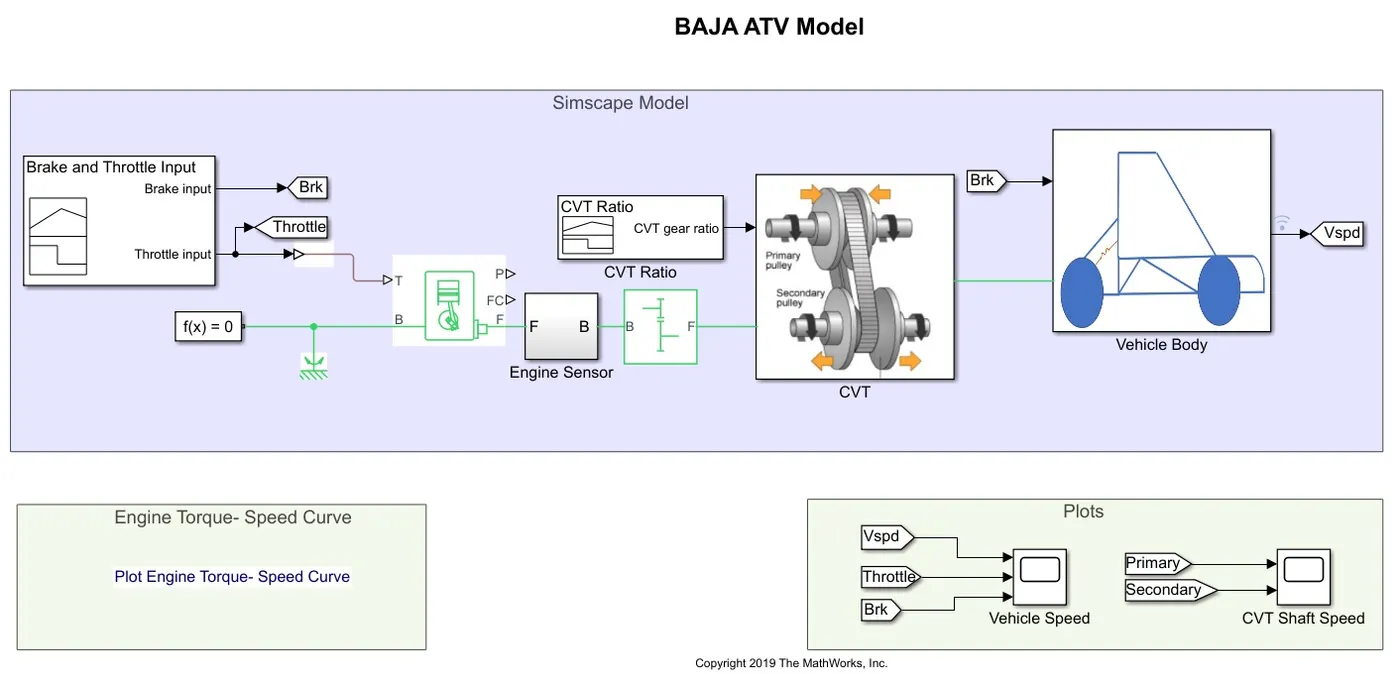
Fig: Baja ATV model
This model represents an all-terrain vehicle model, which consists of blocks such as signal builder, generic engine, engine sensor subsystem, rotational motion sensor, input and output shaft inertia, variable gear ratio, vehicle body subsystem, tire blocks, vehicle body, double shoe block, goto block, from block, scope, solver configuration block, mechanical rotational reference block.
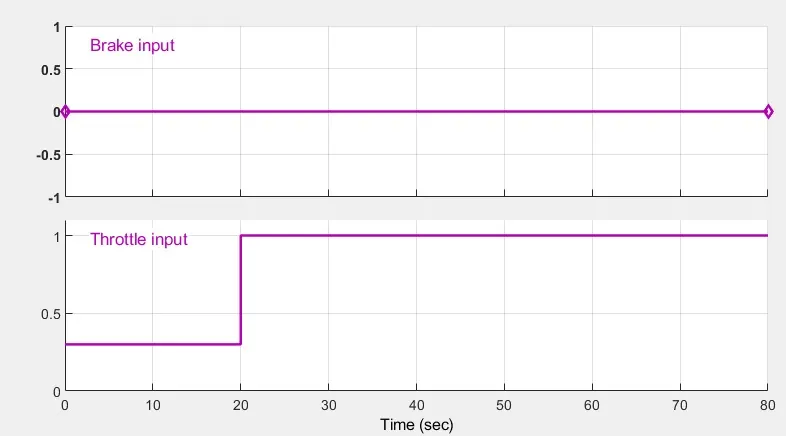
Fig: Brake and throttle input signal
The throttle and brake inputs are given by given by signal builder block. The throttle signal is induced in form of step input for a total time of 80 secs, i.e. for the first 20secs signal is set as constant as 0.3, and the input signal is increased to 1 for the remaining 60secs. But the braking is constant as the signal stays zero for the whole time of 80secs. The output signal from the signal builder block is fed into “Goto” block in order to use the signal for further various processes in the system as well as a subsystem.
Generic Engine block
The throttle signal is connected to the generic engine block, generic engine block represents system-level spark ignition and diesel engines only can be used for initial stages of modeling when only the basic parameters are available. Port T represents the throttle input port, ports F and B are mechanical rotational conserving ports associated with the engine crankshaft and engine block. Ports P and FC are signal output ports through which engine power and fuel consumption rate can be observed. Port B of the engine block is connected to the mechanical rotational reference and solver configuration block.
Engine Sensor subsystem
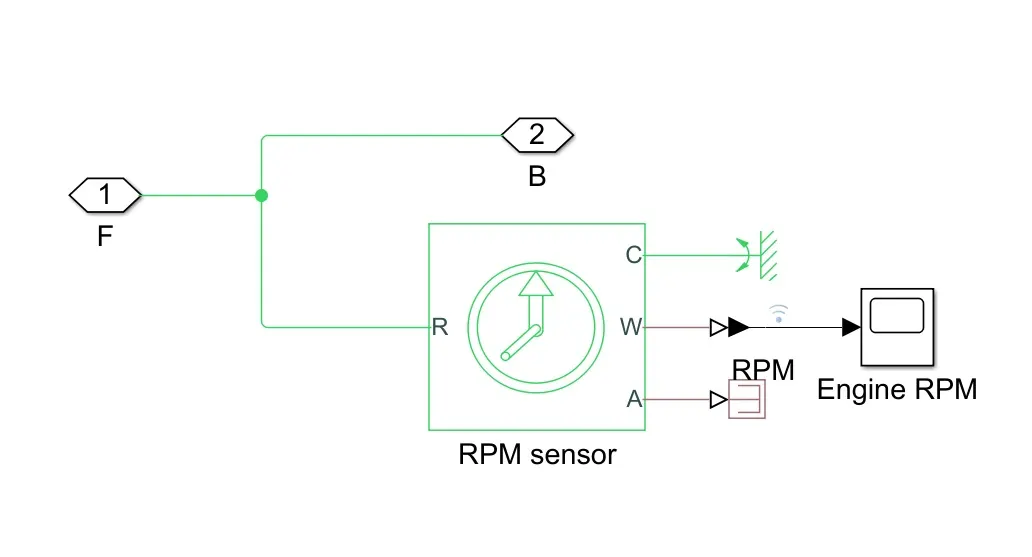
Fig: Engine sensor subsystem
The output port F is connected to an engine sensor subsystem. In this subsystem an ideal rotational motion sensor is used to measure the output of engine. Sensor block consists of port R and C which are mechanical rotational conserving ports, in which port R is connected with engine output signal and C is connected to mechanical rotational reference. Ports W and A represents ouptu ports for velocity and angular displacement. In which velocity is observed with scope, while displacement port is terminated in order to avoid warnings.
Then the output signal from the engine sensor is connected to simple gear with gear ratio of 4. Ports B and F are mechanical rotational conserving ports.
CVT subsystem
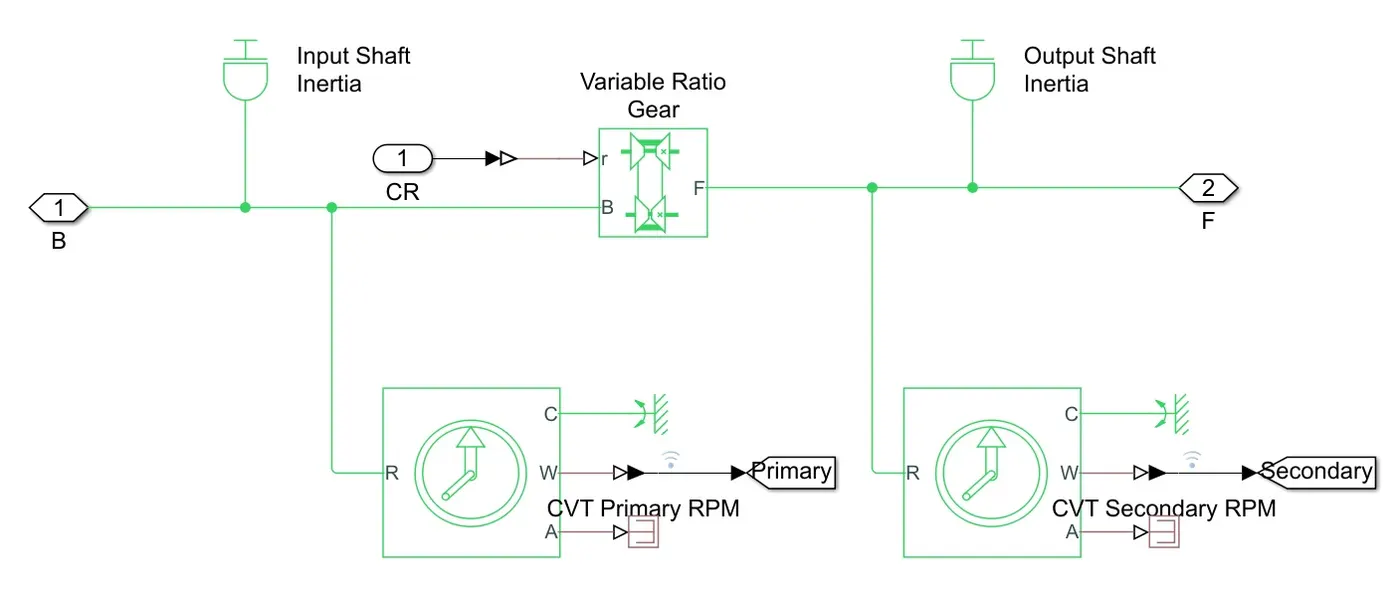
Fig: CVT subsystem
The output from the simple gear block is fed into a continuously variable transmission subsystem. Another signal builder block is used to feed the CVT gear ratio in form of signals. In the subsystem a variable ratio gear block is used, this block represents a variable ratio gearbox such as implemented by mechanical CVT belt, electric or hydraulic transmission. Port r is the ratio of input to output angular shaft velocities. Ports B and F are base and follower gear.
Gear ratio input
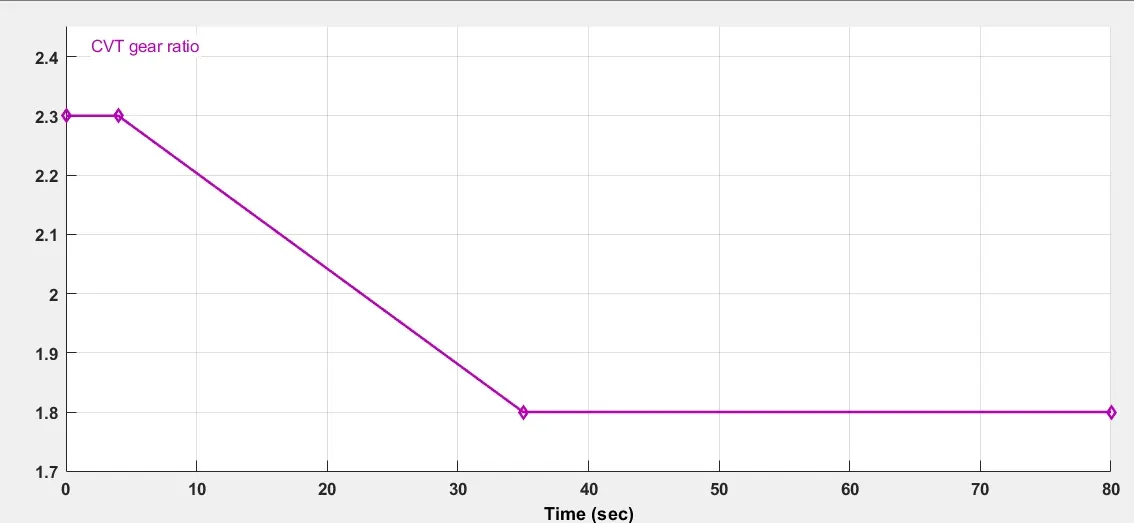
The signal which is given to the CVT subsystem is enabled through B port from a simple gear block. The ratio of input to output port r is activated by a variable signal created by the signal builder block. CVT gear ratio is implemented as 2.3 for about the first 4secs and decreased to 1.8 by inclination over a time of 31secs and maintained at 1.8 for the remaining time of 45secs.
Input and output shaft inertia blocks are connected to the base and follower connection and two ideal rotational motion sensors are connected to base and follower connection lines respectively. These motion sensors are used to observe rotations in the base and follower gear, velocity ports of both sensors are connected to scope for monitoring.
Vehicle body subsystem
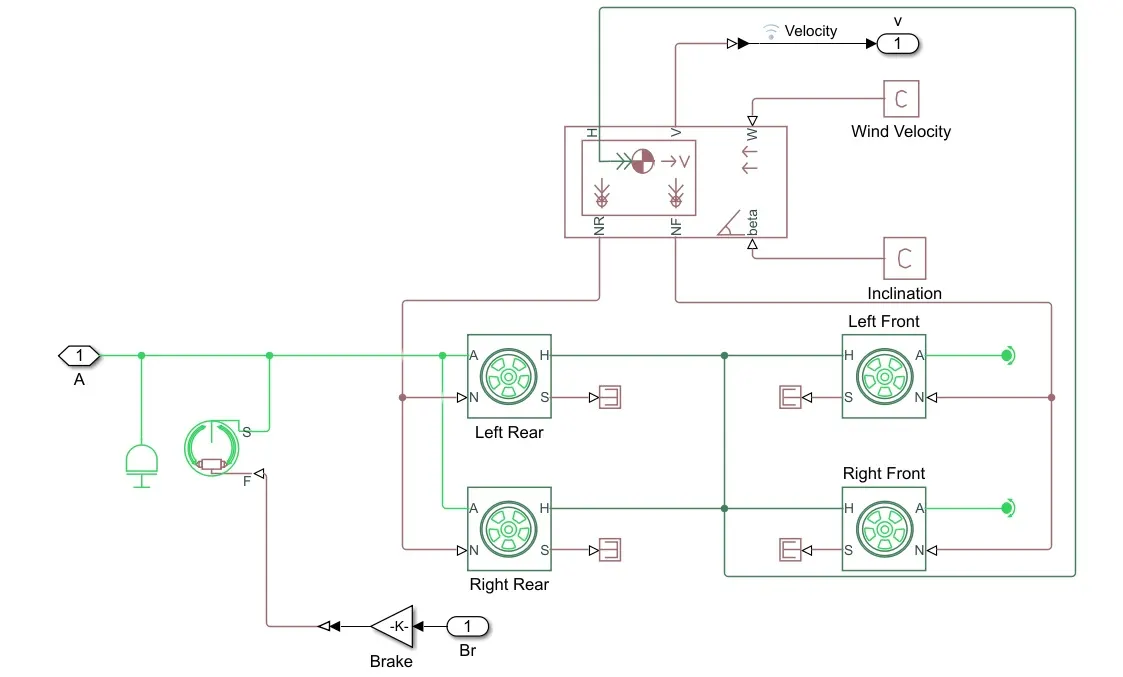
Fig: vehicle body subsystem
Then the signal from the CVT subsystem is fed into the vehicle body subsystem. The brake input signal from the initial point is now induced with the vehicle body subsystem as an input port. In this subsystem, it includes front and rear tire blocks, vehicle body block, double shoe brake, inertia output block.
The vehicle body block represents a two-axle vehicle body in longitudinal motion, this block considers body mass, aerodynamic drag, road incline and weight distribution between axles due to acceleration and road conditions given in vehicle body block connection H is mechanical translational conserving ports with respect to horizontal motion. Connection V is the output signal of vehicle velocity. Connections NR and NF are the normal wheel forces acting on the front and rear wheels.
Mass of the body = 250kg
No. of wheels per axle = 2
Connections W and beta are input ports corresponding wind speed and road inclination angle repectively.
Tire block represents the behavior of road tire. Connection A is the rotational conserving port for the wheel axle. The output signal from the CVT block is connected to the port A of the tire block to induce the rotational input. An inertia output shaft is connected to a rotational input connection to represent the shaft. And brake input is induced through the gain block. The function of the gain block is to multiply the input by a constant value and give as output. The output signal from the gain block is induced to rotational input signal to tire through a double shoe brake block which represents brake with ports F and S which input and output ports respectively.
Connection H of the tire is block represents the port for wheel hub, all connections that represent H are connected to H port of vehicle body block. Connection N is an input port that applies normal force acting on the tire. Connections NF and NR are connected to N ports of front and rear tire blocks respectively. Connection S is an output port that reports slip in the tire, which is terminated in this model.
Connection V is the output signal of the vehicle body block which gives the velocity with which the vehicle operates. So it is achieved in the scope to monitor the speed of the vehicle. Connections W and beta of vehicle body block representing wind speed and road inclination are connected to each separate ps-constant block.
Thus, the resulting velocity from the vehicle body system is plotted in scope in order to obtain the output. And primary and secondary shaft speed is also obtained in a single scope to find the speed difference.
Output
- Vehicle speed
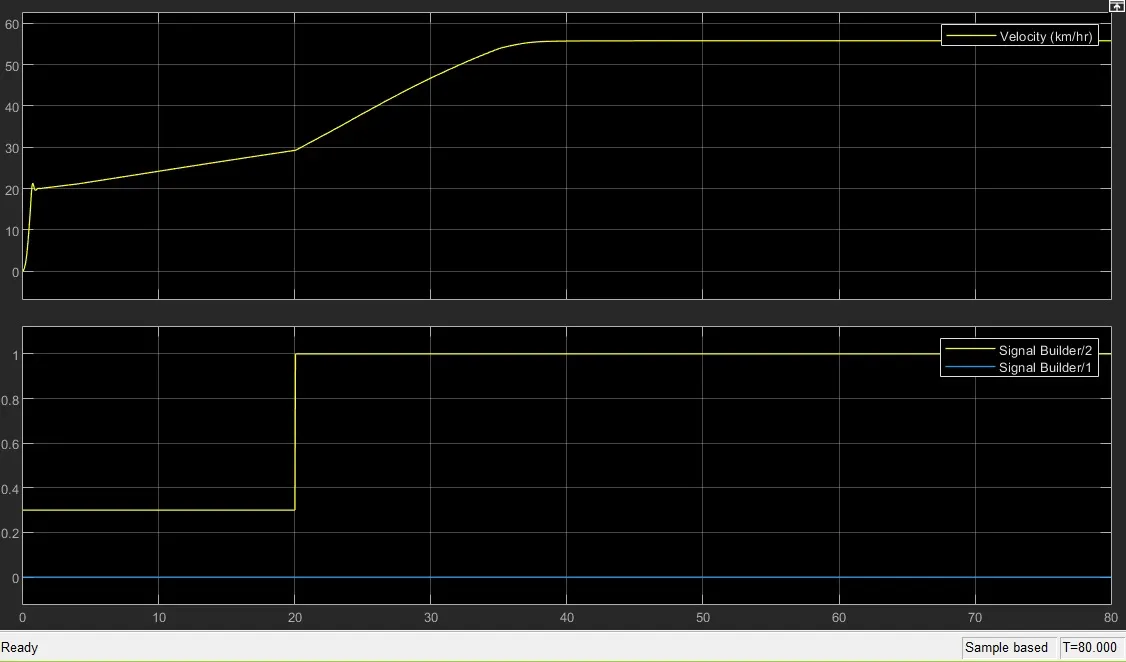
In the above fig first graph represents the velocity obtained at the end of the simulation as output. In the second graph it represents the input signals such as brake and throttle signals. For throughout the simulation period brake signal was constant as zero, but the throttle was maintained at 0.3 for 20secs and then it is increased to 1 for the remaining time period. According to the input throttle signal, the velocity curve was obtained with an increasing curve with the effect of the increased throttle.
2.Shaft speed
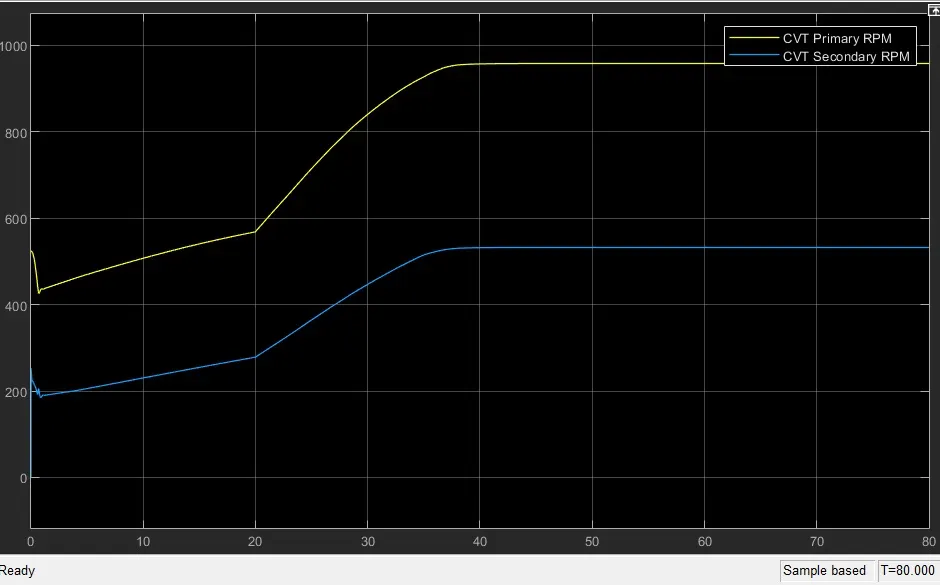
The above diagram shows the speed of shafts obtained due to the impact of variable-ratio gear. The secondary speed curve shows to be lower than that of the primary because the primary gear radius is smaller than the secondary gear radius.
Study: 2 Baja ATV model with dashboard
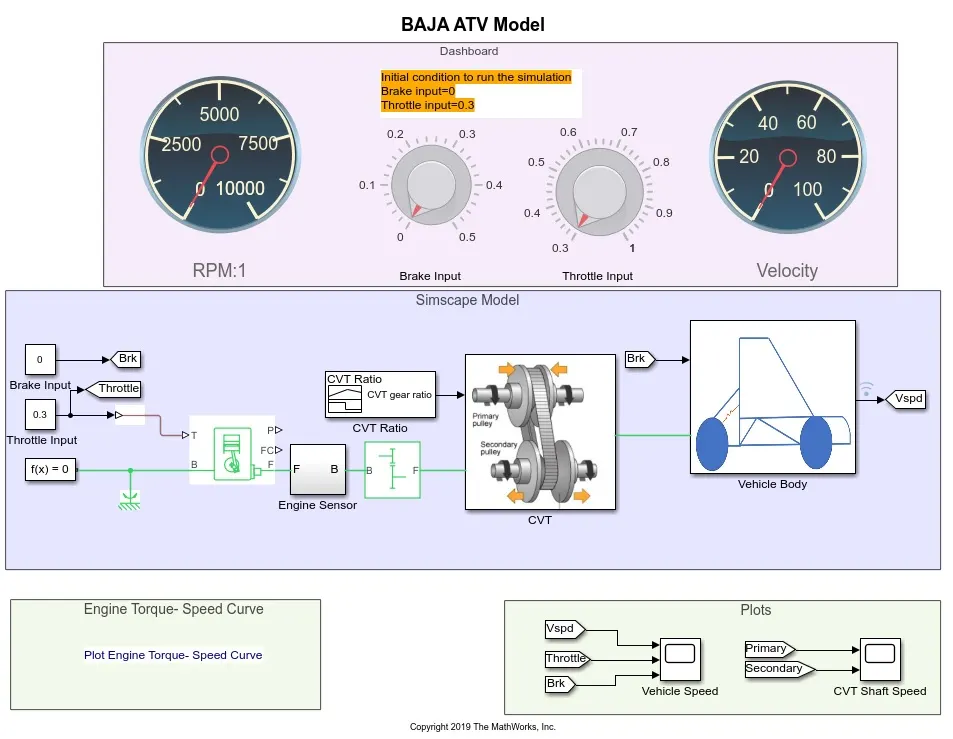
In the above model, constant input for throttle and brake are not given instead a dashboard is used here to vary throttle and brake input. The model consists same arrangement as the previously discussed model, but here inputs are given using a knob given in the dashboard in order to obtain the condition of varying the input signals. Throttle input can be varied from 0.3 to 1 using the throttle knob. Brake input can be varied from 0 to 0.5 using the brake knob engaged in the dashboard.
And also two gauges are provided in the dashboard in order to monitor the velocity of the vehicle and rpm gauge. CVT gear ratio signal given to the CVT subsystem is the same as the previous model with 2.3 for the first 4 seconds and gradually decreases to 1.8 over a time of 31secs and maintains at 1.8 for the rest of the time period of 80secs.
Output
1.Vehicle speed
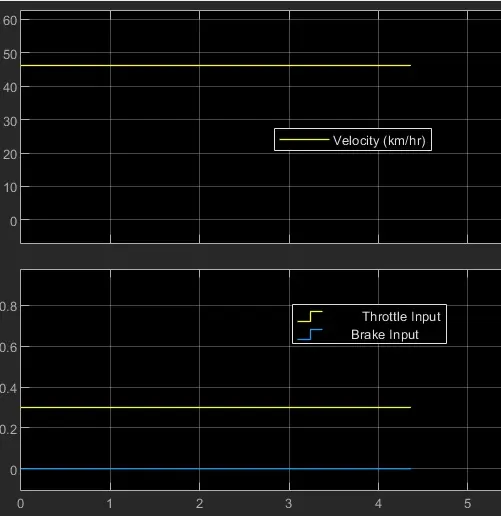
The above fig shows the behavior of the velocity of the vehicle when throttle set as 0.3 and brake as 0, which is the initial condition.
2.Shaft speed
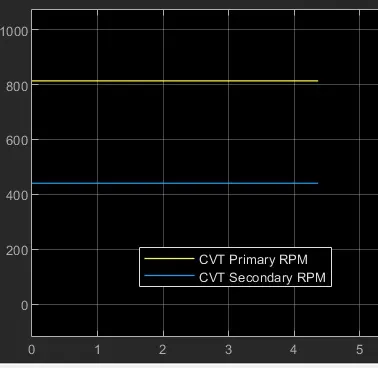
The above fig shows the corresponding speed of primary and secondary shaft speed when input signals are set to initial conditions. The output represents the radius of the primary shaft is lesser than the secondary shaft.
Study: 3 Baja ATV model using a lookup chart
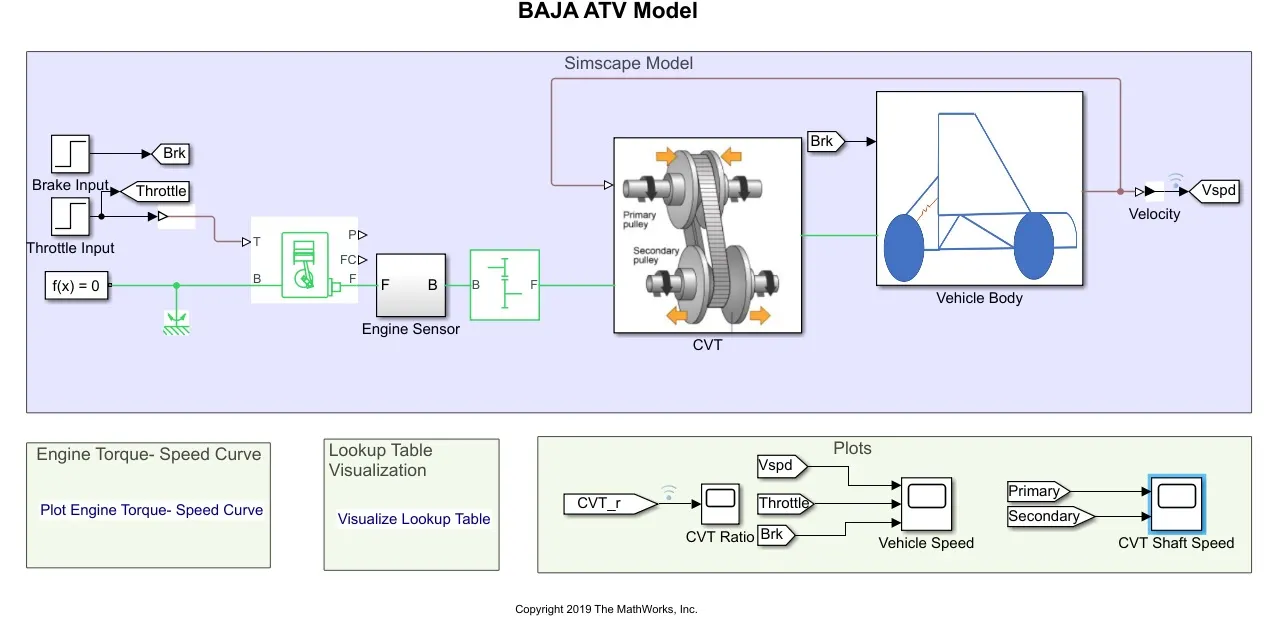
The above model represents the model using a lookup chart, this model is arranged in a way similar to the first model discussed, but here input signals are given in step block for both throttle and brake input instead of using signal builder. And also in the CVT subsystem, a lookup table is used to give input CVT ratio for variable ratio gear.
In this model CVT gear ratio is not given externally using a signal builder block, instead, a lookup table is used to induce input gear ratio for variable ratio gear. The output data from the vehicle body subsystem is taken and fed into a lookup table to connect to the variable-ratio gear block under the CVT subsystem. A lookup table maps input and output data. It retrieves the corresponding output values for the given input values. If the input value is outside specified values then output values are determined using the extrapolation method and uses the interpolation method if the input values are between two consecutive grid points.
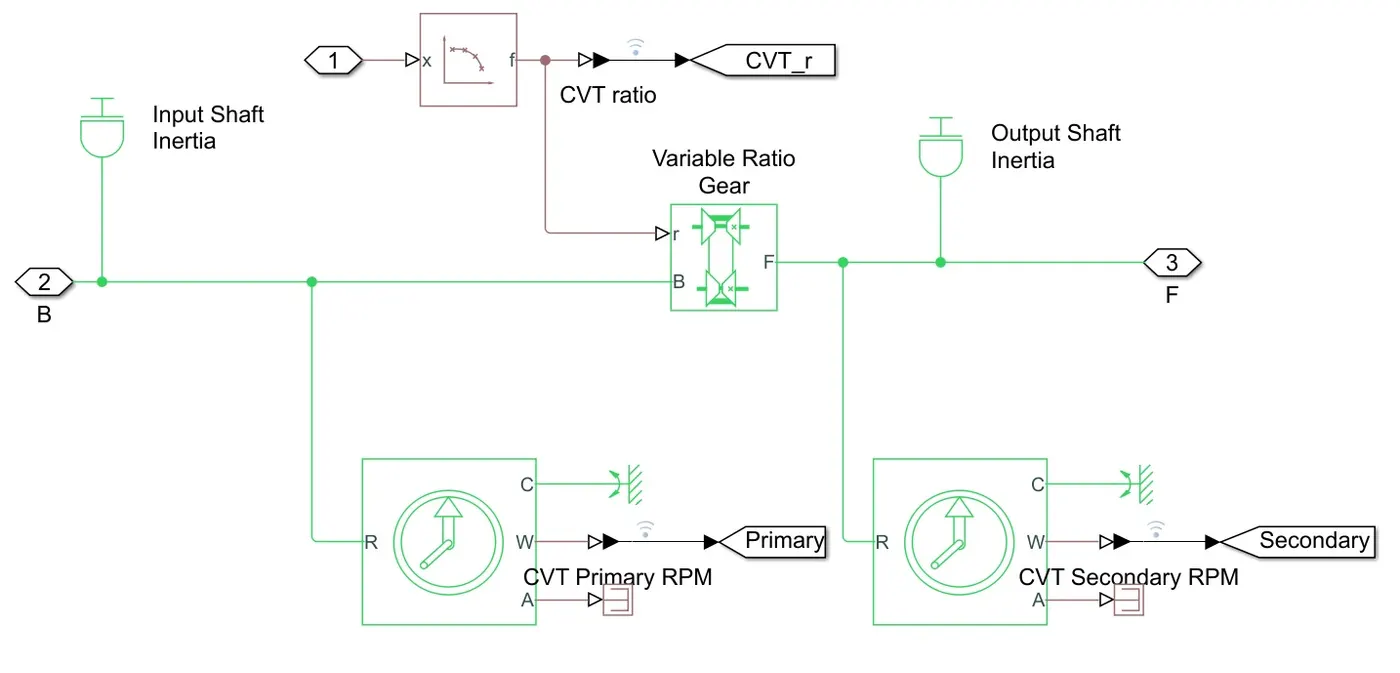
Fig: CVT subsystem
Output
1.Vehicle speed
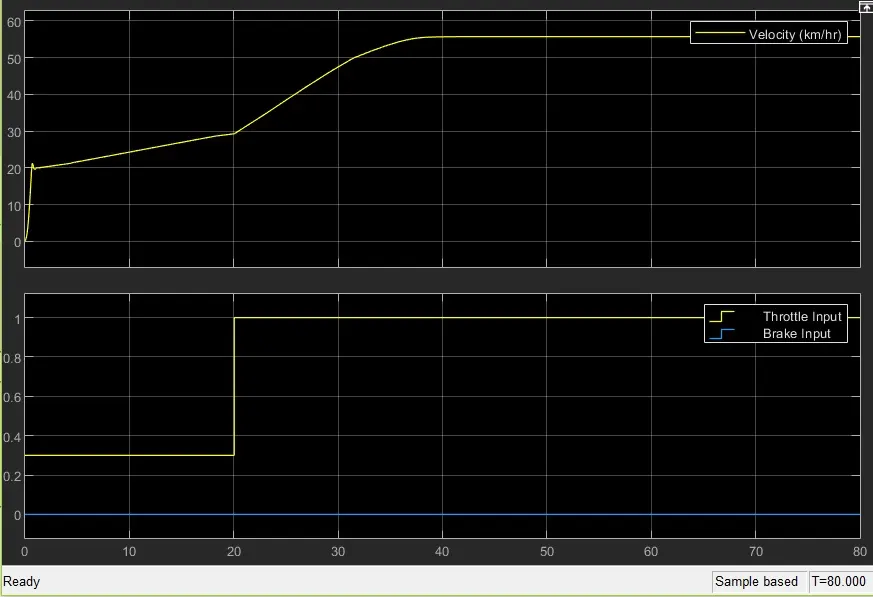
The above fig, the first graph shows the velocity developed in the model at the vehicle body, due to the step input given as throttle and brake which is given in the second graph for the time period of 80 secs. The input signal of braking was constant as zero for the entire time period, while the throttle was 0.3 for the first 20secs and then increased to 1 for the remaining time period.
2.Shaft speed
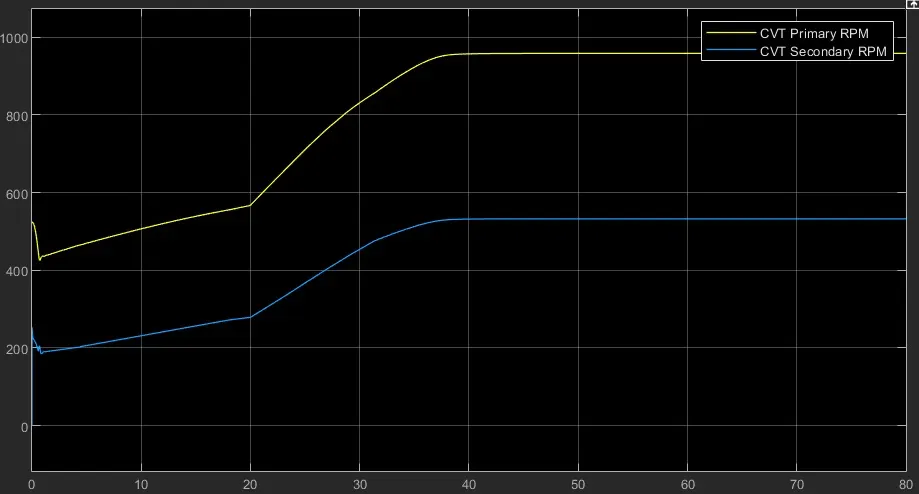
The above fig represents the curve of primary and secondary shaft speed obtained in the CVT subsystem during the simulation period. The curve is similar as obtained in the first CVT model we discussed which means that the secondary gear radius is more than the primary gear radius.
3.CVT ratio
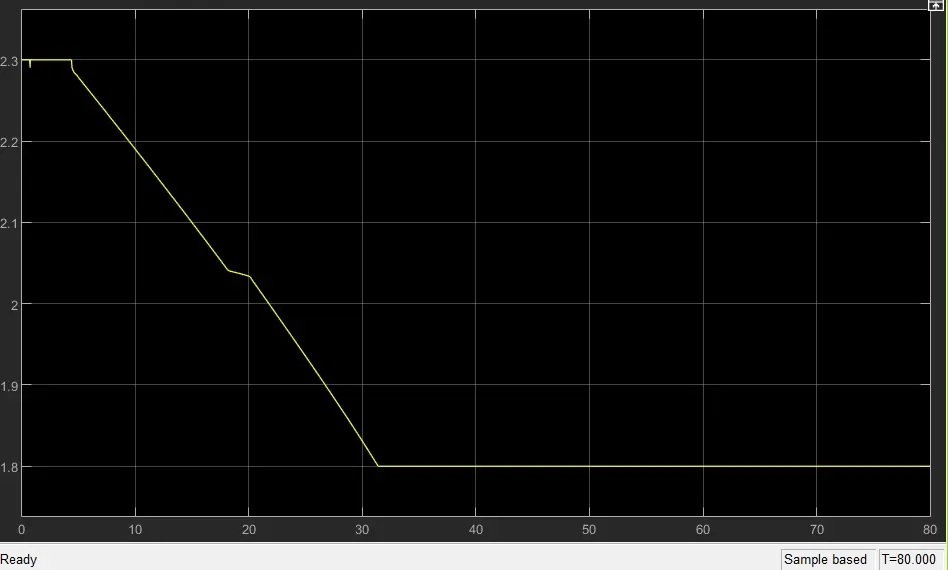
The above fig represents the gear ratio obtained by the lookup chart with respect to the input. It exhibits almost the same as the gear ratio signal used in the first model using a signal builder.
Study:4 Baja ATV model using lookup chart with dashboard
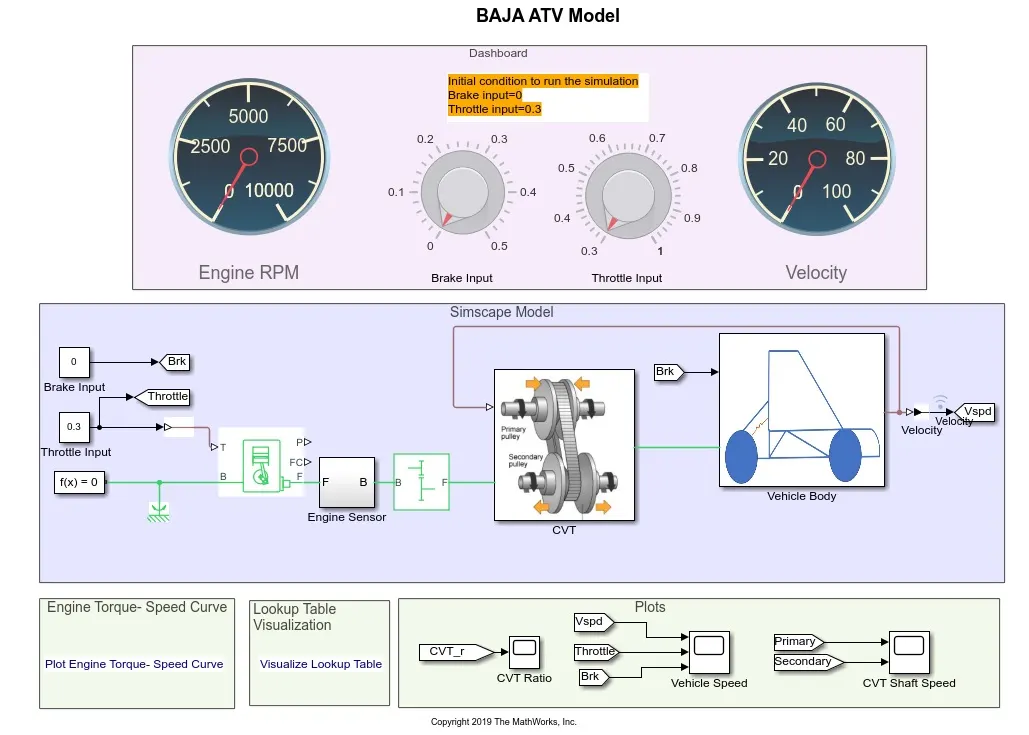
The above model shows the ATV model with the dashboard, the arrangement and operation are similar to that of the model discussed previously, but the usage of the dashboard draws the difference from the previous model. And also gear ratio is processed as shown in the previous model using a lookup chart. Velocity and input signals such as throttle and brake are observed through a scope in order to find the impact caused to the system. And primary and secondary shaft speeds are also monitored through the scope. The output of this model exhibits the same behavior of the second ATV model we discussed, so here the output is achieved with different input values other than the initial condition, the initial condition’s output behavior is given in the second model we discussed earlier.
Output
1.Vehicle speed
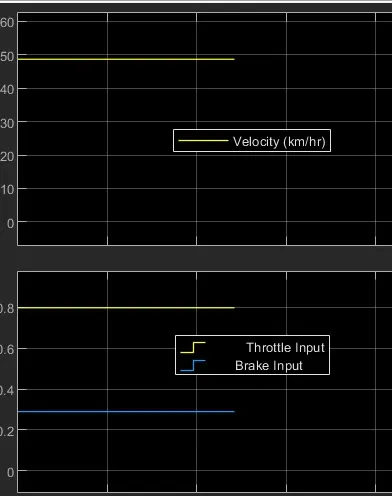
The above fig shows the velocity behavior when given throttle and brake input other than initial conditions. The throttle input given as 0.8 and the brake input was given as 0.3, to obtain the above velocity profile.
2. Shaft speed
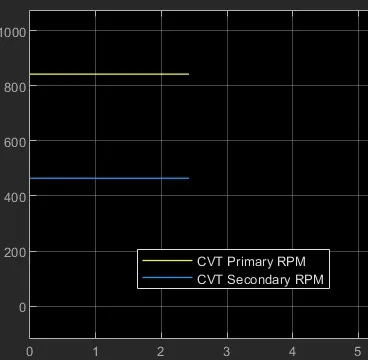
The above fig represents the primary and secondary shaft speed corresponding to throttle and brake. It shows that the secondary shaft speed is lesser than that of the primary shaft which defines the radius of the secondary shaft is greater than that of the primary shaft.
Results:
- As the throttle increases the power from the engine will increase and thus the velocity will increase. In the initial stage, velocity tends to decrease in the gear ratio.
- As the brake input is increased the speed of the vehicle will decrease and also RPM also decreases, when speed decreases to 20kmph and still brakes are applied then the engine will be turned down or the model will automatically shut down.
- When the gear ratio is higher, it gives high torque which results in the low-velocity output.