Project 1 - Parsing NASA thermodynamic data
Parsing thermodynamic NASA data
AIM:
The aim of this project is to write code to read the data from the NASA thermodynamic data file and to calculate the thermodynamic properties of species.
Objective:
To write a function that extracts the co-coefficients and calculates the enthalpy, entropy, and specific heats for all the species in the data file.
To calculate the molecular weight of each species and display it in the command window.
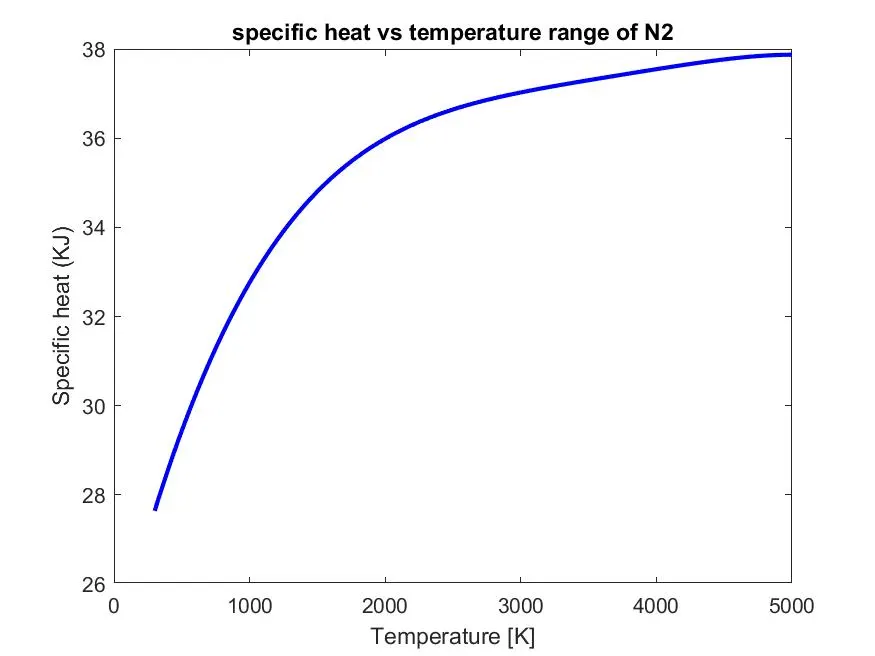
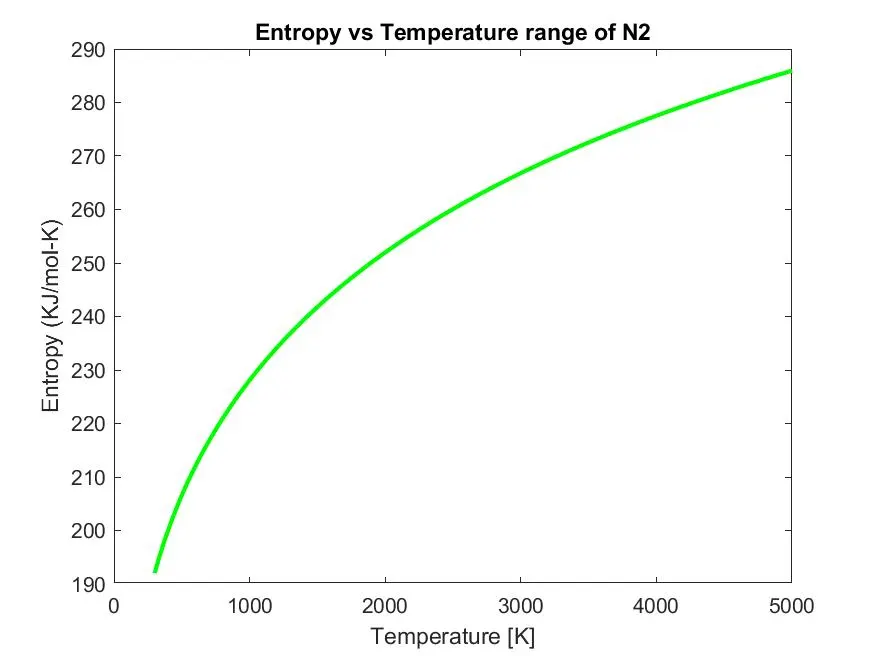
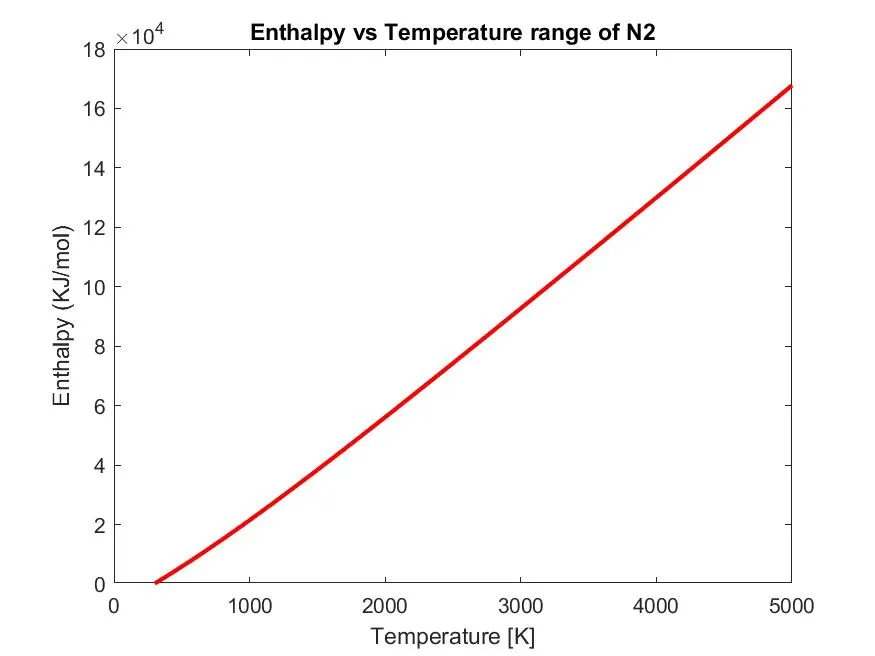
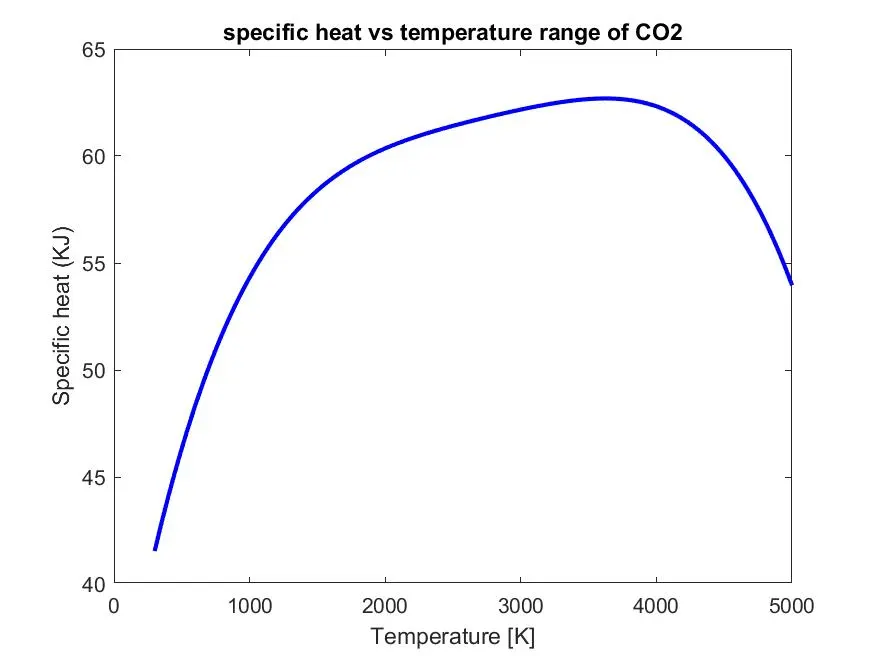
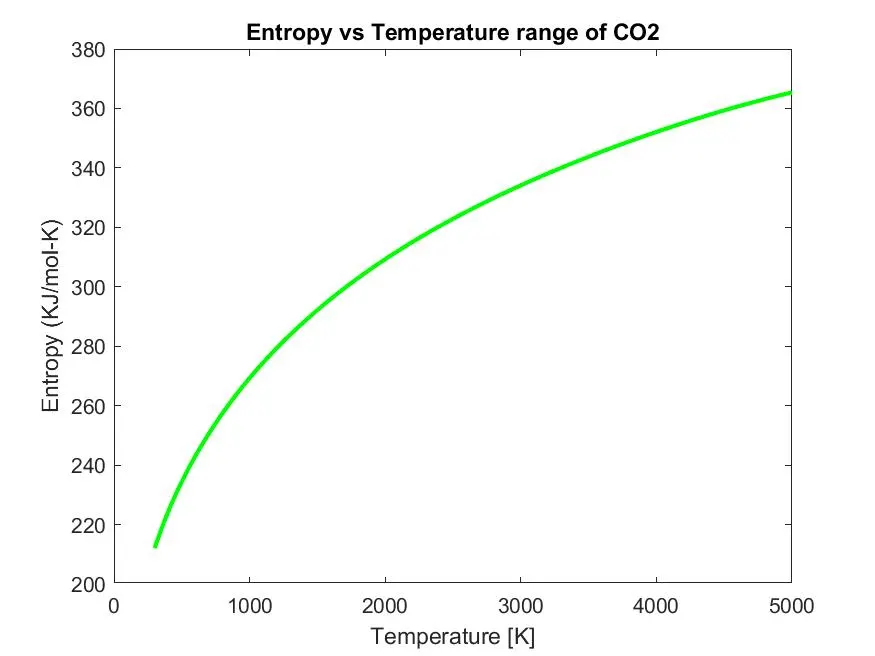
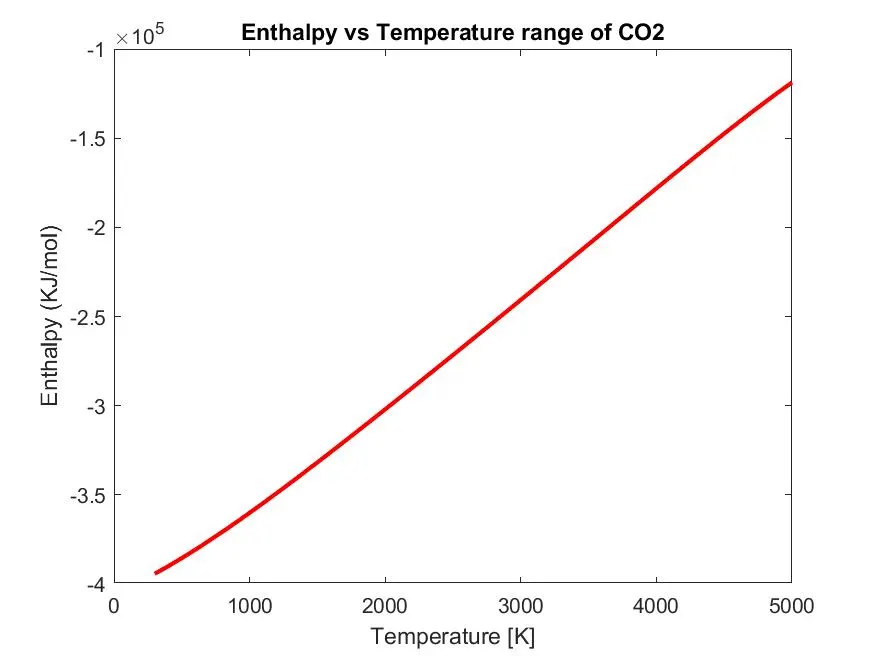
To plot the Cp, Enthalpy, and Entropy for the local temperature range for each species and save the plots as images with appropriate names in separate folders for each species with a suitable name.
Theory
File parsing:
Parsing or syntactic analysis is the process of analyzing a string of symbols. The term parsing comes from Latin pars, meaning part. Within computational linguistics the term is used to refer to the formal analysis by a computer of a sentence or other string of words into its constituents, resulting in a parse tree showing their syntactic relation to each other which may also contain semantic and other information.
Here we have a data file consists of thermodynamic data of NASA, it consists of data of 53 species and 14 coefficients. Data from the file is read and then the properties of species are calculated using the below formula.
Formula for calculating enthalpy, entropy, and specific heat,
Specific heat:
The specific heat is the amount of heat per unit mass requires to raise the temperature by one degree Celsius. The relationship between heat and the temperature change is usually expressed in the form shown below,
Cp/R = a1 + a2 T + a3 T2 + a4 T3 + a5 T4
Enthalpy:
Enthalpy is a property of a thermodynamic system, which is equal to the system’s internal energy and the product of its pressure and volume. In a system, to prevent mass transfer for processes at constant pressure, the heat absorbed or released equals the change in enthalpy.
H/RT = a1 + a2 T/2 + a3 T^2/3 + a4 T^3/4 + a5 T^4/5 + a6/T
Entropy:
Entropy is the measure of a system’s thermal energy per unit temperature that is unavailable for doing useful work. Because work is obtained from ordered molecular motion, the amount of entropy is also the measure of the molecular disorder or randomness of a system.
S/R = a1 lnT + a2 T + a3 T2/2 + a4 T3/3 + a5 T4/4 + a7
Where,
Cp = Specific heat
H = Enthalpy
S = Entropy
R = Universal constant
T = Temperature
a = coefficient
The first seven coefficients are high-temperature coefficients and the second seven coefficients are low-temperature coefficients.
CODE:
The Matlab files of the main code and its function codes are uploaded to google drive and the access link to the folder is https://drive.google.com/drive/folders/17r1ksbWksWnnPl4hgAfw0wkRlRsQs7CM?usp=sharing
clear all
close all
clc

%input
%gas constant
R = 8.314;

%Open and read "THERMO.dat" file
f1 = fopen('THERMO.dat','r');

%Reading the title of file
get = fgetl(f1);

%Reading global temperature from this file
temp = fgetl(f1);

%splitting
s = strsplit(temp);

%converting string cells to number
lowtemp = str2num(s{2});
midtemp = str2num(s{3});
hightemp = str2num(s{4});

%Temperature range
T = linspace(lowtemp,hightemp,1000);

%skipping comment lines
for i = 1:3
    get = fgetl(f1);
end


%Reading the species
for j = 1:53
    line1 = fgetl(f1);

    %splitting cell
    A = strsplit(line1,' ');

    %to read the name of the species
    species = (A{1});

    %converting string to number
    low_temp = str2num(A{end-3});
    mid_temp = str2num(A{end-2});
    high_temp = str2num(A{end-1});

    line2 = fgetl(f1);
    %to find string E
    a = strfind(line2,'E');

    %finding higher coefficients
    a1 = line2(1:a(1)+3);
    a1 = str2num(a1);
    a2 = line2(a(1)+4:a(2)+3);
    a2 = str2num(a2);
    a3 = str2num(line2(a(2)+4:a(3)+3));
    a4 = str2num(line2(a(3)+4:a(4)+3));
    a5 = str2num(line2(a(4)+4:a(5)+3));

    line3 = fgetl(f1);
    b = strfind(line3,'E');
    a6 = str2num(line3(1:b(1)+3));
    a7 = str2num(line3(b(1)+4:b(2)+3));

    %finding lower coefficents
    a8 = str2num(line3(b(2)+4:b(3)+3));
    a9 = str2num(line3(b(3)+4:b(4)+3));
    a10 = str2num(line3(b(4)+4:b(5)+3));

    line4 = fgetl(f1);
    c = strfind(line4,'E');
    a11 = str2num(line4(1:c(1)+3));
    a12 = str2num(line4(c(1)+4:c(2)+3));
    a13 = str2num(line4(c(2)+4:c(3)+3));
    a14 = str2num(line4(c(3)+4:c(4)+3));


    %calculate specific heat
    Cp = Specific_heat(a1,a2,a3,a4,a5,a8,a9,a10,a11,a12,T,R,midtemp);

    %calculate entropy
    S = Entropy(a1,a2,a3,a4,a5,a7,a8,a9,a10,a11,a12,a14,T,R,midtemp);

    %calculate enthalpy
    H = Enthalpy(a1,a2,a3,a4,a5,a6,a8,a9,a10,a11,a12,a13,T,R,midtemp);

    %calculate molecular weight of the species
    W = Molecular_weight(species);


    %plotting Cp,H,S with temperature
    %to save file
    cd('F:/Sample Practice/Matlab/file parsing/Species')
    mkdir(species)
    cd(species)

    %plot1 Cp vs T
    figure(1)
    plot(T,Cp,'linewidth',2,'color','b');
    xlabel('Temperature [K]')
    ylabel('Specific heat (KJ)');
    title(sprintf('specific heat vs temperature range of %s', species))
    saveas(figure(1),'SpecificHeat.jpg')

    %plot2 S vs T
    figure(2)
    plot(T,S,'linewidth',2,'color','g')
    xlabel('Temperature [K]')
    ylabel('Entropy (KJ/mol-K)')
    title(sprintf('Entropy vs Temperature range of %s',species));
    saveas(figure(2),'Entropy.jpg')

    %plot3 Cp vs T
    figure(3)
    plot(T,H,'linewidth',2,'color','r')
    xlabel('Temperature [K]')
    ylabel('Enthalpy (KJ/mol)');
    title(sprintf('Enthalpy vs Temperature range of %s',species))
    saveas(figure(3),'Enthalpy.jpg')

    %changing directory to original path
    cd('F:/sample practice/Matlab/file parsing')
end
Explanation:
Matlab code is started with clear all, close, clc command in order to close previous works and previous results, then universal gas constant R-value is assigned.
To open the NASA thermodynamic data file named “THERMO.dat”, fopen command is used. After opening the file, “fgetl” command is used to read the data line by line. Title and global temperatures are obtained by using “fgetl” command. To split the temperature line “strsplit” command is used and thus the obtained will be in form of a string cell and to convert this string to a number “str2num” command is used. In order to skip three command lines “for” loop is used.
To read fifty-three species “for” command is used, then “fgetl” command is used and “strsplit” is used to split the obtained data. Elements are labeled as species and obtained temperature is converted to number from string. Then the coefficients are read and assigned as “a” (1:14 coefficients).
Then specific heat, entropy, enthalpy, and molecular weight of the species is calculated by using separate functions code for each parameter. Function codes are based on the given formula.
Then directory is specified where files are to be saved, using “cd” (change directory) command and “mkdir” is used to create a directory for the species.
Plots obtained for “Cp vs T”, “S vs T” and “Cp vs T” are labeled with x and y-axis and the title is given, then the plots are saved in the specified directory under each species name. Then again directory is changed to the original path to continue the loop.
Function code to calculate specific heat(Cp):
function Cp = Specific_heat(a1,a2,a3,a4,a5,a8,a9,a10,a11,a12,T,R,midtemp)

%specific heat for higher and lower temperature

if (T<=midtemp)
    Cp = R*(a8+(a9*T)+(a10*(T).^2)+(a11*(T).^3)+(a12*(T).^4));

else
    Cp = R*(a1+(a2*T)+(a3*(T).^2)+(a4*(T).^3)+(a5*(T).^4));
end
end
The above code calculates the specific heat for higher and lower temperatures. The condition is executed using “if” condition for higher and lower temperatures. Coefficients, gas constant, and temperature are assigned to the function code.
Function code for Entropy(S):
function S = Entropy(a1,a2,a3,a4,a5,a7,a8,a9,a10,a11,a12,a14,T,R,midtemp)

%calculating entropy for higher and lower temperature respectively
if (T <= midtemp)
    S = R*(a8.*log(T)+(a9*T)+((a10*(T).^2)/2)+((a11*(T).^3)/3)+((a12*(T).^4)/4)+a14);

else
    S = R*(a1.*log(T)+(a2*T)+((a3*(T).^2)/2)+((a4*(T).^3)/3)+((a5*(T).^4)/4)+a7);
end
end
Entropy is calculated using the Entropy function code by assigning coefficients, gas constant, and temperature. “if else” loop is used to execute a condition based on mid-temperature in order to opt for the formula from the given two formula.
Function code for Enthalpy:
function H = Enthalpy(a1,a2,a3,a4,a5,a6,a8,a9,a10,a11,a12,a13,T,R,midtemp)

%calculating enthalpy for higher and lower temperature respectively
if (T <= midtemp)
    H = R*T.*(a8+((a9*T)/2)+((a10*(T).^2)/3)+((a11*(T).^3)/4)+((a12*(T).^4)/5)+(a13./T));

else
    H = R*T.*(a1+((a2*T)/2)+((a3*(T).^2)/3)+((a4*(T).^3)/4)+((a5*(T).^4)/5)+(a6./T));
end
end
The above function code is for calculating enthalpy for the species. It’s also executed as a previous function code, using “if else” loop for the same temperature condition and coefficients, gas constants, temperature, and mid-temperature is assigned.
Function code to calculate Molecular weight of the species:
function W = Molecular_weight(species)

%Defining Atomic name of the species
atomic_name = ['H','C','O','N','Ar'];

%Defining Atomic masses of main species
atomic_weight = [1.008 12.011 15.999 14.007 39.948];

%Molecular weight starting range
W = 0;

%for the number of species
for i = 1:length(species)
    %for the number of atomic names
    for j = 1:length(atomic_name)
    %function to compare two strings
    if strcmp(species(i),atomic_name(j))
        W = W + atomic_weight(j);
        position = j;
    end
end
%if there is more element
n = str2num(species);

if n>1
    W = W+atomic_weight(position)*(n-1);
end
end
fprintf('Molecular weight of %s :',species);
fprintf('%f',W);
disp(' ')
end
The molecular weight function is created, and the atomic name of the five main gas elements is declared and the atomic weight of the gas elements are also declared. The initial condition of molecular weight is assigned as 0. A “for” loop is created which runs to the length of the species and another nested “for” loop is used which runs to the length of the atomic name.
Then “strcmp” command is used under “if” loop to compare the species and atomic name. Molecular weight is assigned when both values are found same. Str2num command is used to convert string to a number and assign it to n. Then “if else” loop is used to find whether the species contains more than one element and then the molecular weight is calculated. Then “fprintf” command is used to display molecular weight in the command window.
Results:
Plots of O2
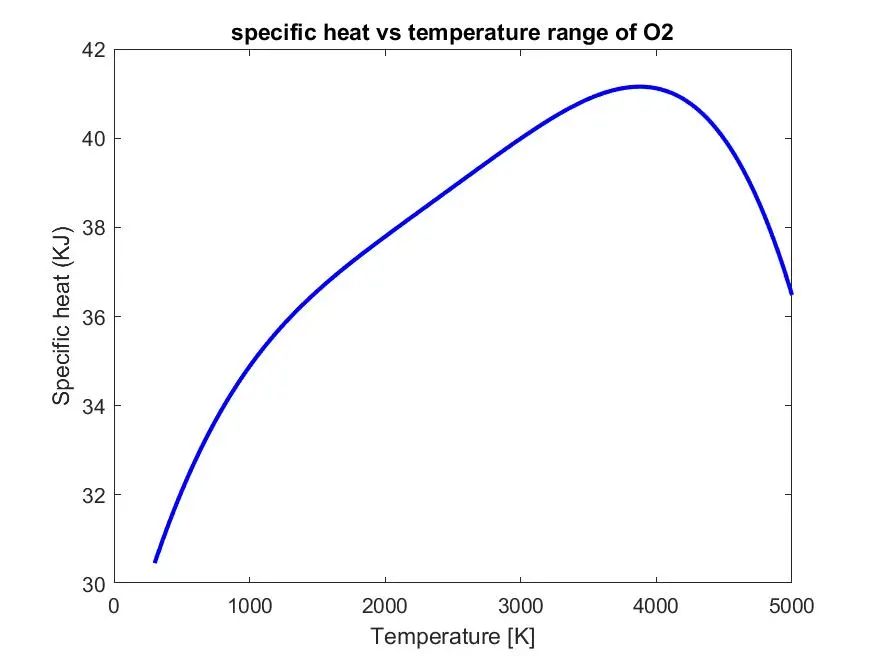
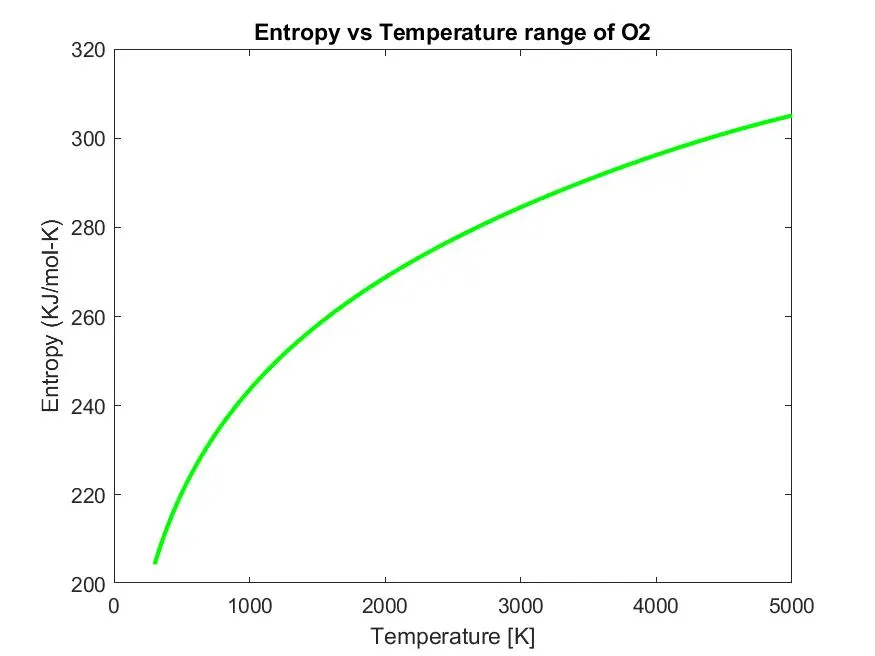
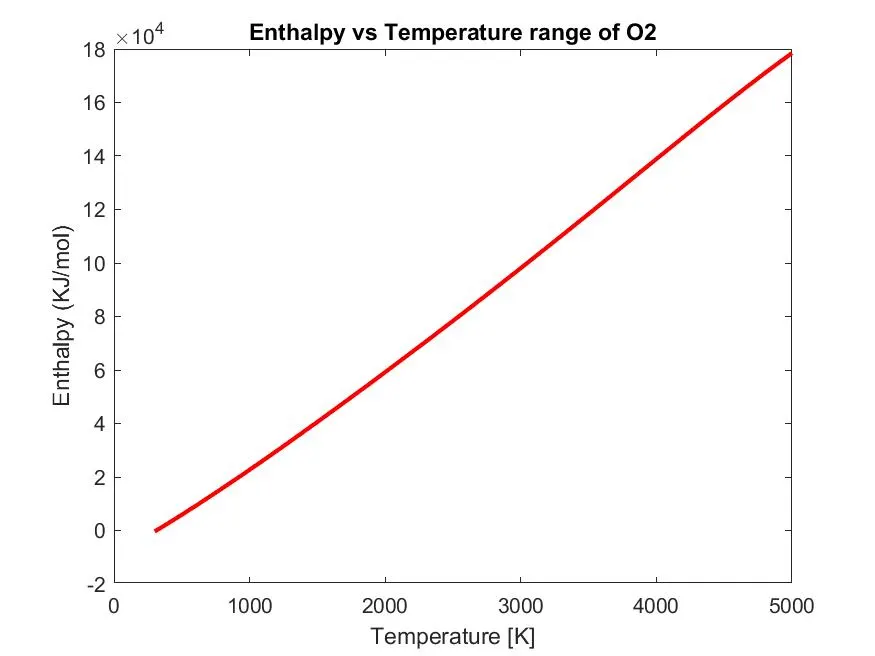
Plot of N2
Plot of CO2
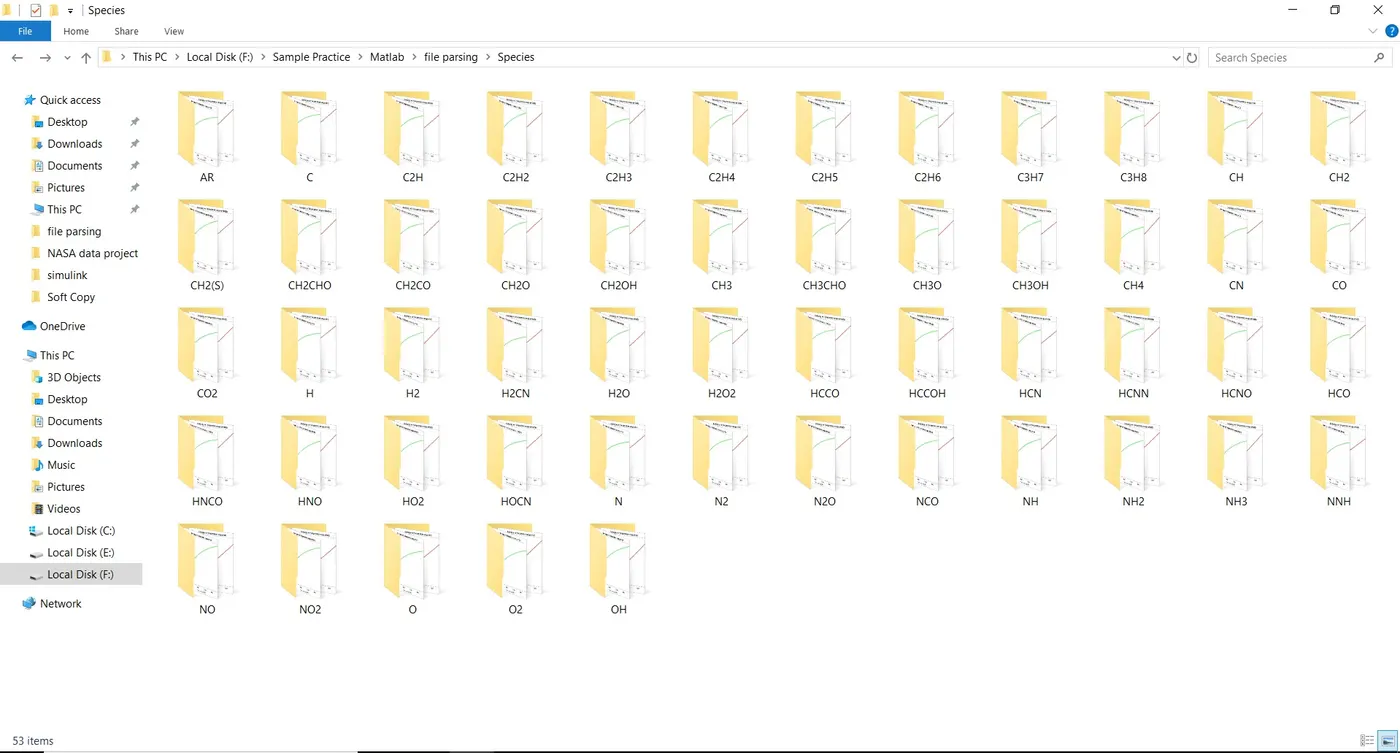
Screenshot of species saved:
Plots are created and saved under the respective folder of species, which is shown below. The folders and plots of all species are uploaded to google drive and the access link to the folder is https://drive.google.com/drive/folders/1UTxB4pdHsUJ9JBxpMJgDDPmtRwTwEmW4?usp=sharing
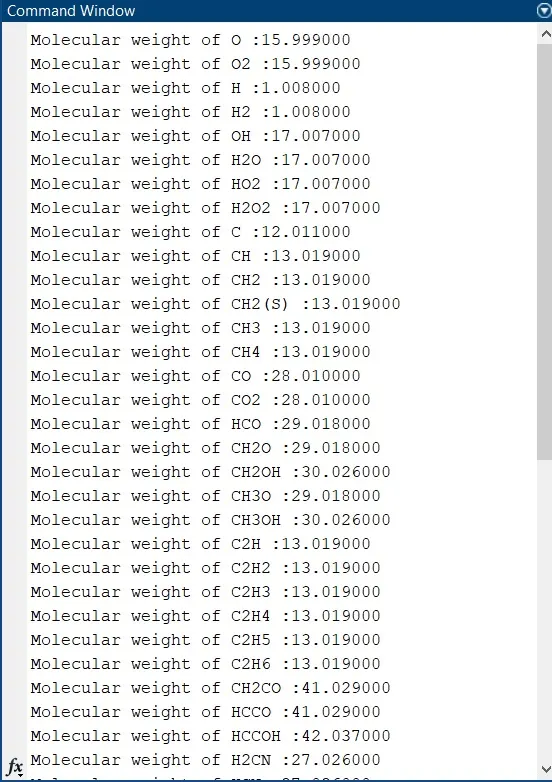
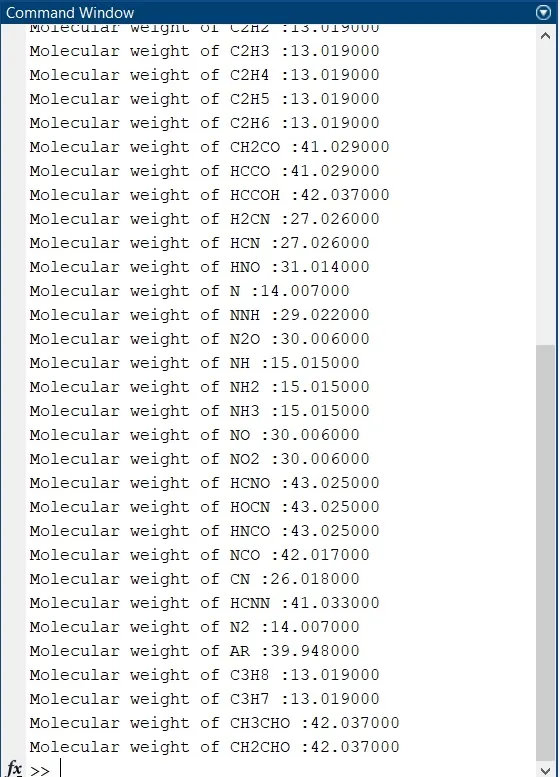
Molecular weight displayed in the command window:
The molecular weight of each species are calculated and displayed in the command window, which is shown below,
Errors:
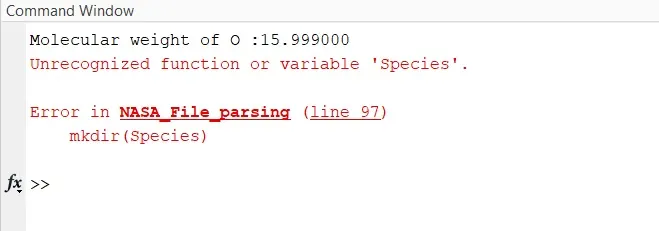
The above error occurred due to an unrecognized variable, it is minimized by replacing “Species” to “species”.

The above error occurred due to the use of square brackets while declaring string, it was minimized by, using curly braces instead of square brackets.
Conclusions:
Matlab code has been written to read the given data file, and coefficients and temperatures are extracted. Then specific heat, enthalpy, entropy values are calculated and plotted for the local temperature range.
Molecular mass of the species are calculated and the values are displayed on the command window. Obtained plots are saved in a separate folder for each species and a report is prepared with necessary screenshots.