Week-4 Challenge WOT Condition Part-2
The aim of this challenge is used to study the powertrain block sets. A powertrain block set is especially used to study and simulate the hybrid electric vehicle and electric vehicle in Matlab.
A mapped model is also called a static model which runs on basis of data that are given to the lookup table.
The dynamic model represents the actual components that run based on actual data which is given by the user and can be altered. It's a real-time model and time-consuming too.
static model models work faster than the dynamic model.
Converting mapped to a model
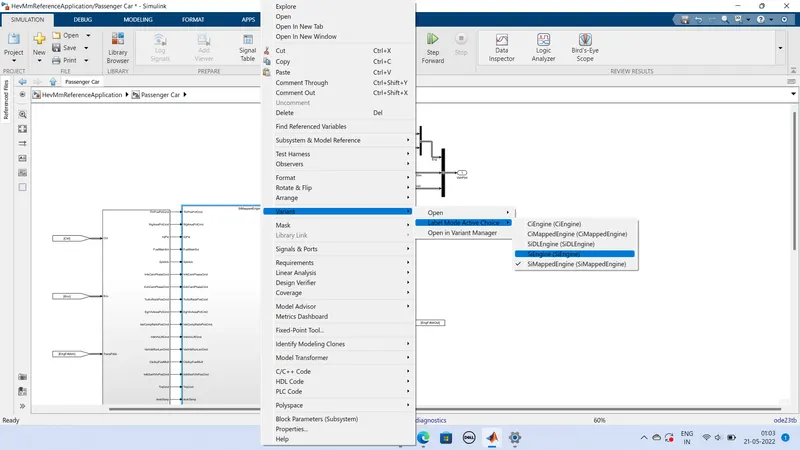
Step 1. Right-click on the SI mapped engine, then you will find out the variant.
Step 2. left click on variant then label mode active choice then SI Engine.
Now the mapped SI engine is converted to a Dynamic SI engine.
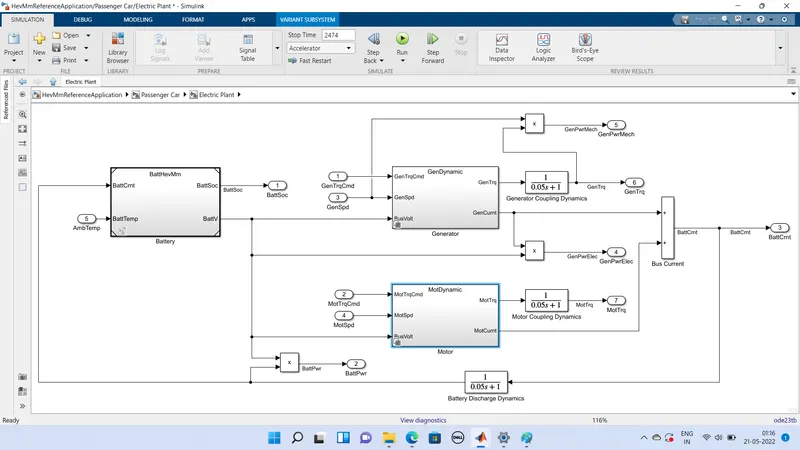
Similarly generator and motor changed from mapped to the dynamic model.
2. Miles per gallon(MPG) is used to measure the fuel economy of the gasoline or diesel vehicle. For an electric vehicle, there is no burning of fuel so it doesn't have fuel economy as miles per gallon but there are miles per gallon equivalent(MPGe) used in an electric vehicle.
Miles is a unit of distance that is used in countries like Uk, and the USA.
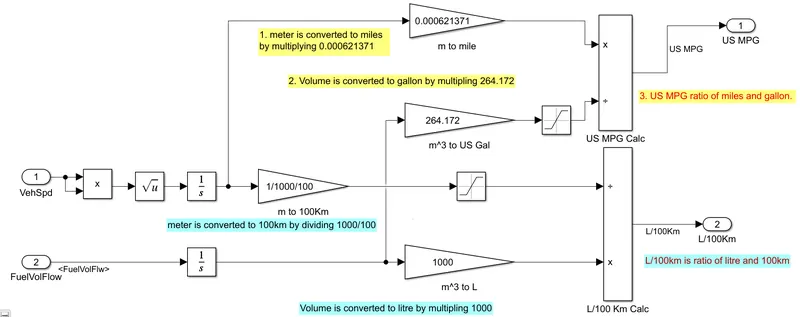
By integrating vehicle speed we get the distance traveled by the vehicle in meters(m). The meter(m) is converted to miles by multiplying 0.000621 with the meter.
In the conventional model, fuel is a physical quantity. The flow of fuel is converted to volume by integrating with time. volume (cubic meter) is converted to US Gallon by multiplying 264.172 or UK Gallon Volume is multiplied by 219.97
To find out US MPG miles are divided by Gallons (miles/Gallons)
Note: 1 meter =0.000621 miles
Conventional vehicle MPG Calculation:
The below image shows how is the Conventional SI Engine calculate MPG
HEV
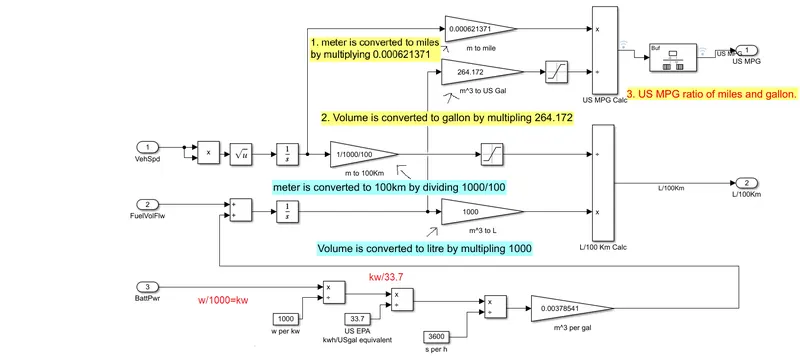
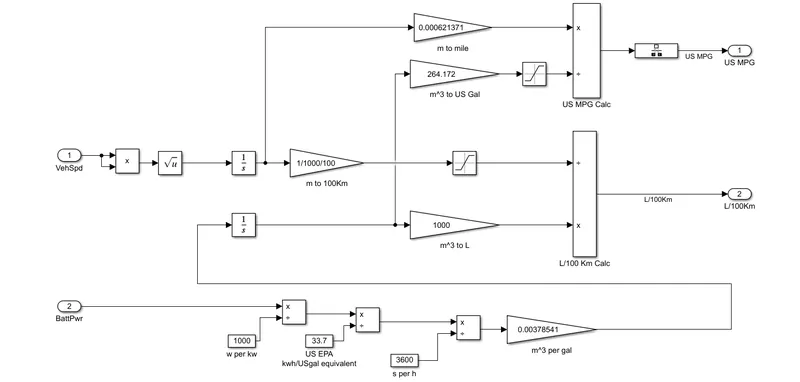
For hybrid Electric vehicles, mile conversion is the same as the Conventional vehicle but difference in gallon calculation. because hybrid vehicle runs by combined of battery and gasoline power. so fuel volume flow calculation is a bit different from conventional.
battery power calculation
battery power watt is divided by 1000 to get kW battery power. kW power is divided by 33.7.
33.7 is the US Gallon equivalent. kw sec/ US gal equivalent is converted to kWh/US gallon by dividing 3600.

m3 per gal is added to the flow rate of fuel and then converted as m^3 then the US gallon.
The flow rate of fuel and battery power in volume/ gallon is added and converted to volume by integrating concerning time.
The below image shows how is the Hybrid electric vehicle calculate MPG
BEV
For Battery Electric Vehicle Miles calculation is the same as the conventional vehicle.
gallon calculation is done by battery power. The battery is the source of fuel in Bev
Battery power w is converted to kw and then kwh/US gal equ and followed by m^3/ gal, US gal.
Factor considered while modeling fuel flow is Fuel economy. Fuel economy means the number of miles traveled by the vehicle per unit of a gallon of fuel. fuel might be gasoline or diesel. For an electric vehicle, there is an equivalent called miles per gallon equivalent(MPGe)
3. HEV ReferenceApplication with WOT drive cycle.
Case study 1. Hev with Wot drive cycle and No changes in the grade and wind velocity.
time is 120
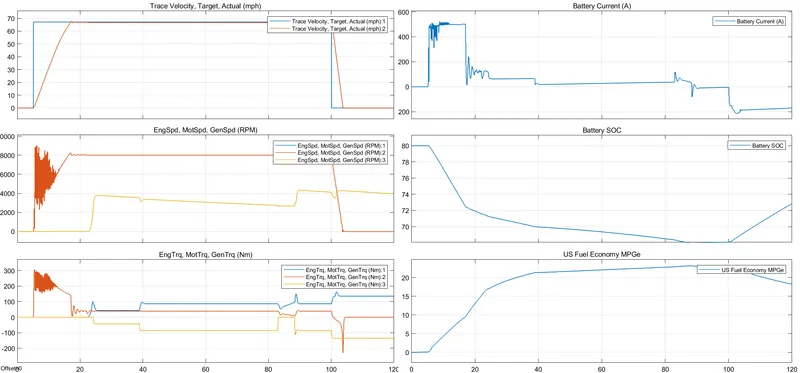
The above image shows the result of the hev wot drive cycle without grade and wind velocity.
Plot 1 shows the graph on Velocity(y) vs time(x)
The maximum velocity reached in WOT condition is 67.1mph=29.996 m/s
Acceleration is `2.307m/s^2`
The initial time to start rising the velocity is 5 sec
The total time taken to reach maximum velocity is 18 sec
The difference between the Total time taken to reach max velocity from the initial time of rising velocity is WOT time is 18-5=13secs (accelerating time).
Decelerating time is 3.64 sec
Deceleration is `8.24 m/s^2`
Plot 2 shows the graph between Engine speed, Motor speed, and generator speed in RPM with respect to time.
Maximum engine Speed 4301 RPM
Maximum motor speed 9000 RPM
The maximum Generator speed is 4301 RPM
Plot 3 shows the graph between Engine torque, Motor torque, and generator torque with respect to time.
Engine torque 163Nm, Motor torque 307Nm, and generator torque -135Nm
Plot 4 Shows the graph between Battery current (A) vs time.
The maximum current drawn from the battery is 524 A (Discharging)
The maximum current taken to the battery is -212A (Charging)
Plot 5 Shows the graph between Battery SOC(State of charge in %) vs time
From 5 to 18 sec of full-throttle condition battery soc is Decreased(discharge) from 80 to 72.36. 80 to 68.14 is full discharge before applying the brake. while the vehicle is decelerating battery starts to charge from 68.14 to 72.86
Plot 6 Shows the graph between Us fuel economy vs time.
The maximum distance traveled by the vehicle is 23.15 miles.
Case study 2. With grade and wind velocity of Wot in Hev
The grade angle is 10 degrees and the wind velocity is 15m/s.
Output Plot
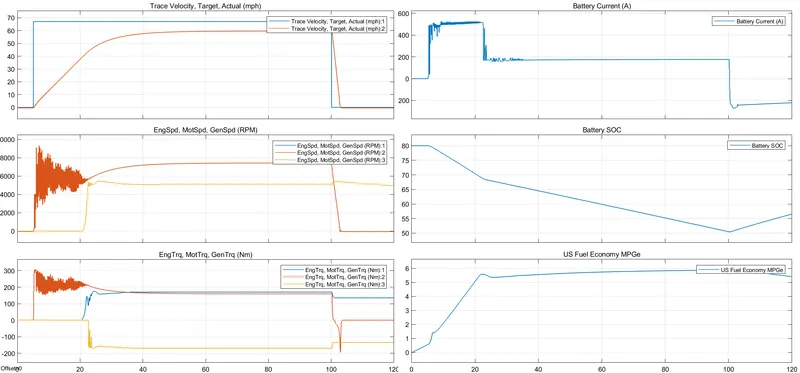
The above image shows the result of the HEV WOT drive cycle with grade and wind velocity.
Plot 1 shows the graph on Velocity(y) vs time(x)
The maximum velocity reached in WOT condition is 58.1mph=25.971 m/s
Acceleration is `0.616m/s^2`
The initial time to start rising the velocity is 5 sec
The total time taken to reach maximum velocity is 42.124 sec
The difference between the Total time taken to reach max velocity from the initial time of rising velocity is WOT time is 42-5=38secs (accelerating time).
Decelerating time is 2.814 sec
Deceleration is `9.324 m/s^2`
Plot 2 shows the graph between Engine speed, Motor speed, and generator speed in RPM with respect to time.
Maximum engine Speed 5418 RPM
Maximum motor speed 9309 RPM
The maximum Generator speed is 5418 RPM
Plot 3 shows the graph between Engine torque, Motor torque, and generator torque (Nm) with respect to time.
Engine torque 175(Nm), Motor torque 305(Nm), and generator torque -169(Nm)
Plot 4 Shows the graph between Battery current (A) vs time.
The maximum current drawn from the battery is 542 A (Discharging)
The maximum current taken to the battery is -270A (Charging)
Plot 5 Shows the graph between Battery SOC(State of charge in %) vs time
From 5 to 42 sec of full-throttle condition battery soc is Decreased(discharge) from 80 to 68.26. before applying brake battery soc is discharged up to 50.44 from 80. while the vehicle is decelerating battery starts to charge from 50.44 to 56.58
Plot 6 Shows the graph between Us fuel economy vs time.
The maximum distance that can be traveled by the vehicle is 5.58 miles.
Conclusion:
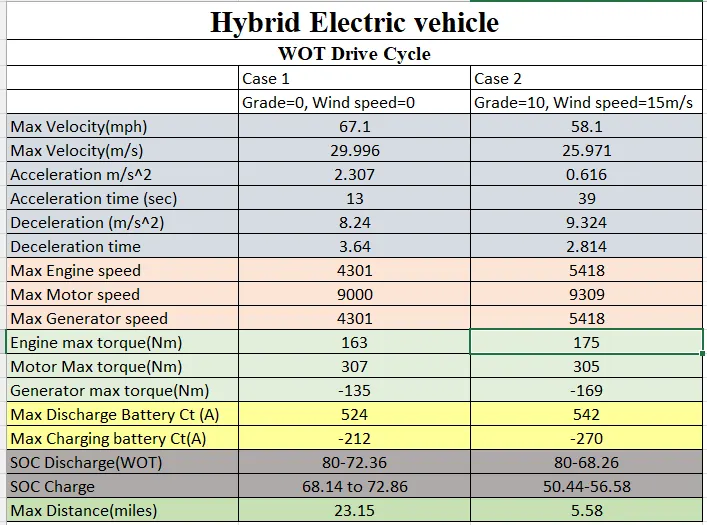
In this study, we came to know that the energy consumption is less on Flat surface roads and ideal wind velocity compare with inclined surfaces and wind velocity of 15m/s. In a grade and wind velocity condition, maximum velocity reaches slower than without grade. Maximum distance travel by the vehicle is reduced in the 2nd case.
4. Comparing Ev and HEV Powertrain.
HEV Powertrain stimulation explanation is already given in 3 answers.
EV Powertrain
Case 1: Without grade and wind velocity.
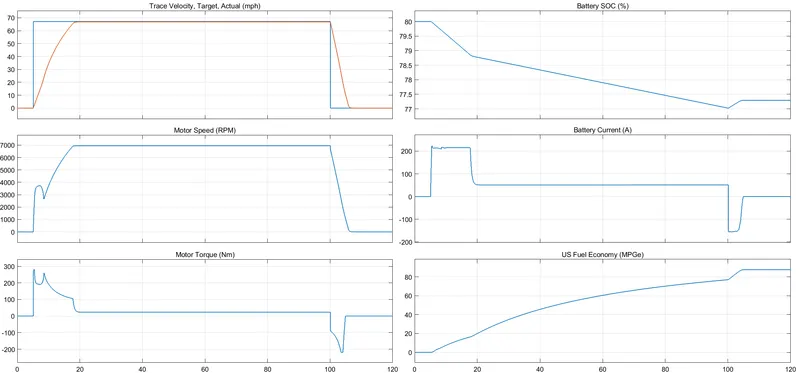
The above image shows the result of the EV wot drive cycle without grade and wind velocity.
Plot 1 shows the graph on Velocity(y) vs time(x)
The maximum velocity reached in WOT condition is 67.1mph=29.996 m/s
Acceleration is `=29.996/13=2.307m/s^2`
The initial time to start rising the velocity is 5 sec (vehicle start)
The total time taken to reach maximum velocity is 18 sec
The difference between the Total time taken to reach max velocity from the initial time of rising velocity is WOT time is 18-5=13secs (accelerating time).
Decelerating time is 3.98 sec
Deceleration is `7.54 m/s^2`
Plot 2 shows the graph between Motor speed in RPM with respect to time.
Maximum motor speed 6941 RPM
Plot 3 shows the graph between Motor torque with respect to time.
Motor torque 279.836Nm.
Plot 4 Shows the graph between Battery SOC(State of charge in %) vs time
Battery soc is Decreased(discharge) from 79.98 to 78.81. while the vehicle is decelerating battery starts to charge from 77.03 to 77.29
Plot 5 Shows the graph between Battery current (A) vs time.
The maximum current drawn from the battery is 223 A (Discharging)
The maximum current taken to the battery is -155A (Charging) Regenerative braking
Plot 6 Shows the graph between Us fuel economy vs time.
The maximum distance traveled by the vehicle is 87.77 miles.
Case 2: With grade and wind velocity.
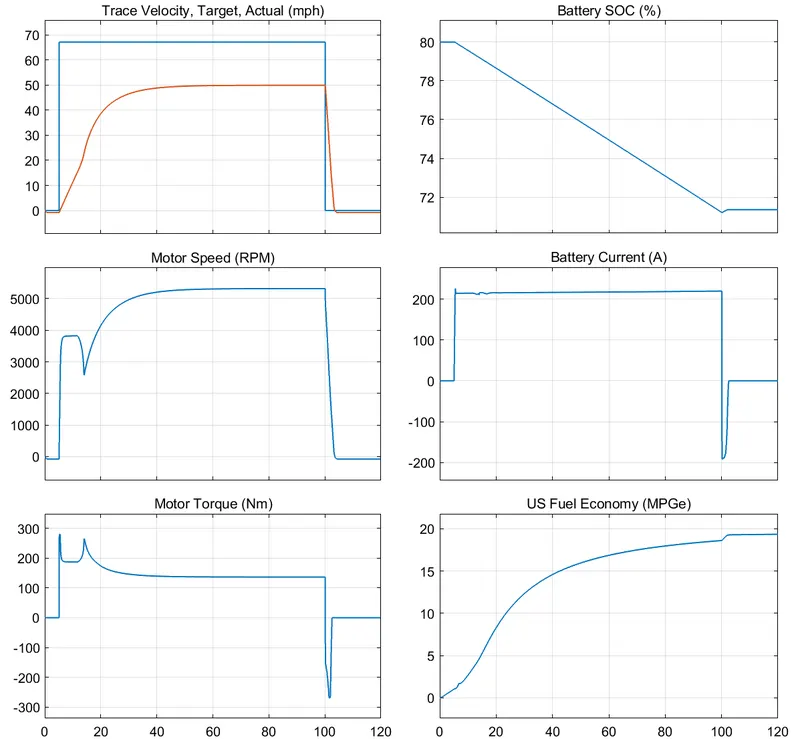
The above image shows the result of the Ev WOT drive cycle with grade=10degree and wind velocity=15m/s.
Plot 1 shows the graph on Velocity(y) vs time(x)
The maximum velocity reached in WOT condition is 49.39mph=22.07 m/s
Acceleration is `0.526m/s^2`
The initial time to start rising the velocity is 5 sec
The total time taken to reach maximum velocity is 46.905 sec
The difference between the Total time taken to reach max velocity from the initial time of rising velocity is WOT time is 46.9-5=41.9secs (accelerating time).
Decelerating time is 3.72sec
Deceleration is `49.39/3.72 m/s^2=13.27m/s^2`
Plot 2 shows the graph between Motor speed in RPM with respect to time.
Maximum motor speed 5317 RPM
Plot 3 shows the graph between Motor torque(Nm) with respect to time.
Motor torque 280(Nm)
Plot 4 Shows the graph between Battery SOC(State of charge in %) vs time
battery soc is Decreased(discharge) from 80 to 71.21. while the vehicle is decelerating battery starts to charge from 71.21 to 71.35
Plot 5 Shows the graph between Battery current (A) vs time.
The maximum current drawn from the battery is 225 A (Discharging)
The maximum current taken to the battery is -191A (Charging)
Plot 6 Shows the graph between Us fuel economy vs time.
The maximum distance that can be traveled by the vehicle is 19.28 miles.
Conclusion:
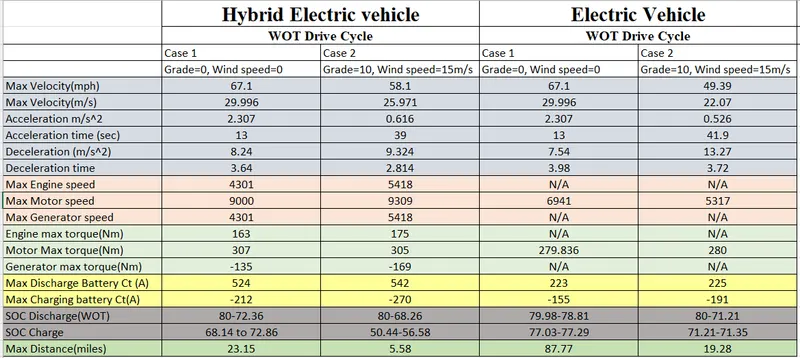
In an electric powertrain with high fuel economy compare to HEV Powertrain.