Week-4 Challenge WOT Condition Part-2
Q1:-What is the difference between mapped and dynamic model of engine, motor and generator? How can you change model type?
Ans:-powertrain blockset provides two types of combustion engine models:mapped and dynamic.
Mapped engine:-
1.Mapped engines represent macro engine behaviour as a set of lookup tables(brake torque,fuel flow,air masflow,exhaust temperature,efficiency and emissions) as functions of commanded load and measured engine speed.
2.Mapped engine models are suitable for analysis and design activities that do not require enigne subsystem dynamic characteristics,for example in egine and transmission powertrain matching analysis for fuel economy,emissions and performance trade-offs.
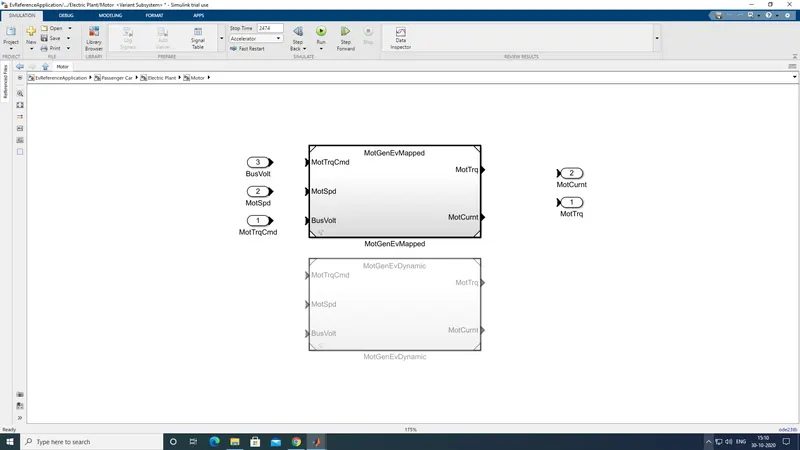
Dynemic engine:-
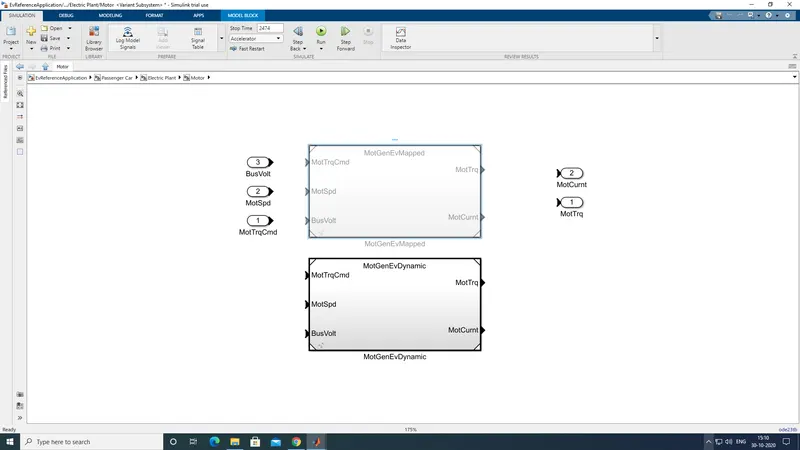
1.Dynamic engine decompose engine behaviour into individual component models that account for engine dynamics,most notably intake airflow and turbo charger dynamics.
2.Dynamics engine models are suitable for desiging control,estimator and diagnostic,algorthims that depend on dynamic subsysytem states,for example in closed loop AFR(air fuel ratio)control algorithm development.
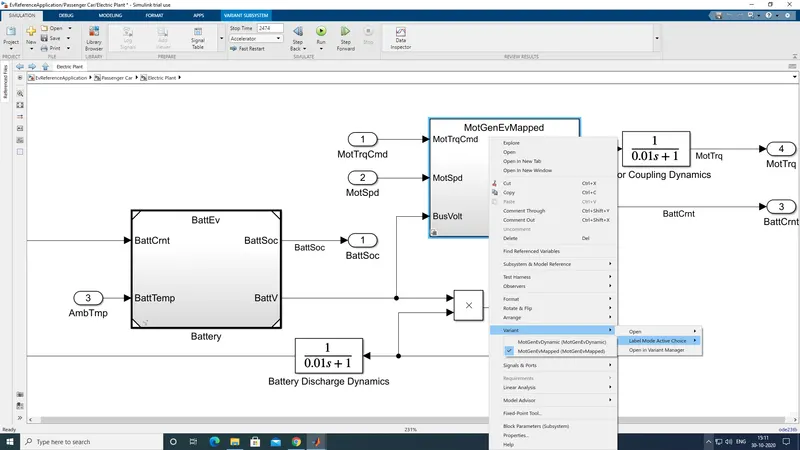
We can switch between mapped and dynamic engines by following below procedures:
1.oepn the ev model in simulink.
2.enter the passenger car block by double clicking it.
3.then go to electric plant block.
4.inside the motor block right click to find the variant option.
Q2:-How does the model calculate miles per gallon? Which factors are considered to model fuel flow?
Ans:Miles per gallon (mpg) & miles per gallon equivalent (mpge):
for a conventional gasoline vehicle,the fuel efficiency is calculated via miles per gallon (mpg).however fuel efficiency for hybrid electric vehicles is calculated via miles per gallon equivalent(pge).mpg is the number of miles your car can drive per gallon of gas.figuring out an mpge rating is a littile more complicated.since engines that can use an alternative source of fuel cant be measured by liquid gallons of fuel,the mpge rating is calculated by figuring out the number of milles a vehicle can go using the same energy content as gallon of gas.the epa calculated that 33.7 kilowatt hours of electriccity is equivalent to one gallon of gas.
We should go inside ev reference block that is performance calculations:
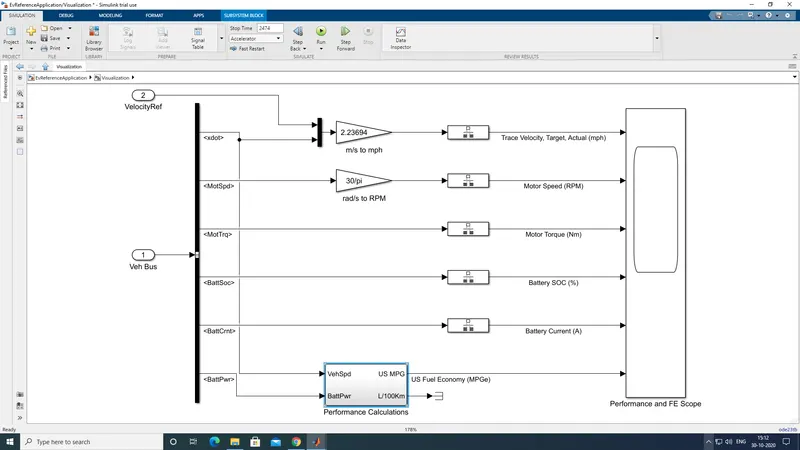
inside this block will get actual mpg calculations:
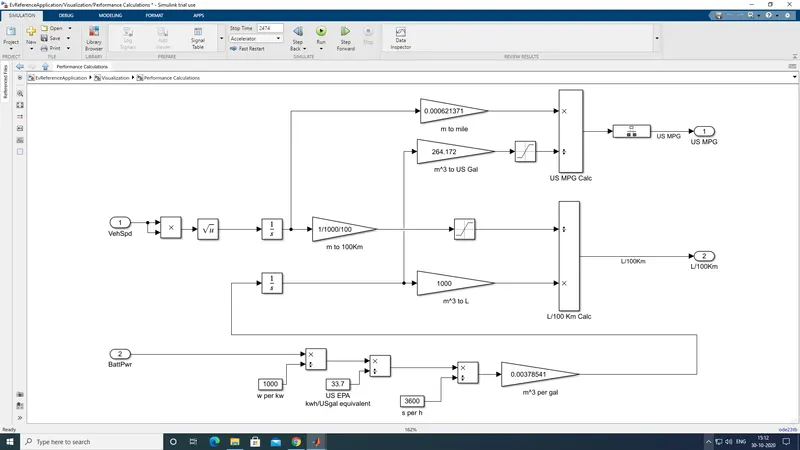
Here,three different inputs are taken into considerations:
1.vehicle speed.
2.fuel flow.
3.battery power.
The vehicle speed inputs is in m/s which is converted into miles by multiplying with 0.000621371.
similarly the kilogram of fuel is converted into cubic meter by multiplying by1/(1000*0.739)
this cubic meter value is then converted into gallons by multiplying it with 264.172.the mile value and gallon value is used to find mpg of the vehicle.
now the battery value is initially converted from watts to kwh by dividing with 1000 and then to gallon equivalent by again dividing it with 33.7(sincw 33.7 kwh=1 gallon)
then divide the value by 3600 to get in per seconds and multiply by 0.00378541nto get the value in cubic meter per gallons.
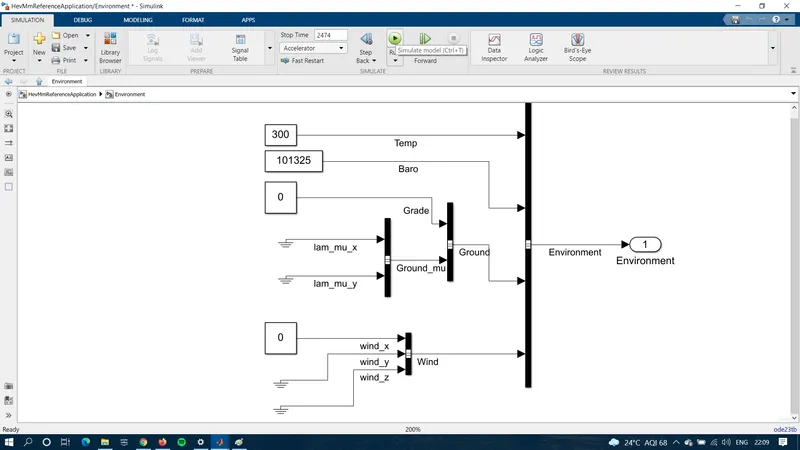
Q3:Run the HEV ReferenceApplication with WOT drive cycle. Change the grade and wind velocity in the environment block. Comment on the results.
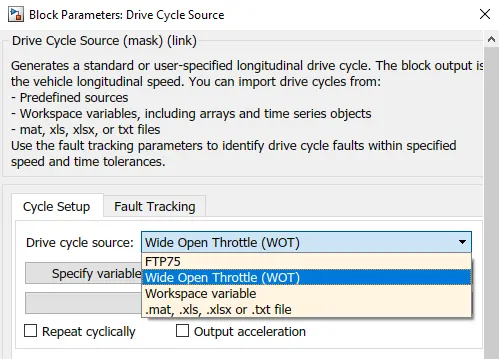
For this problem, Hybrid Electric Vehicle Multimode reference application is taken with WOT Drive Cylce as shown in the figure.
Now the simulation is run with first case
i) Grade = 0; ii) Wind Velocity = 0
The results are as follows
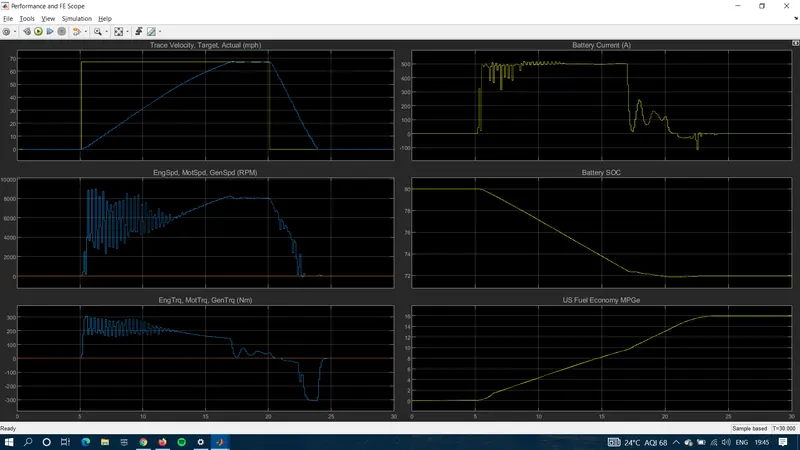
From the above figure we can see that, since no grade or wind velocity is present, vehicle is able to achieve its maximum speed with battery power itself. We can see that, the yellow line in Trace velocity curve represents wide open throttle but the velocity curve does not correspond to the curve and instead takes time to reach maximum speed. This is due to maximum motor power. Had the motor power been more, with more Ampere, maximum velocity would have been reached earlier.
Now for the second case
i) Grade = 10 ; ii) Wind Velocity = 10
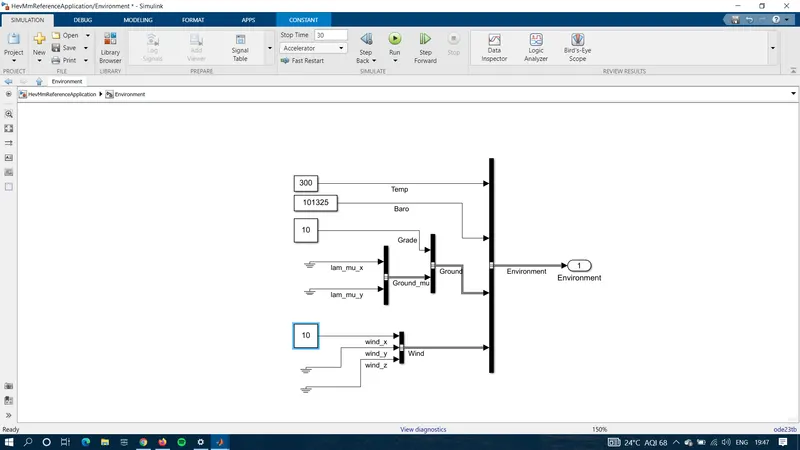
The results are as follows,
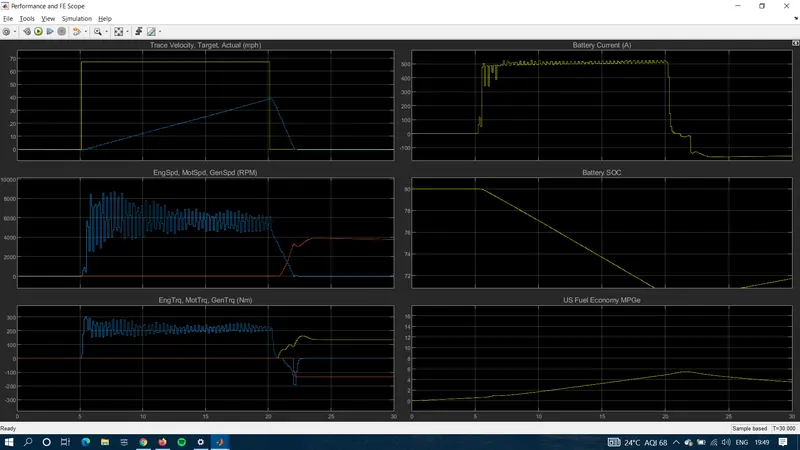
From the above figure we conclude that desired velocity is not achieved and power of the battery is not sufficient enough to run the vehicle. This is the time when engine plays its role during which the battery is charged. Also during braking, current goes to negative which indicates regenerative braking. All this charge the battery which can now run extra miles which would have been difficult in the absence of engine. As the velocity is increasing, i.e. acceleration, Battery current increases and decreases during decceleration and even goes to negative implying that the battery is recharging.
To understand what happens, here I take two points 1 and 2 as shown below,
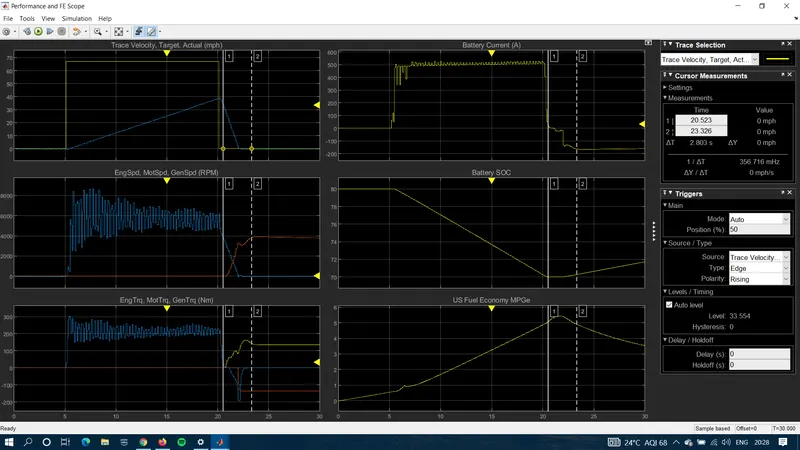
As velocity decreases from 1 to 2 current decreases and goes below zero that shows regenerative braking i.e. charging the battery. Also as engines runs during this period, battery SOC is increasing, i.e. battering is charging and battery current is also negative implying the same.
Q4:Keeping all other parameters same, compare the simulated results of hybrid and pure electric powertrains.
For this problem, Electric Vehicle reference application is taken with WOT Drive Cylce as shown in the figure.
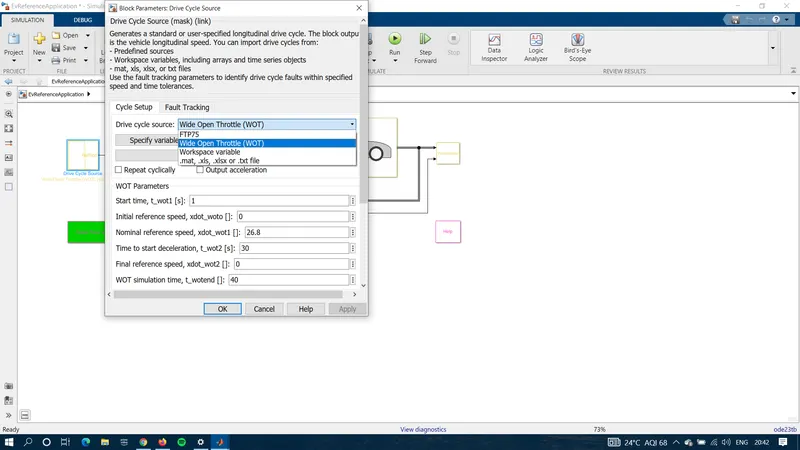
Now, after running the simulation the result comes out to be as shown below.
Case 1:
Grade = 0 and Wind Velocity = 0
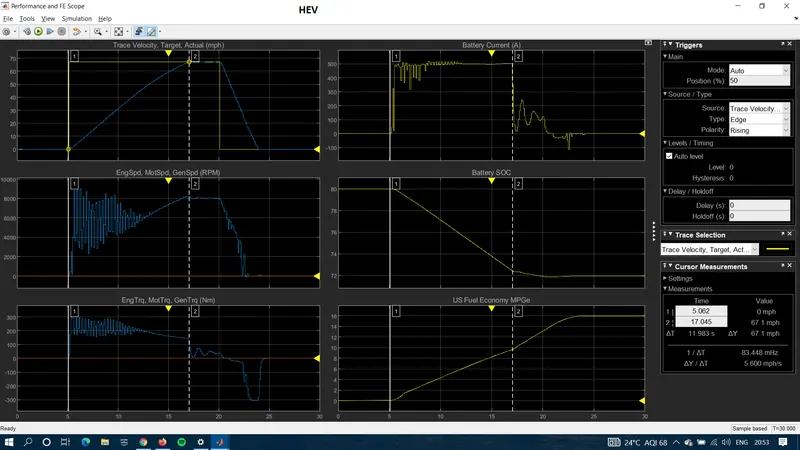
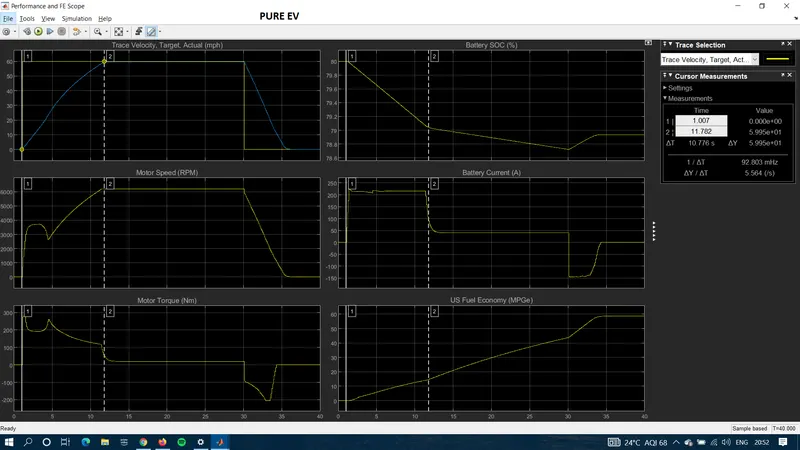
From both the figure, we can see that both take approximately same speed to accelerate to maximum speed.
It can be noted from the above that in case of HEV, the Battery current has a curve that runs between 500A and -100A where as in case of EV the battery current curve runs between 250A and -150A. This is because initially motor takes the load and later engine supports due to which maximum speed in case of HEV achieved is more than that in the case of pure EV.
Grade = 10 and Wind Velocity = 10
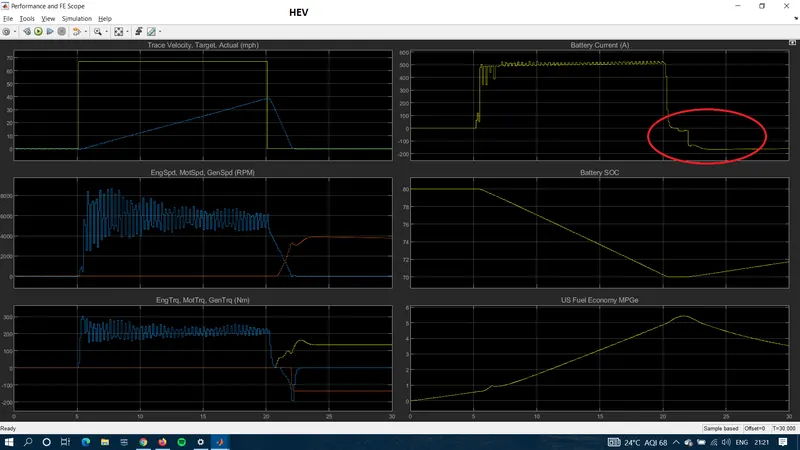
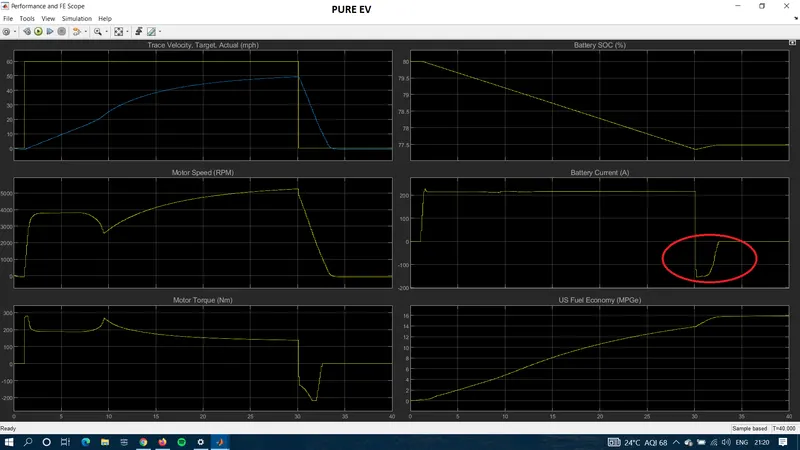
From the figure we can see that the current is negative for more amount of time in case of HEV which shows better regenerative braking and battery charging than in the case of Pure Electric Vehicle which concludes that the regenerative braking is better in case of HEV.
Conclusion: Differences between Mapped and Dynamic models have been explained and difference between Pure EV and HEV have been explained and supported with graphs.