Week-4 Challenge WOT Condition Part-2
Mapped based model:
In mapped based model, the characteristics like Torque, speed, fuel consumption,input power etc of engine, motor, generator is taken from the actual value and implemented by the help of lookup tables. Based on the input to the look up table , the value for torque, power etc is determined.
Dynamic Model
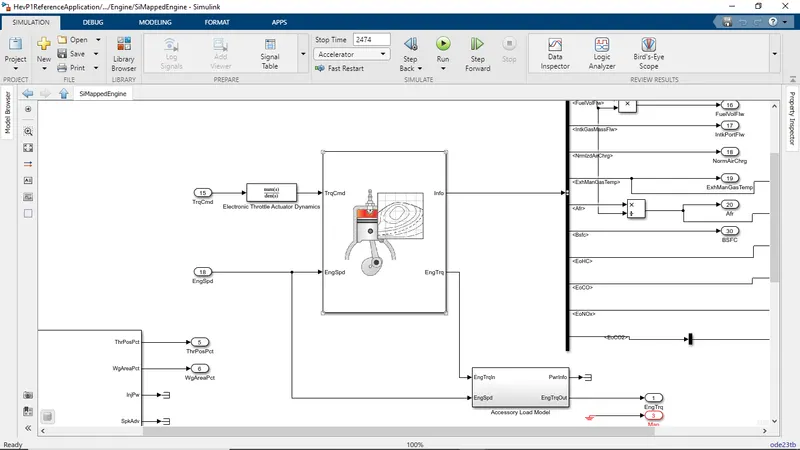
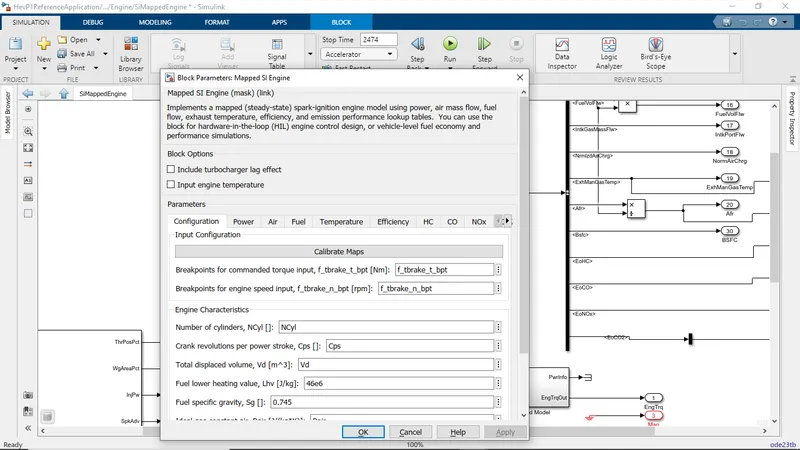
In dynamic modelling of engine, motor or generator, there real 'time performance is simulated based on the given input conditions. To have a preecise understanding, lets take an example of HEV reference model from matlab. In this model we have both mapped based model and dynamic model for engine , motor and generator. Figure 1a shows the outer model for the mapped based model and 1b shows the configuration parameter for mapped based model.
a b
Figure 1: a)Outer model for mapped based model b)Configuration parameter for mapped based model.
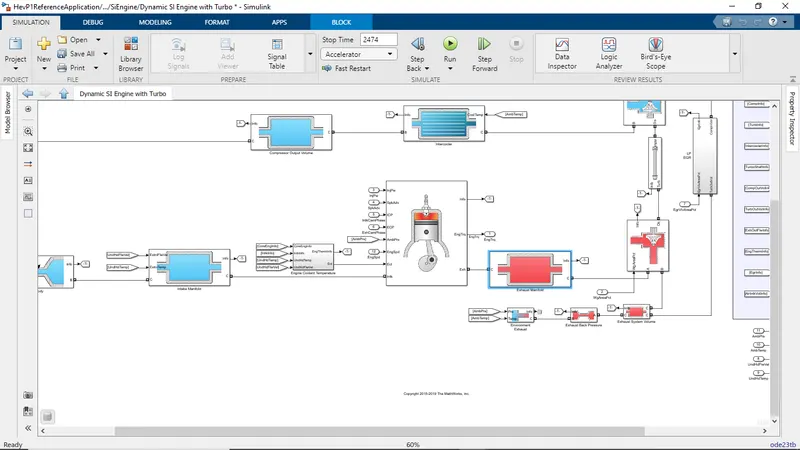
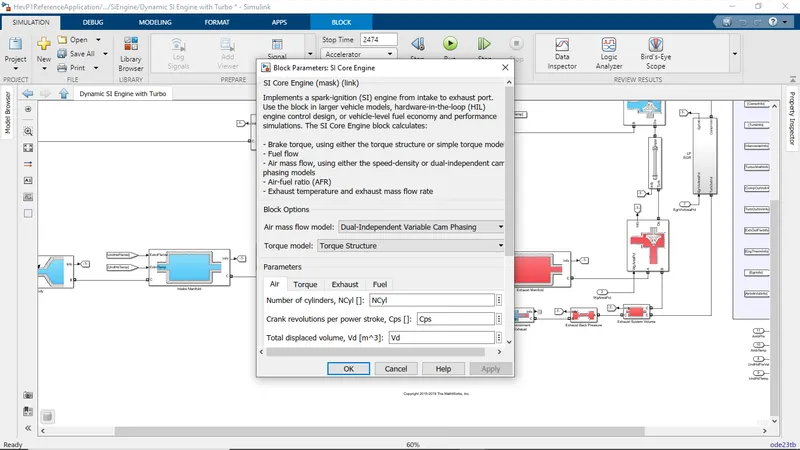
In the figure 1b , we can observe that the data given to the block are based on some experimental value and based on the torque command and engine speed , parameters like fuel consumption, exhaust gas temperature etc was determined.Now, lets look at the dynamic model used for the reference example. Figure 2 a shows the outer model for dynamic model and 2b shows the configuration parameter for dynamic modelling.
a b
Figure 2:a)outer model for dynamic modelling of SI engine b) Configuration parameters for the dynamic modelling of an engine.
In figure 2b we can observe that based on the instantaneous value of engine coolant temperature, engine speed, exhaust cam phase etc , the model is giving us the information about engine torque , exhaust temperature etc.
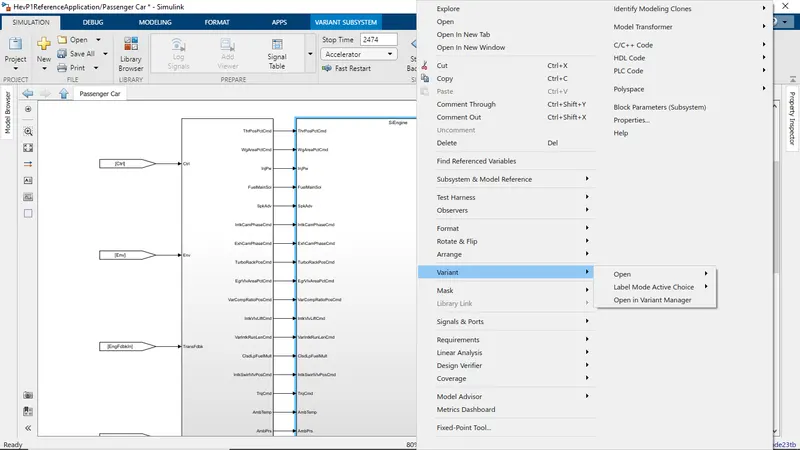
To change the model from mapped based model to dynamic modelling for the above reference example the process in figure 3 can be followed. Figure 4 shows the top level model for the HEV reference model. Based on the requirement the model can be selected.
 `->`
`->`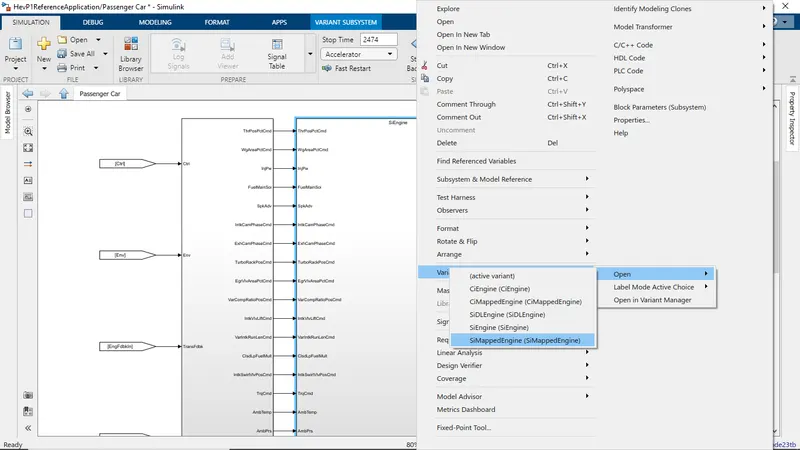
Figure 3: Process to change the model.
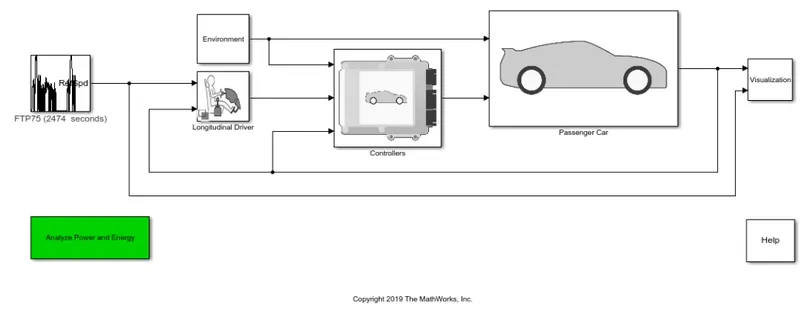
Figure 4: Top level model for HEV reference model
2.Miles Per gallon Calculation
For calculating the miles per gallon for the model, based on the velocity of the vehicle, its distance is measured. The measured distance is converted to miles by considering the gain factor of 0.000621371. To calculate the amount of fuel consumed, both the power consumed by the engine and the motor are consider. From engine, the rate of fuel consumption is consider. On the battery side, inital consumed from the battery is converted to Kw. Than, amount of kw produced by equivalent US galon of fuel is consider and we get hr*US galon as an output. Now hr term is removed by dividing it with the 1/3600 and its volume is calculated. Both the fuel consumed volume and equivalent fuel of battery power consumed is added to obtain to volume of fuel consumed. By dividing total miles with total volume of fuel we will end up with miles per galon. Figure 5 shows the block arrangement for calculation of miles per galon.
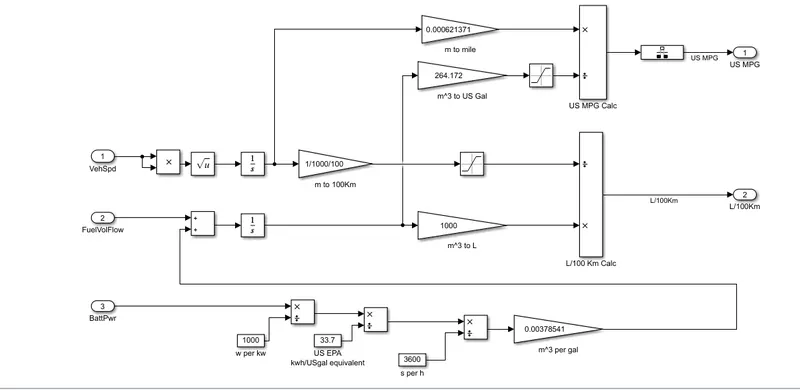
Figure 5: Block arrangement for Miles per galon calculation.
Factor considered to model fuel flow:
- Battery power
- Fuel flow rate from an engine(fuelvolflw)
3. HEV Model
Figure 4 shows the HEV reference model and contains drive cycle block, longitudinal driver, environment, controller , passenger car and visualization block. In drive cycle block, the required drive cycle or WOT condition is selected. The longitudinal driver is a PI controller block and based on the output of the vehicle accleration and braking command is given to the controller. In environment block all the information like grade, wind velocity etc are there and fed it to the controller and passenger car. From the controller section based on the data from the environment and longitudinal driver , required brake and accleration command is provided to the passenger car. In the passenger car block , all the individual component like engine, motor, transmission, wheels etc are model and based on this the parameter like fuel flow, battery power, vehicle speed and other infromation are taken by using either mapped based model or dynamic model.
The model is run for two wide open throttle condition which configuration is shown in figure 6. The first case is without considering the air velocity and grade while the second conditions is by considering the air velocity as 5 ms-1 and grade as 10 degree.
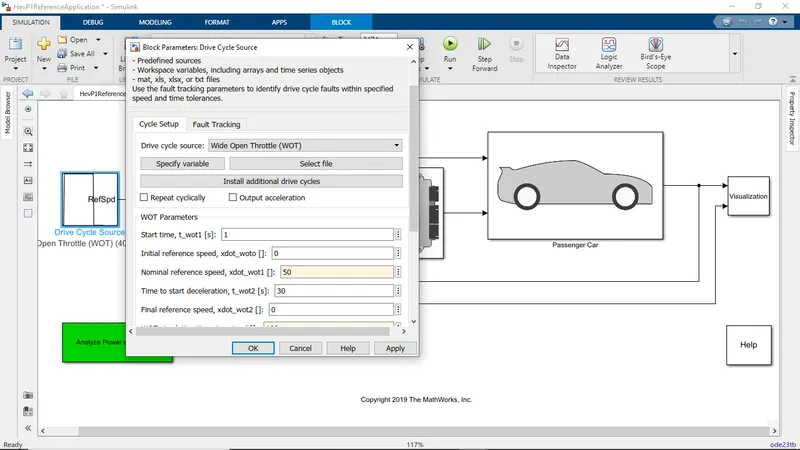
Figure 6: Block configuration for WOT condition.
Output:
a) When grade and air velocity are not considered.
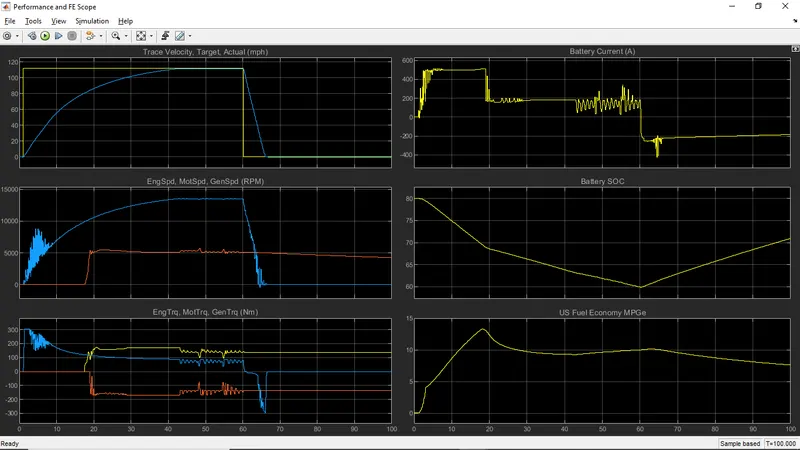
Figure 7: Output plot when garde and air resistance are not considered
In figure 7 we can observe that on applying the Wide open throttle, the vehicle reaches its maximum speed of 120 mph in about 40 seconds and it took around 8 seconds for deacclerating from maximum speed to zero. At soc plot we can observe the reduction in the SOC while the acclerating of vehicle to the maximum speed once the vehicle reaches its maximum speed , SOC seems constant. When vehicle starts to deacclerates, some amount of SOC is gained and at the end of simulation the SOC reaches around 71%.The miles per gallon was increasing when the vehicle is acclerating, but once the vehicle has gain its constant speed than its start to reduces to some extend while deacclerating,it further decrease and at the end of simulation time mpg is around 8.
b) When grade and air velocity is considered.
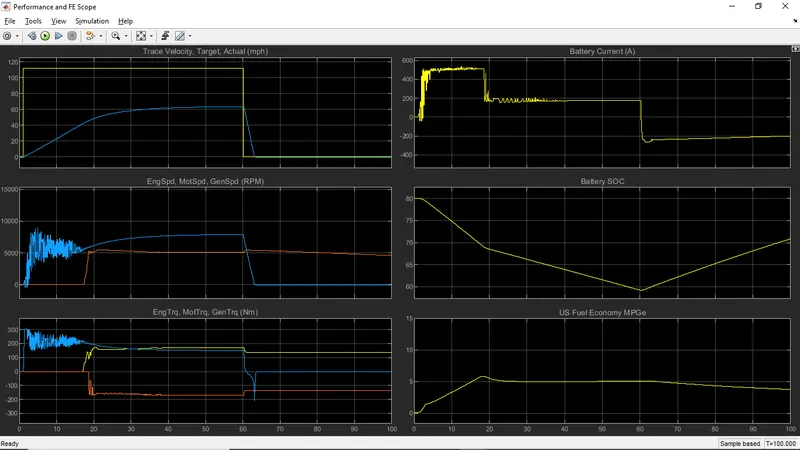
Figure 8: Output plot when grade and air velocity was considered.
From the above plot we can observe that when grade and air velocity was considered the maximum speed of the vehicle wad reduced to 60 mph from 120 mph which is due to the increase in the resistance force which is offer by the grade and air. Due to this vehicle have to produce more power. On the other side, we can also observe that, the miles per gallon for the vehicle is significantly reduced and was around 4 miles per gallon.
4. Comparision between Hybrid electric vehicle and pure electric vehicle powertrain.
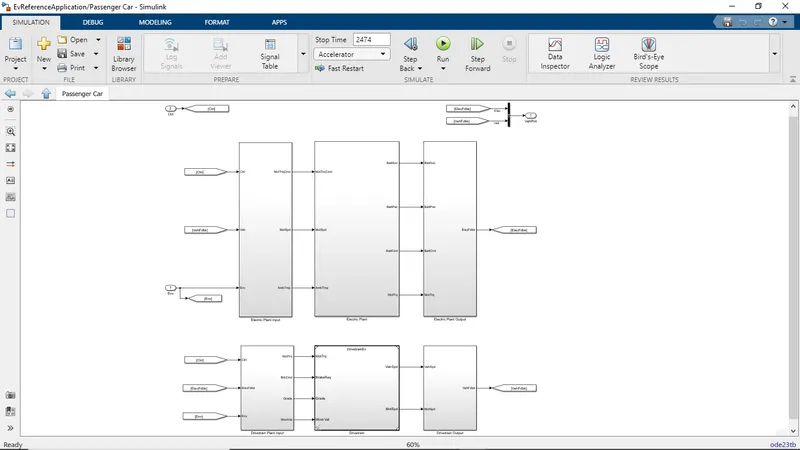
In this comparision we will observe the accleration performance and mile per gallon for pure hybrid and pure electric vehicle.In the both cases the grade and wind velocity is considered as zero. Figure 9 shows the difference in the model inside the passenger car subsystem for pure EV and hybrid vehicle. We can observe there are two power train inside the HEV model while pure EV model has only one model i,e of electric powertrain.
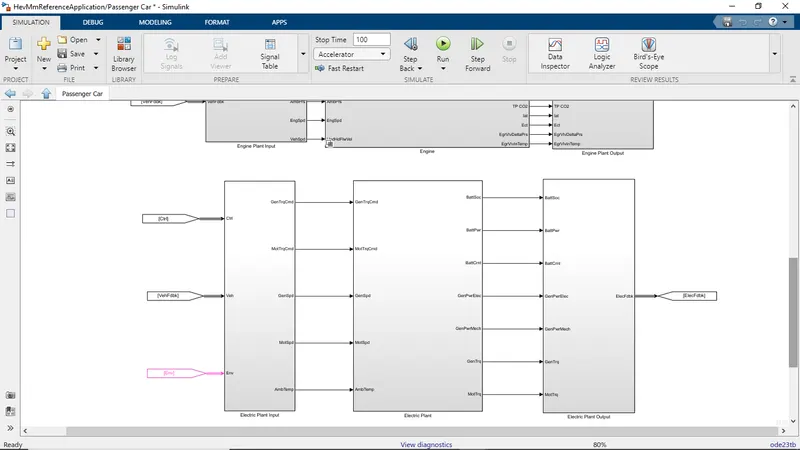
Hybrid Model Electric Vehicle
Figure 9: Difference between the hybrid model and electric vehicle model inside the passenger car subsystem.
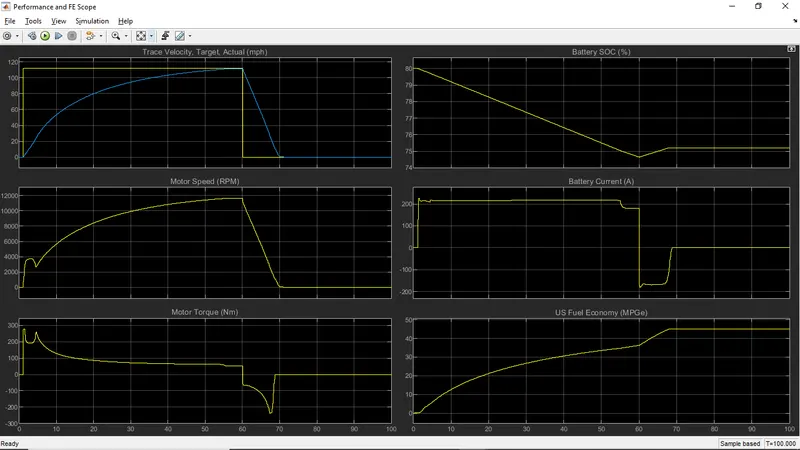
Figure 10 shows the performance of hybrid electric vehicle for WOT condition while 10 b shows the performance for pure electric vehicle.
a b
From above plot we can observe that the hybrid vehicle is able to reach at its maximum speed abit faster when compared with the pure ev vehicle. This may be due to the combine power of motor and engine for hybrid vehicle. The hybrid vehicle also deacclerates comparatively faster when compared with the pure EV. The Pure EV has outclass the hybrid vehicle interms of the mileage or miles per gallon. we can observe that, hybrid vehicle has highest miles per gallon of around 15 mpg while the pure EV has mile per gallon of around 45 mpg. This is due to the higher efficiency of the motor drive system.