Curve fitting of given data set and determination of its goodness parameters
Objectives:
- Linear and cubic curve fit of given data set.
- Finding the parameters to determine the goodness of curve fit.
- To fit the curve by using splitwise method.
Theory:
The process of constructing the curve or mathematical function based on the given data set is called as curve fitting. Curve fit examines the the relationship between one or more independent variable and dependent variable to provide the best fit for the model[1,2]. In engineering, curve fitting can be used for trend analysis, hypothesis testing. In trend analysis , curve fitting can be used to predict the values of independent variable where as in hypothesis testing , curve fitting are used for comparing the mathematical model with measured value[3].Accuracy of curve fit can be increase either by increasing the order of polynominal function or by splitting the data and fitting for individual set of data.There are four techniques to determine the whether the fitted curve is best or not they are:
- Sum of square due to error(SSE)
- R square
- Adjusted R square
- Root mean square error(RSME)
If the value of R square is greater than 0.95, than the curved fit is consider as good fit. For the best possible fit, the value of R square should be 1 and for worst fit its value should be 0[4].
Code logic:
Get the data from file. Assign different array for given set of data. Now based on the requirement to calculate the error assume the required variables.Now, in order to get a coefficient of fitted curve with function f(x), use matlab inbuilt function called polyfit. Now, use polyval command to get the value for predicted data set.
Synatax:
coefficient=polyfit(x,y,n)
value=polyval(coefficient,x)
where n is order of polynominal
plot the obtain data as per the requirement. In order to get parameters to determine the goodness of curve fit use loop as require.
Formula to determine goodness of curve fit[4]
Assume a set of data (x1,y1) (x2,y2).....(xn,yn) has beed fitted with the curve of function f(x).
Error=/y(i)-f(x(i))/
Sum of square due to error (SSE)=`sum_n=`Error(i)^2
SSR=`sum_n`(f(x(i))-mean)^2
SST=SSR+SSE
R-Square=`(SSR)/(SST)`
Adj R-Square=`1-(((1-R^2)*(n-1))/(n-k-1))`
where, n is number of data point
k is number of independent variable
Root mean square Error(RSME)=`sqrt((SSE)/n`
Steps:
- Load the set of data from given data file.
- Create an array to store the value from data file. Now create individual array to store the data for specific heat capacity and temperature.
- Assume different sets of variable as per the requirement to get the value of error.
- With help of polyfit command get the coefficient for linear and cubic fit and store those coefficient seprately.
- Now , with the help of polyval command get the value for linear and cubic fit.
- To calculate the error , according to requirement use loop command.
- plot the obtain data as per the requirement.
For Splitwise method:
- For split wise method above methods can be used, we have to split the data into number of sets and fit the curve according to the data.
Codes:
clear all
close all
clc


% Data loading
cp_data=load('data');
temp=cp_data(:,1);  %assigning data for temperature
cp=cp_data(:,2);   %assigning data for specific heat

%some conditions for error calculation
n=length(cp);   %To know total  value of data point

sse=0;   %Assuming to calculate the sum of error for linear fit
sse1=0; % Assuming to calculate the sum of error for cubic fit


ssr=0;  % assuming for linear fit
ssr1=0;  %assuming for cubic fit

k=1; %number of independent variable

y=mean(cp); %calculation of mean value of cp


% curve fitting

%for linear curve fit
linear=polyfit(temp,cp,1);       %Coefficient for linear fit
cp_linear=polyval(linear,temp);   %value for predicted cp


%for cubic

cubic=polyfit(temp,cp,3);    %coefficient for cubic fit
cp_cubic=polyval(cubic,temp);  %value for predicted cp


%Criteria checking

%sum of error calculation

for i= 1:n
    error=(cp_linear(i)-cp(i))^2;  %Individual error calculation for linear fit
    error1=(cp_cubic(i)-cp(i))^2;  %individual error calculation for cubic fit


    sse=sse+error;      %total sum of error for linear fit
    sse1=sse1+error1;  %total sum of error for cubic fit
end


%R square calculation


for j=1:n
    a=(cp_linear(j)-y)^2;
    a1=(cp_cubic(j)-y)^2;

    ssr=ssr+a;     %Total sum of ssr for linear fit
    ssr1=ssr1+a1;  %Total sum of ssr for cubic fit
end

sst=ssr+sse;
sst1=ssr1+sse1;

r=ssr/sst;    %R square calculation for linear fit
r1=ssr1/sst1;  %R square calculation for cubic fit


%Root mean square error calculation

rmse=(sse/n)^0.5;   %RSME calculation for linear fit
rmse1=(sse1/n)^0.5;  %RSME calculation for cubic fit


%Adjusted r square calculation

ad=1-((1-r^2)*(n-1)/(n-k-1));   % For Linear fit
ad1=1-((1-r1^2)*(n-1)/(n-k-1)); %For cubic fit


%Plotting

%Plotting for linear curve fit

figure(1)
plot(temp,cp,':','Displayname','original data');
hold on
plot(temp,cp_linear,'displayname','Linear fit')
lfit1='Value for R square(Rsqr)=';
lfit2=num2str(r);
text(1500,1000,[lfit1,lfit2]);
title('Linear curve fit')
xlabel('Temperature in Kelvin')
ylabel('Specific heat capacity')

hold off
legend

%plotting for Cubic curve fit

figure(2)

plot(temp,cp,':','Displayname','original data');
hold on
plot(temp,cp_cubic,'displayname','cubic fit');
cfit1='value for R sqaure(R sqr)=';
cfit2=num2str(r1);
text(1500,1000,[cfit1,cfit2]);
title('Cubic curve fit')
xlabel('Temperature in Kelvin')
ylabel('Specific heat capacity')
hold off
legend
Codes for splitwise:
close all
clear all
clc


sp_data=load('data');
temp=sp_data(:,1);
sp=sp_data(:,2);

coeff=polyfit(temp,sp,3);
val=polyval(coeff,temp);


%extracting data
%Specific heat data
a=sp(1:500);
b=sp(501:1000);
c=sp(1001:1500);
d=sp(1501:2000);
e=sp(2001:2500);
f=sp(2501:3000);
g=sp(3001:3200);

%Temperature data extraction
t1=temp(1:500);
t2=temp(501:1000);
t3=temp(1001:1500);
t4=temp(1501:2000);
t5=temp(2001:2500);
t6=temp(2501:3000);
t7=temp(3001:3200);

%extracting coefficient
[c1,x1,mu1]=polyfit(t1,a,3);    %mu and X is calculated for centering and scaling
[c2,x2,mu2]=polyfit(t2,b,3);
[c3,x3,mu3]=polyfit(t3,c,3);
[c4,x4,mu4]=polyfit(t4,d,3);
[c5,x5,mu5]=polyfit(t5,e,3);
[c6,x6,mu6]=polyfit(t6,f,3);
[c7,x7,mu7]=polyfit(t7,g,3);

%predicted value
v1=polyval(c1,t1,x1,mu1);
v2=polyval(c2,t2,x2,mu2);
v3=polyval(c3,t3,x3,mu3);
v4=polyval(c4,t4,x4,mu4);
v5=polyval(c5,t5,x5,mu5);
v6=polyval(c6,t6,x6,mu6);
v7=polyval(c7,t7,x7,mu7);

%Plotting
plot(temp,sp,':','linewidth',3);
hold on
plot(t1,v1);
plot(t2,v2);
plot(t3,v3);
plot(t4,v4);
plot(t5,v5);
plot(t6,v6);
plot(t7,v7);
plot(temp,val,'linewidth',3);

xlabel('Temperature in Kelvin');
ylabel('Specific heat capacity');
title('Splitwise method');
legend('original data','Normal fit data','Splitwise data');
How to make curve fit perfectly?
If we increase the order of polynominal or by using splitwise method curve tends to fit perfectly. As we increase the order of polynominal , curve tries to pass through different set of data as a result, perfectness of curve fit increases.
How to get the best fit?
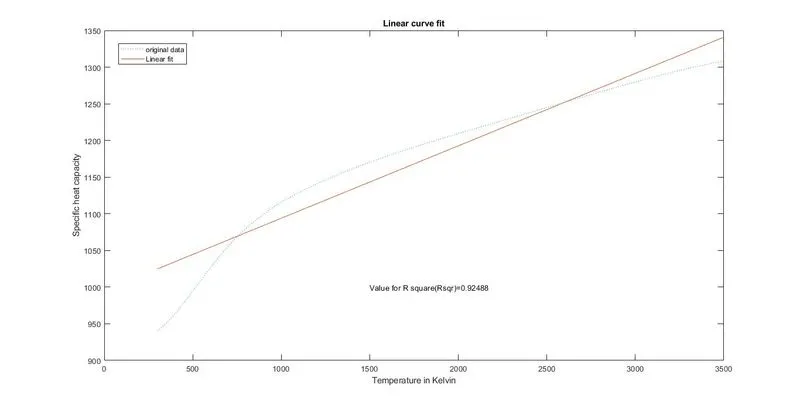
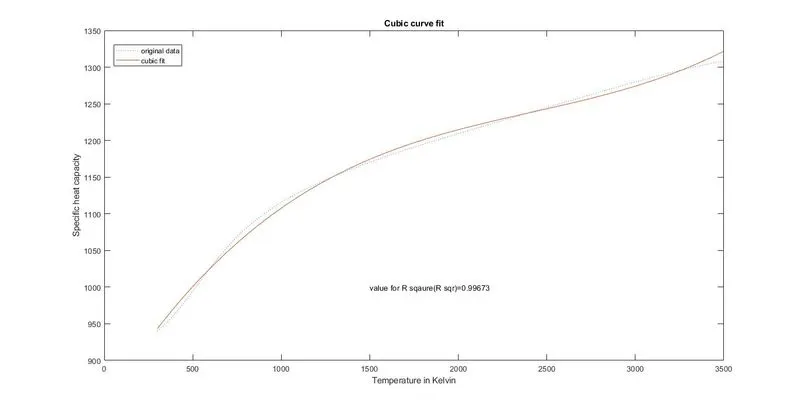
To obtain the best fit we have to increase the order of polynominal or splitwise method can be used. For same order splitwise method can be used. For above program , cubic fit seems to be best fit than linear fit. And if we overlook the value of Rsquare , value for r square for cubic fit is 0.9967 while for linear fit r square value is around 0.92. If value of r square is greater than 0.95 than it is considered as good fit.
What could be done to improve cubic fit?
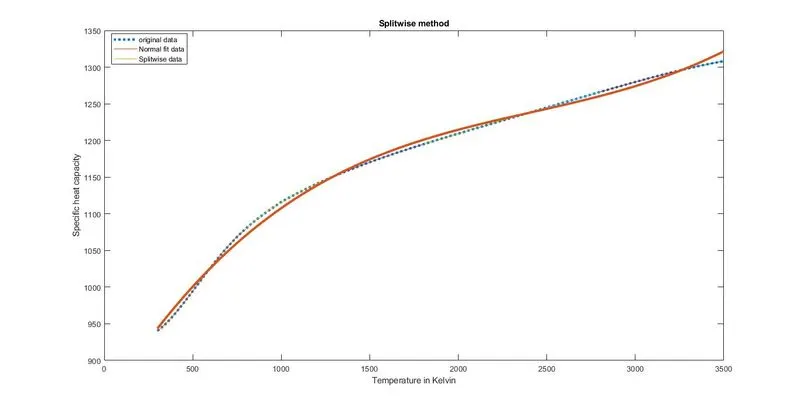
To improve the cubic fit, we can use splitwise method as shown in this project where , by using split wise method a much better fit was obtained.
Result:
Goodness parameters:
|
Parameters |
Linear |
Cubic |
|
Sum of error(SSE) |
2.163e6 |
9.427e4 |
|
R Square |
0.9249 |
0.9967 |
|
Adjusted R square |
0.8554 |
0.9935 |
|
Root Mean Square Error |
25.991 |
5.4277 |
Linear Curve Fit:
Cubic Curve Fit:
Normal Curve fit Vs Splitwise Curve Fit
Conclusion:
Better curve can be obtain when higher order polynominal are considered , while to obtain best fit for same order of polyniminal , splitwise method can be used which can be observed from normal fit vs splitwise plot.
References:
- https://en.wikipedia.org/wiki/Curve_fitting, last accessed,25 Aug,2021.
- https://www.originlab.com/index.aspx?go=Products/Origin/DataAnalysis/CurveFitting, last accessed, 25Aug 2021.
- https://www.slideshare.net/shopnohinami/curve-fitting-53775511, last accessed, 25Aug, 2021.
- https://skill-lync.com/student-projects/Curve-Fitting-and-criterion-to-choose-best-fit-41860, last accessed,25 Aug,2021.