Week-4 Challenge WOT Condition Part-2
1. To compare Mapped and Dynamic models in powertrain blockset and to change the model type.
Mapped model:
Mapped Engine
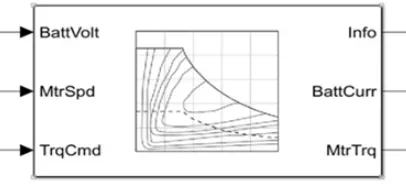
Mapped model uses a set of steady state values using Look up table for simulation.
The Lookup table is used to make the simulation easier and it gives results based on the input table values.
The Effect on the engine can be simulated with the array of data interpreted in the system.
The Engine specifications such as brake torque, fuel flow, air mass flow, exhaust temperature, efficiency and emissions are required for simulation.
The Motor specifications such as rpm, voltage, power, efficiency, temperature, torque, current are required for simulation.
Dynamic Model:
Dynamic Engine
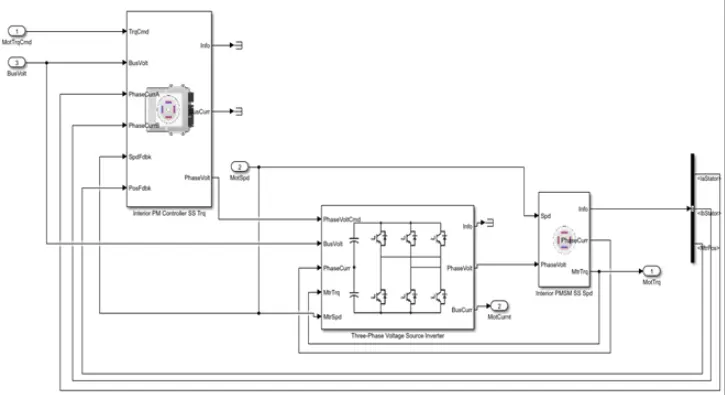
Dynamic model decomposes the engine behavior into engine characteristics that are separated into lower level blocks.
The lower level blocks are combined together to form a dynamic model.
It operates dynamically depending on the situation of operation. Therefore detailed data and specifications are not required.
Dynamic model is a real time based model simulation which gives the detailed analysis of the components simulated and cannot be simulated using custom values.
The Engine performance are simulated based on the original specifications of that engine and the results are real time values.
To change the model type:
* Open HEV reference from MATLAB documentation and the below model will be displayed.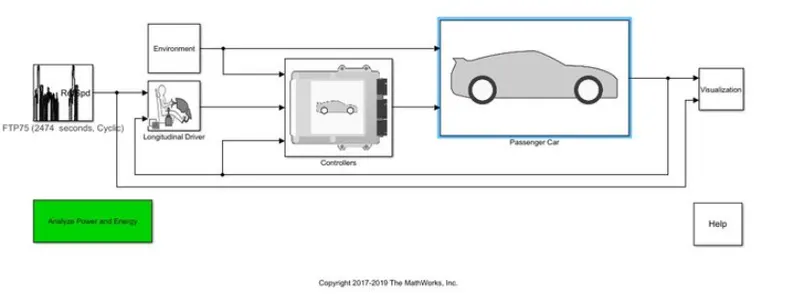
* Open the passenger car block and the below block will be displayed.

* Open Electric plant block and the below block will be displayed.
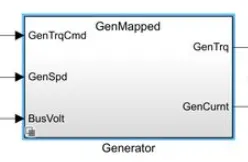
* Open Generator block and the below block will be displayed.
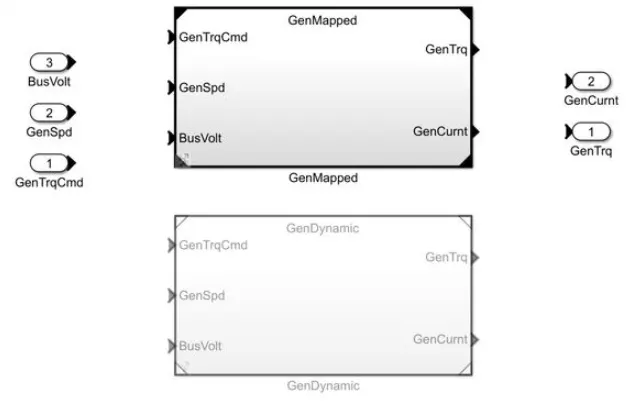
* Right click in the motor block and select variant.
In the Label mode active choice select MotGen Ev Mapped.

2.To calculate the miles per Gallon from Performance calculations block is used.
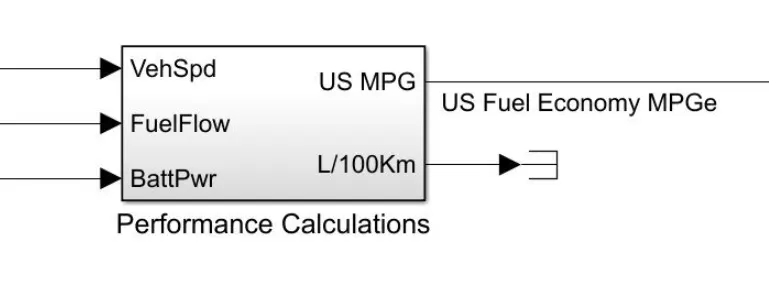
The performance calculation block consists of
Inputs: vehicle speed, Fuel flow, Battery power.
Outputs: US Miles Per Gallon, Liter/100km.
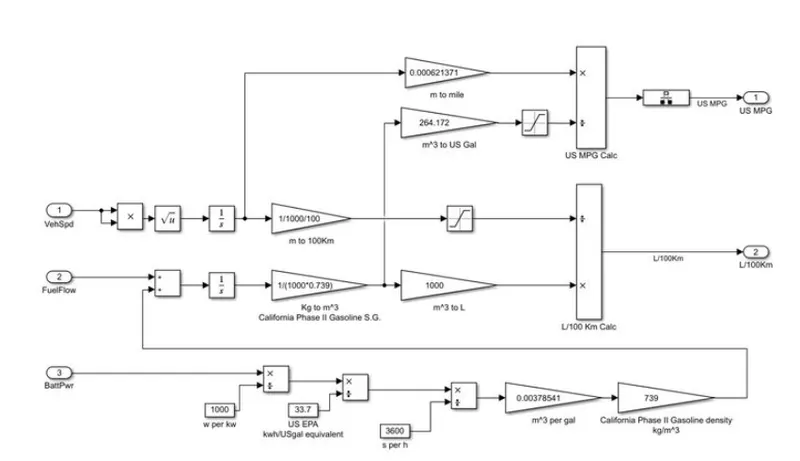
The vehicle speed input is in m/s which is integrated and converted to distance in miles by multiplying with 0.000621371.This cubic meter value is then converted into gallons by multiplying it with 264.172. The mile value and gallon value is used to find MPG of the vehicle.
The Battery value is initially converted from watts to kwh by dividing with 1000 and to obtain the gallon equivalent divide the value in kw with 33.7,then divide the value in by 3600 to get in per seconds and multiply by 0.00378541 to get the value in cubic meter per gallon and the value is multiplied by 730 to obtain the Gallon density in kg per cubic meters.
The Fuel flow and the battery power are combined and integrated in kilogram, which is converted into cubic meter by multiplying with 1/ (1000*0.739), then this value is multiplied with 264.172 to get the result in Gallon.
The Mile value from the velocity is multiplied and the Gallon value from the fuel flow is divided to get the output in Miles Per Gallon (MPG).
The Factors that are to be considered to model a Fuel flow are Vehicle speed, Fuel flow and Battery power.
3. To Run the HEV Reference Application with WOT drive cycle and to change the grade and wind velocity in the environment block.
HEV Reference Application model:
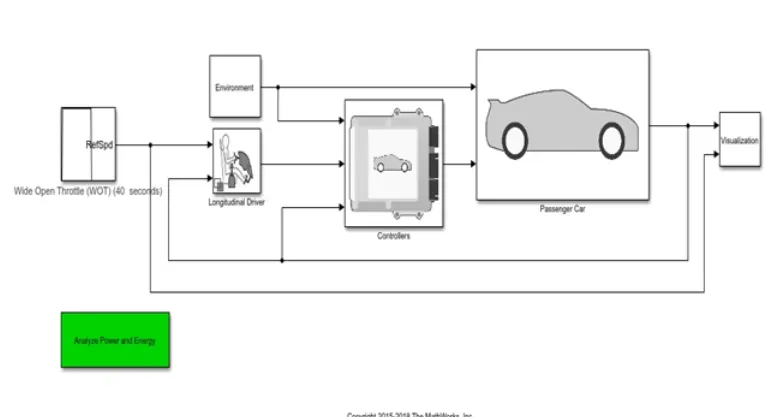
Drive cycle:
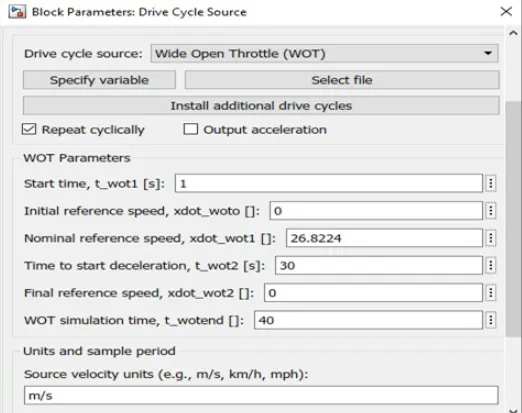
The Drive cycle source is changed to Wide Open Throttle (WOT) in the Drive cycle parameters.
Environment Block:
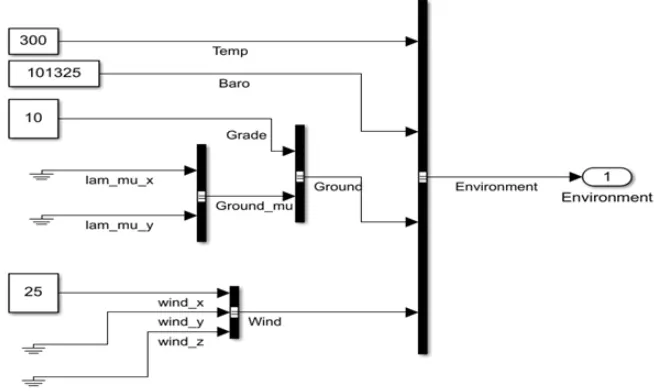
In the environment block the wind speed is changed to 25 m/s, the grade value is changed to 10 degree and the model is simulated.
Output:
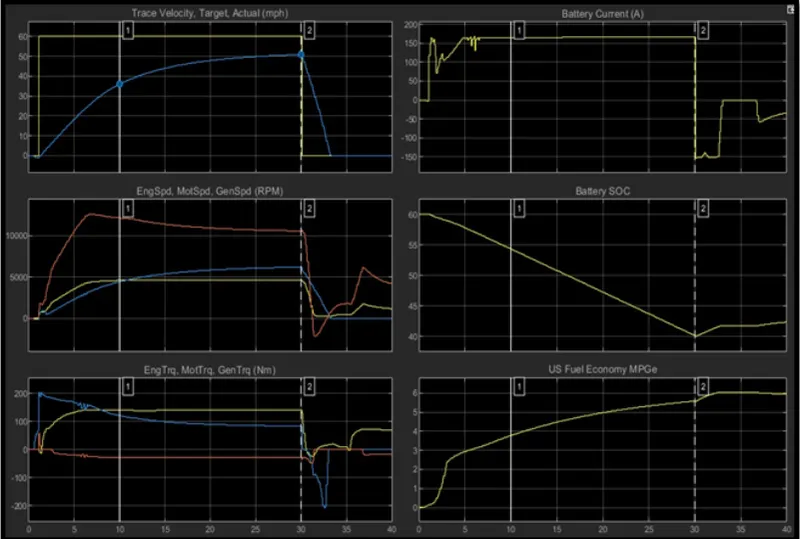
From the plots
Maximum velocity = 50.1 mph
Acceleration Duration = 29.034 seconds
Deceleration Duration = 3.226 seconds
Maximum motor speed = 5712 rpm
Minimum motor speed = 5451 rpm
Maximum Motor Torque = 306.62 Nm
Maximum Engine Torque = 174.71 Nm
Maximum Battery discharging current = 167 A
Maximum Battery charging current = 150 A
Battery SOC (State of Charge) in acceleration = 40%
Battery SOC (State of Charge) in deceleration = 60%
Fuel economy = 6.05 mpg(miles per gallon)
4. To compare the Hybrid EV with the Pure EV
Keeping the Input Drive cycle as WOT, Wind velocity 25 m/s, Grade 10 degree and remaining parameters as default Hybrid EV and Pure EV are simulated and the outputs are compared.
Output of Hybrid EV:
Output of Pure EV:
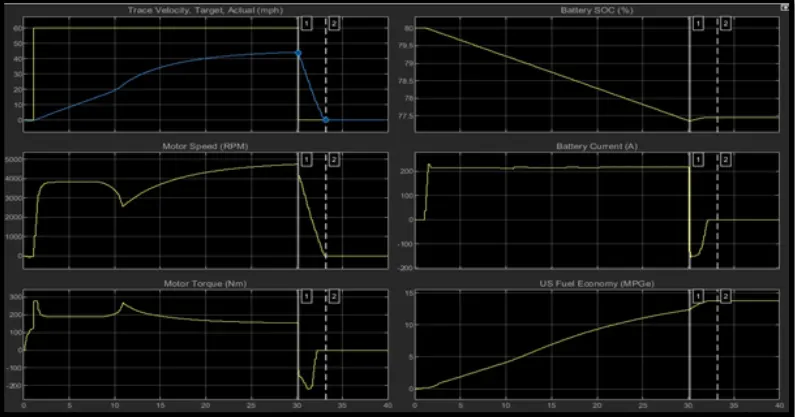
From the plots of HEV and pure EV,
* Fuel Economy is higher in pure EV compared to Hybrid EV
* The Battery current is higher in pure EV because Pure EV operates only with the Battery source
* The Maximum speed is higher in Hybrid EV compared to pure EV.