Week - 4
1. Control logic of Washing machine using stateflow.
Objective: To build a logic for a washing machine using stateflow with the conditions for power supply, water supply, process completion indication.
Simulink model
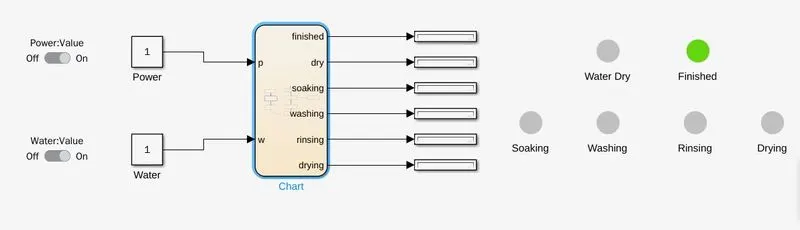
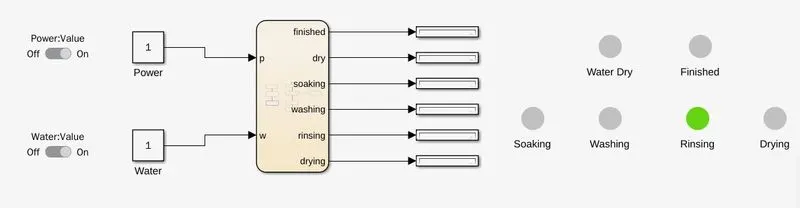
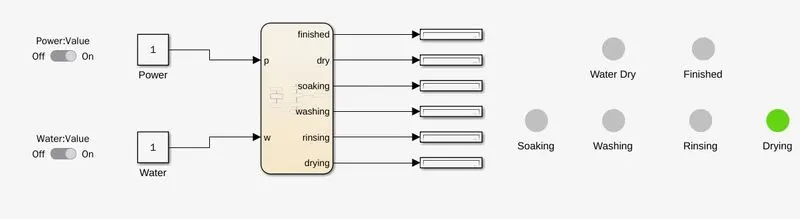
The simulink model consists of two constant blocks. One constant block for the power input and another constant block for the water input. The constant blocks are controlled using sliding switches. In the above Simulink model finished indication is ON which shows the process completion. Six lamps are used for the indication of water dry, finished, soaking, washing, rinsing, drying. Depending on the power, water conditions the state flow executes the process and the corresponding lamps will indicate the output.
If power =1 (ON) and water =0 (OFF) then,
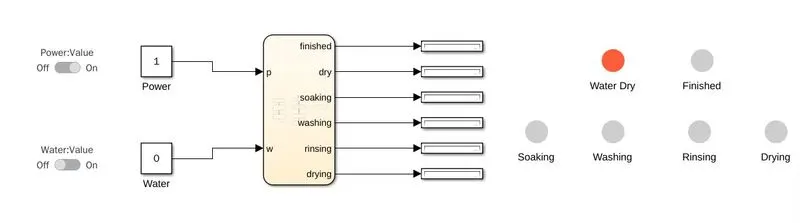
Soaking: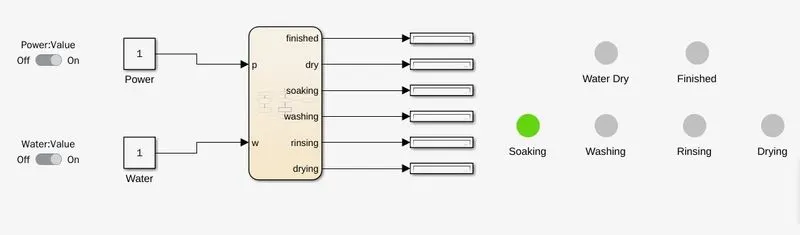
Washing:
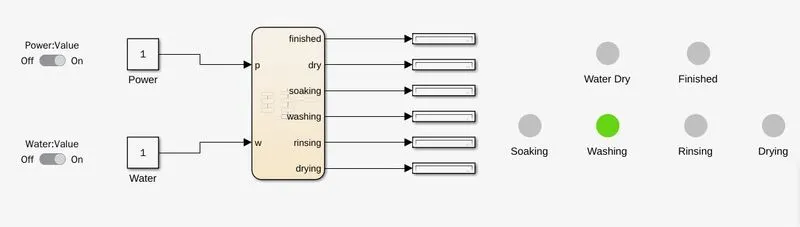
Rinsing:
Drying:
Stateflow model:
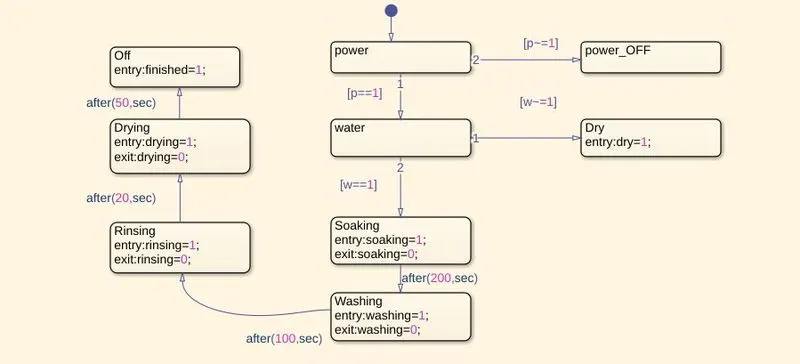
The above chart consists of two Inputs and six outputs. Power and water are the inputs. Soaking, washing, rinsing, drying, dry, finished are the outputs. The stateflow works on the two main conditions. The condition for the power input is checked using the variable p and the condition for the water is checked using the variable w. The dry output is executed by checking the water condition. The soaking, washing, rinsing, drying are executed by the time delay. The finished output is executed for the end of process.
conclusion: Thus the logic for washing machine using the given conditions and delays using the stateflow is done and the required output is obtained.
2. Gear shift using chart
Objective: To create a Simulink model for Gear shift depending the variable input speed that can be changed during the runtime using chart. The condition for the gear value for various speeds is given as
Speed Range(kmph) Gear
0 to 15 1
16 to 25 2
26 to 40 3
41 to 60 4
Above 61 5
Simulink model
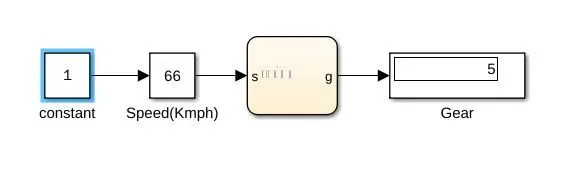
The above Simulink model shows the change in the value of the gear for the corresponding speed from the slider gain. The model consists of a slider gain which is used to change the value of speed while the running time of the model. The output from the chart is given to the display to view the gear value.
Stateflow:
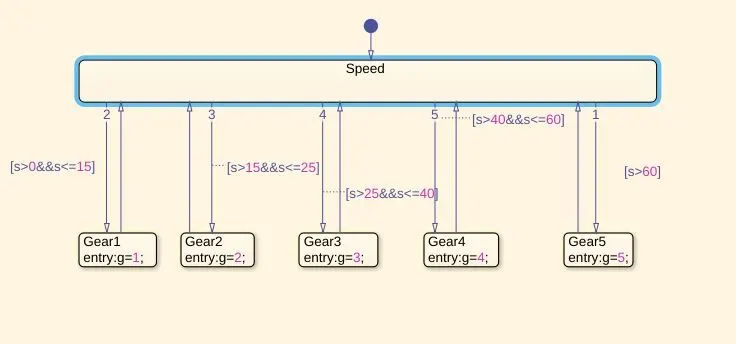
The above chart consists of one input and one output. Speed is the input and its values are obtained from a slider gain. The output is the value of gear for the corresponding value of speed from the given conditions. The value of gear varies from 0 to 5.
The conditions used in the chart are
gear 1: speed >0 AND speed <=15
gear 2: speed >15 AND speed <=25
gear 3: speed >25 AND speed <=40
gear 4: speed >40 AND speed <=60
gear 5: speed >60
Conclusion: Thus the Simulink model Gear change for the corresponding value of speed conditions using chart was completed and the required output is obtained.