Week-4 Challenge WOT Condition Part-2
Challenge 1-
There are two types of model available in matlab enviroment for designing powertrain blocksets. namely mapped and dynamic models. The basic difference between these two are in the name itself, mapped model contains the experimental data related property of the engine/motor/generator in the form of lookup tables, whereas Dynamic model contains basic system level components model, connected to each other as they are in the physical world.
| Mapped model | Dynamic model |
| It is created by mapping the experimental data of the engine conducted in the labrotary. | It is created by system level modeling of the basic components in the model. |
| Data used in the mapping is come from the manufacturer data sheet | Data or components are the equivalent circuit and their parameters are calculated by measurement in the physical world |
| It doesn't give detailed results under the model itself | It can give detailed results over every components of the model |
| It requires less time to simulate the model | It require comparetively more time to simulate the model |
The changing of the model type in the Reference model of the powertain blockset is done by selecting the varient from the model option, please follow the following approach to select the model type in the simulation
passenger car> electric plant> motor> Right click> varient> label mode active choice> select model.

Challenge 2-
The miles per gallon is calculated by comparing the output power to the standard value of galllon per kWh suggested by the United State Enviroment Protection Agency(USEPA) that is 33.7 kWh/US gallon. This index indicates the equivenent value of the energy given by the engine for the input as 1 gallon of fuel.
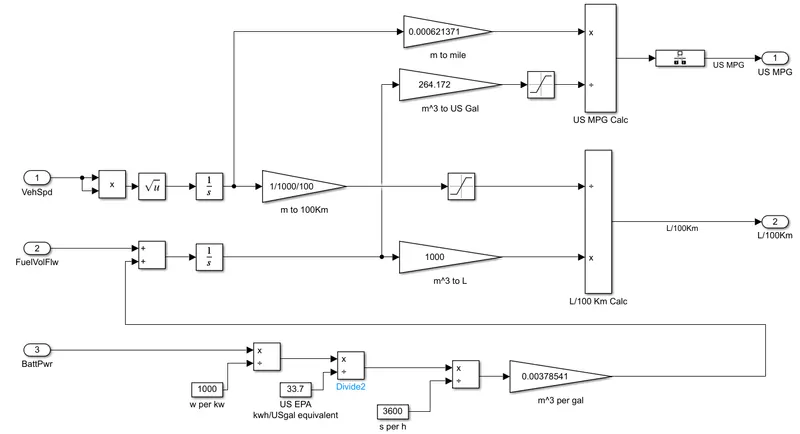
The battery power output is converted to the equivalent fuel quantity withe the help of US EPA index and then added to the fuel intake of the engine, and then integrate this fuel value for calculating total equivalent fuel taken by the vehicle and then divide this quantity to the distance travelled by the vehicle and hurray..! we got miles per gallon index.
Challenge 3-
In this challenge we run the HEV multimode reference project, available in the matlab documentation, by opening the model we can see the model first impression as follows..
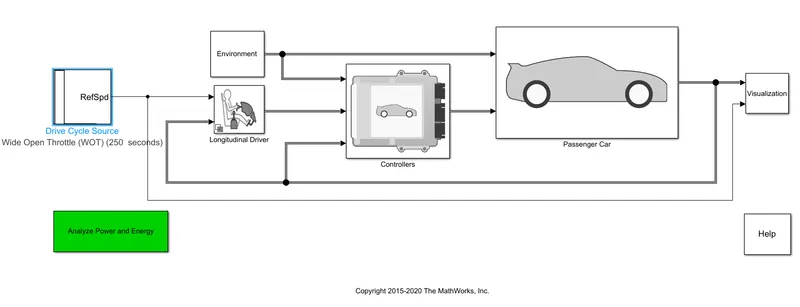
we run this model for WOT(Wide Open Throttle condition) as a reference of 120miles/h of speed for almost 55sec and then deacceleration process begins.
The results are shown in the scope as follows.....
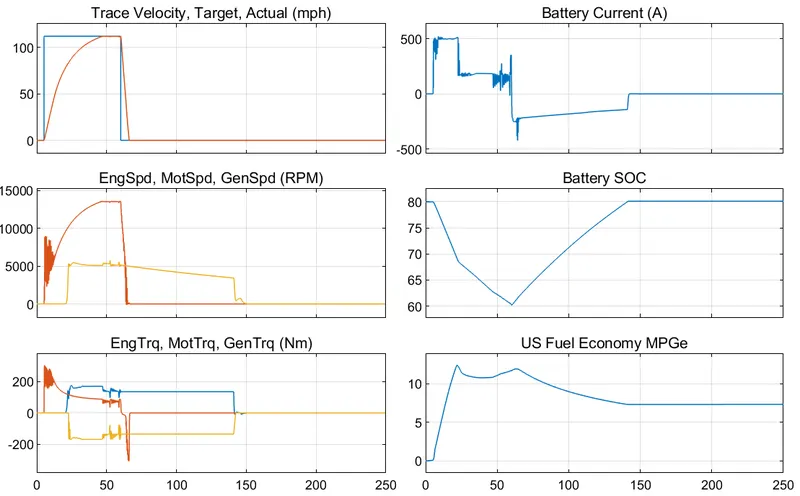
here we can see the actual speed is trying to meet the reference speed but the delay is happen due to max power output limit for accelerating power.
Firstly the vehicle try to attend the reference speed by motor alone but the SoC of the battery reaches the lower limit i.e. 70% around the 25 sec and therefore engine is turned on by the HEV supervisory controller and the required power is shared by the engine along with generator (for charging battery).
The motor and Engine togather supply the accelerating power untill the reference speed achieved and then motor and vehicle speed deaccelerate(for around 7 seconds) after completing the WOT condition and the regenerative braking is applied that is limited by the charging capacity of the battery.
After the vehicle speed reaches zero after deaccelerating period, The Engine continue to run to charge battery upto max SoC limit specified in the master controller.
Now we change some of the enviromental factors as below
grade= 5 units
wind velocity= 3 m/s
now we run the model by keeping all other values as unchanged.
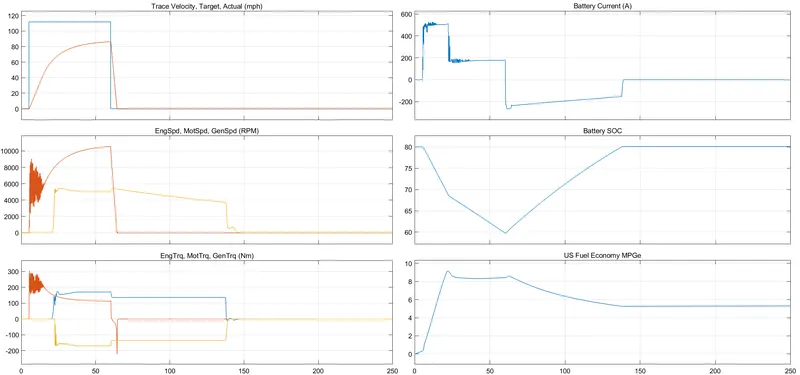
Here we can see, by changing the grade and wind velocity the power required will increase drastically and the limited vehicle output power is not sufficient to drive the vehicle to 120 miles/h speed and corresponding all other values are at their maximum values.
all other comment are same for this condition except the vehicle can attend the max speed of 83.6miles/h and fuel economy is better because all components runs at its maximum parameters.
Challenge 4-
HEV model
In this challenge we try to compare the performance of HEV multimode model car to the pure EV vehicle model. for achieving our aim, first we have to make their battery capacity same and all other enviromental factors should be same for better comparison of the vehicle.
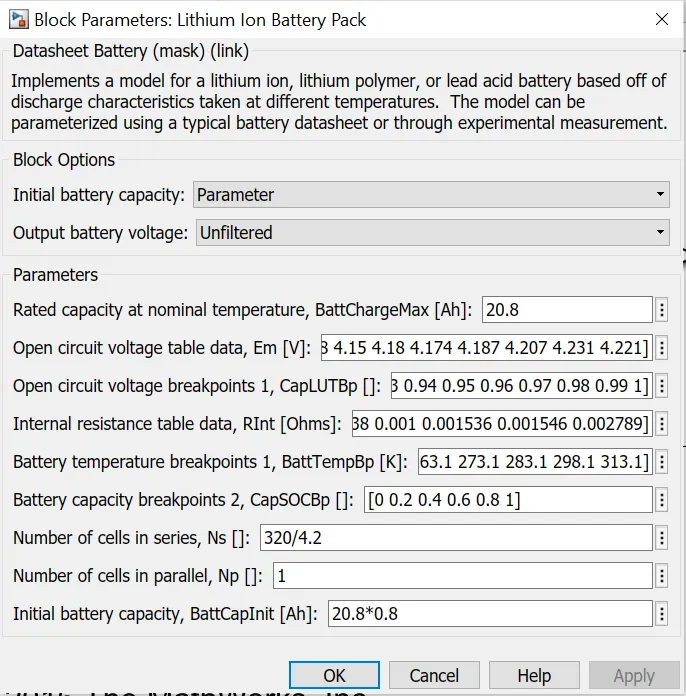
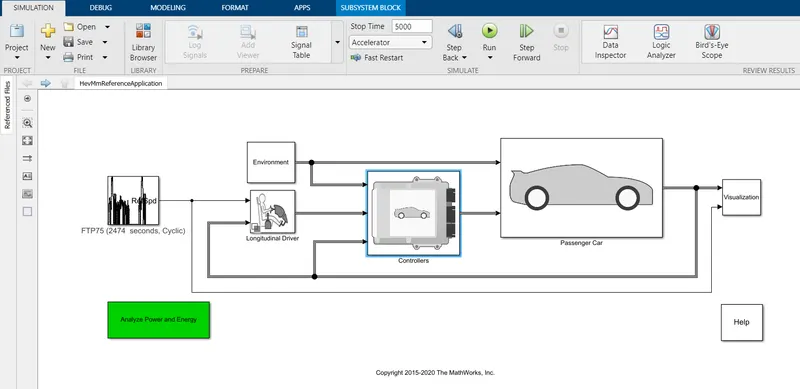
here we use FTP-75 cycles repeated for 2 times(5000secs). and we modfy the SOC low value as 60% so the engine can run for more period and we can see a good graph representing HEV vehicle as all components runs for good period of time and more efficiently. here is the results after the simulation.........
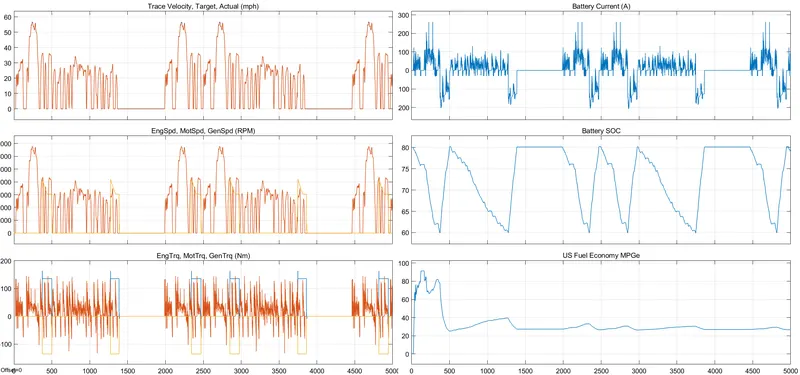
here we can see the overall fuel economy is around 30MPG as the combination of the engine motor and generator with the highest efficiency for every operating point, the motor runs in priority untill the boundary limits reaches. otherwise motor takes full control.
here engine charges battery and supply power to vehicle untill SOC reaches 80% and this cycle continues for 5 time in this case.
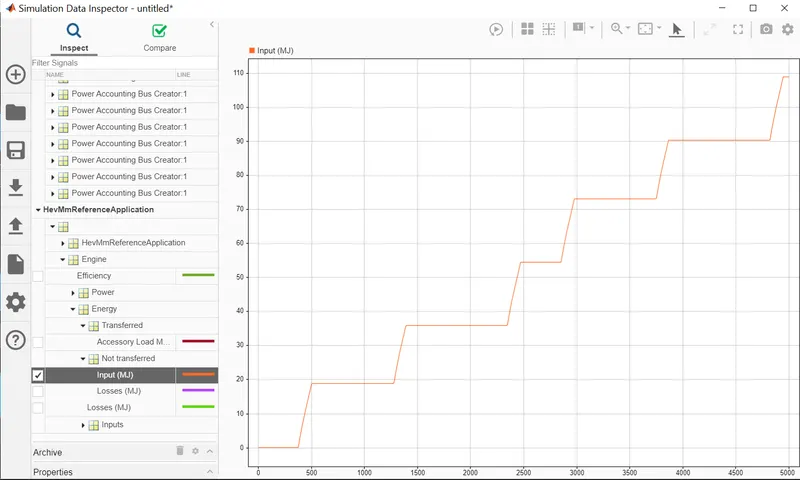
battery current upper and lower limits are around 260A and -200A, and so battery drain for 5*20%=100% equivently. and engine takes around 110 MJ of energy for this drive cycle.
EV model-
Now we open the pure EV vehicle powertrain blockset and runs FTP-75 cycle for 5000 seconds with initial SOP of 80% and analyse the results. here we take the same battey specifications for better comparison.
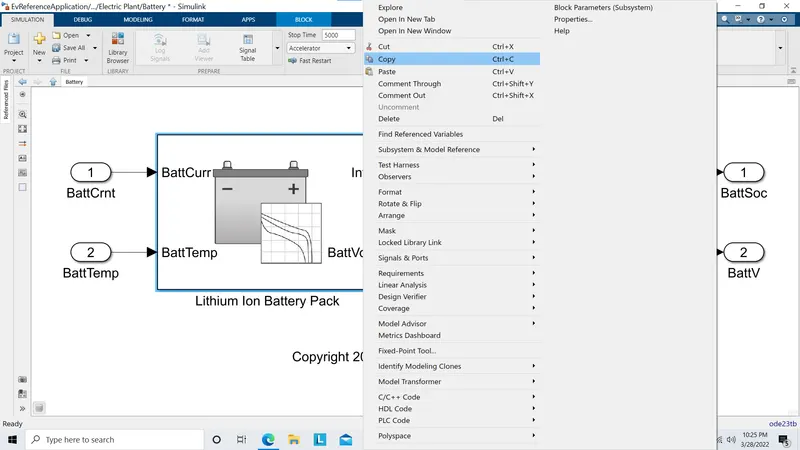
for simplicity we copy the battery model from HEV model and paste in the EV model.
Now we analyse the results with all other parametes same and runs for same driving cycle condition. results are.......
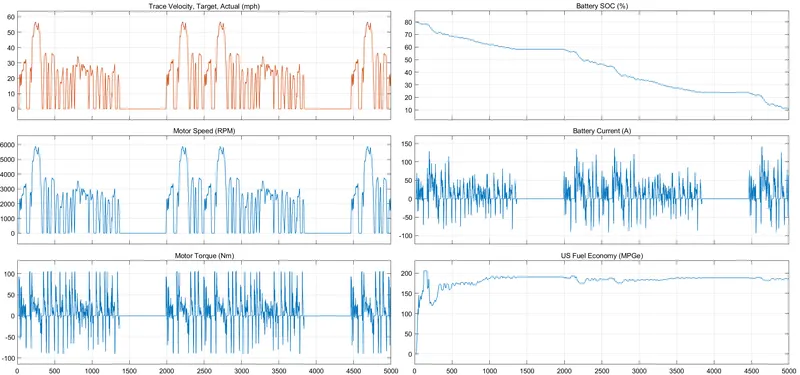
here we can see the vehicle runs for around 190 MPG and this is huge compare to the HEV model as EV uses battery power as primary source of energy and motor are way more efficient than the engine.
Even HEV vehicles all components works at their best operating point, the engine cannot go over 35% efficiency max so is the fuel efficiency is lower in case of HEV.
The SOC drains for around 80-10% and battery currents limited to +130 to -100A.
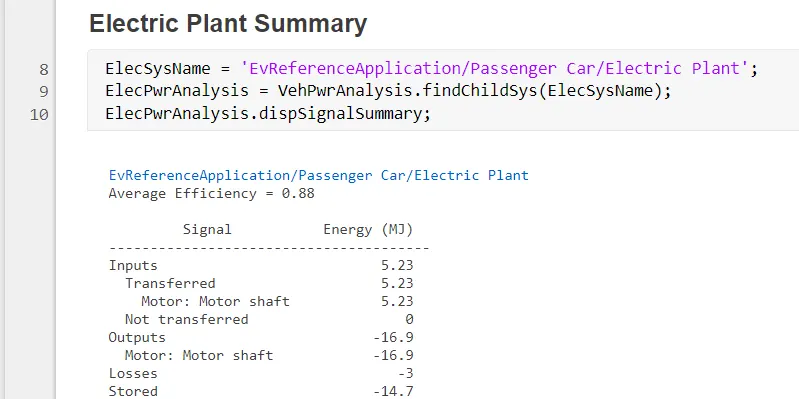
The energy taken by the vehicle for this Drive cycle is only 5.23MJ, it is very less compare to HEV(which is around 110MJ). The total energy output is around 16.9MJ in which 14.7MJ of energy is return back by regenerative braking, because of high deacceleration in the drive cycle.
Conclusion-
here we can conclude that EV is way more efficient than the HEV vehicle in overall efficiency criteria and also have better running characterstics as it requires less battery current to achieve the desired performace( weight of the vehicle is less).