Week - 4
Challenge 1-
we have to design a control logic for a washing machine using simulink chart, where constraints are as follows,
1. if the power supply is available the system get activated
2. if water is not available stop the process
3. soaking, washing, rinsing, drying time are respectively 200,100,20,50
4. after the completion indicate through lamp
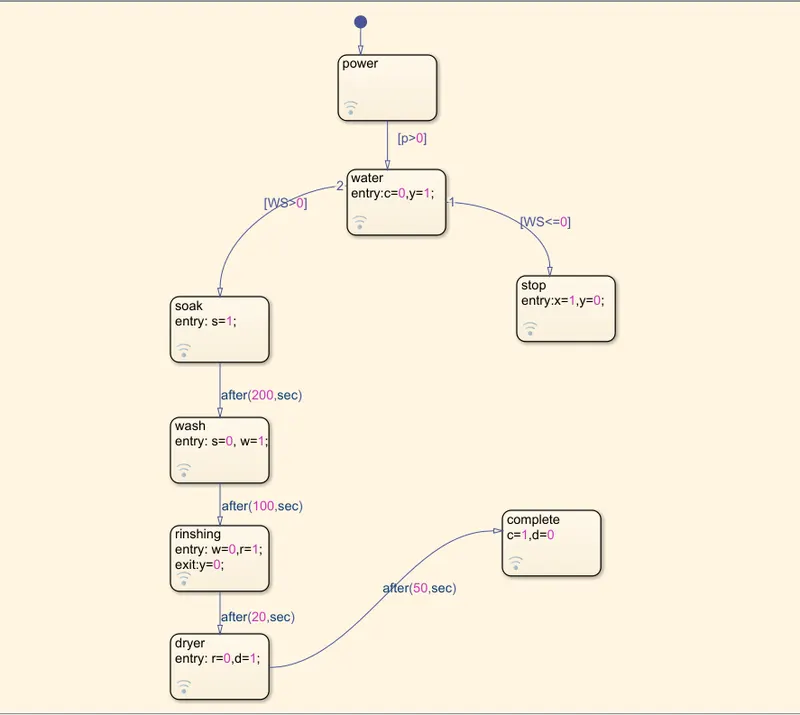
here we use lamp with green as active and red as inactive condition. after that we use chart with input power supply(p) and water supply(WS). as per above logic we give delay, indicating time, which is used for corresponding activity and we use different variable as follows,
y=water in washing machine;
c=complition of task;
s=soacking;
w=washing;
r=rinshing;
d=drying;
x=stop process;
when machine shift state from one to another the respective state variable assign as active and preivious state is assigned as inactive so that indication of current state can be obtained in real time.
chart is made though data given above;
the model with indicator looks like....
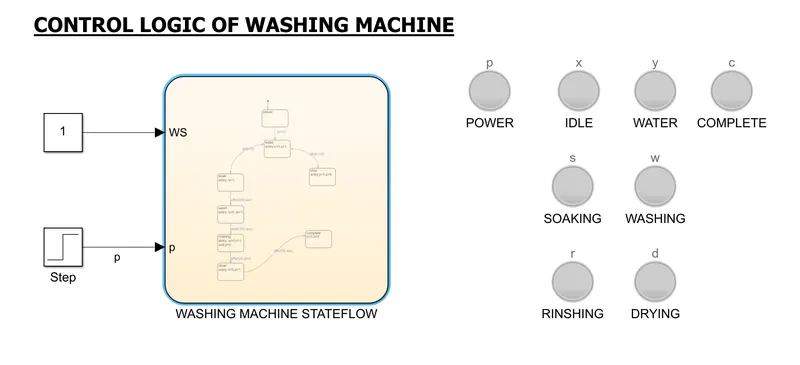
we give power input as a step singnal starting step time of 20 sec, it can be verified that machine will activate only after power is given to the machine will active high(1). and we consider water supply as active high(1) for this iteration.the time taken by simulation is almost 370s so we update stop time as 500s.
the output can be visualise by using step forward funtion. the model is attached with submission.
Challenge 2-
in this part we have to make gear shift stateflow model with following constraints,
| Speed(km/h) | Gear |
| 0-15 | 1 |
| 16-25 | 2 |
| 26-40 | 3 |
| 41-60 | 4 |
| above 61 | 5 |
to attempt the above problem we use 5 state blocks indicating 5 gears of the vehicle. and transition between gears are made with speed condition given as per the constraints.
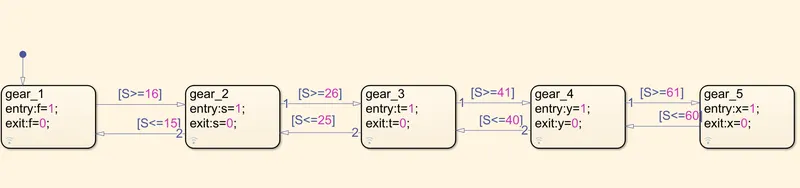
here f, s, t, y, x indicates first, second, third, fourth, fifth gear respectively. and output can be shown in display as chart output and lamps assign with each state(gear). for better understanding the real time process, i use a speed meter so that we can validate the model.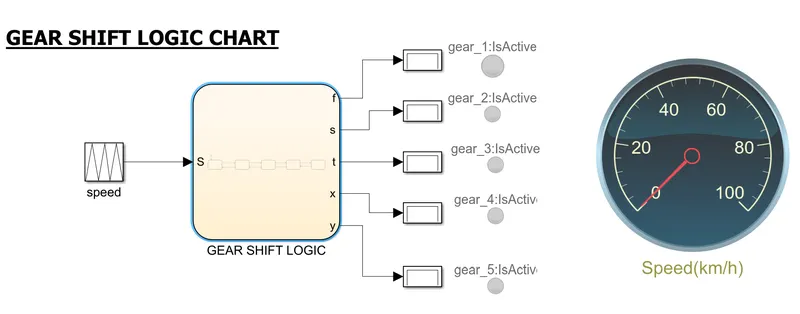
we give speed as linearly increasing and decreasing sequence with time cycle of 30 sec. By simulating the model step by step we can visualise auto gear shifting according to the real-time speed sensing.