Week-4 Challenge WOT Condition Part-2
1. What is the difference between mapped and dynamic model of engine, motor and generator? How can you change model type?
Mapped Engine: Mapped engine is used to measure the performance parameters of the vehiclel by using standard lookup tables. This type of model is inaccurate. The look up table values are based on engined speed, brake and commanded torques.The Data extracted from the look tables are Air mass flow,fuel flow, emission data, exhaust temperature and efficiency.
Dynamic Engine: Dynamic model uses real time data fed by the user at run time for modelling.This model is more accurate than mapped model. this type of model is used when the data of subsystems of a vehicle is required. we can calculate brake torque, fuel flow, port gasmassflow, exhaust temperature , exhust mass flow rate and exhust emissions.
Mapped Motor:The Mapped Motor block implements a mapped motor and drive electronics operating in torque-control mode. The output torque tracks the torque reference demand and includes a motor-response and drive-response time constant. Use the block for fast system-level simulations when we dont know detailed motor parameters. The block assumes that the speed fluctuations due to mechanical load do not affect the motor torque tracking.
Dynamic Motor: In a dynamic motor model three phase permanent magnet synchronus motor (PMSM) is used. This block uses 3 phase voltages to regulate the current based on load demand and allows to control the torque and speed. This block is used when the user knows that parameters are the to be used in the particular sumulation. this dynamic motor model is more accurate than mapped model.
Mapped Generator: This mapped model is also a block, most of the data required is taken from the lookup tables corresonding to the given input parametrs. Simulation time of mapped generator model is less and inaccurate.
Dynamic Generator: The dynamic generator model involves user entering the parameters manually during the run time for a particular applications. This model will take time for simulation and accurate.
Changing Model Type from Mapped to Dynamic.
For Example, Changing mapped motor model to Dunamic model:
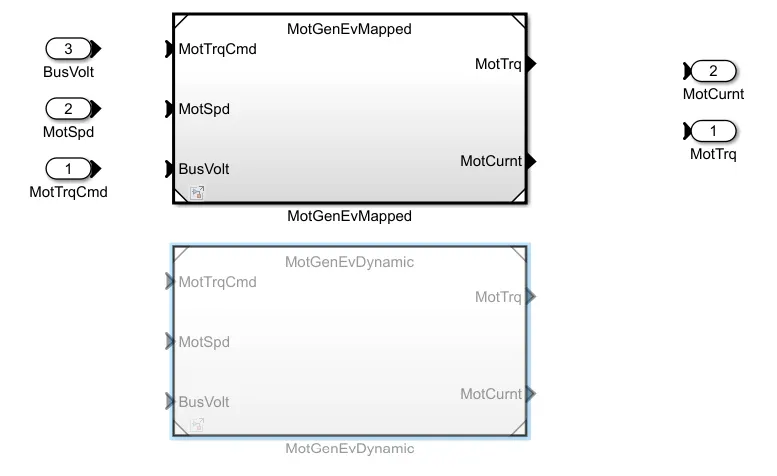
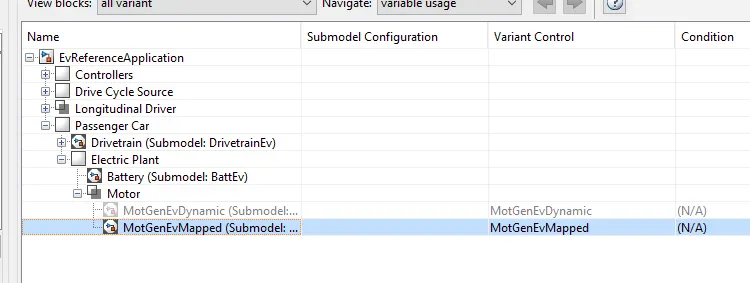
Go to modelling>Varient manager>Click on MotGenEvDynamic>Select set as label model active choice> then righclick select on open and highlight block.
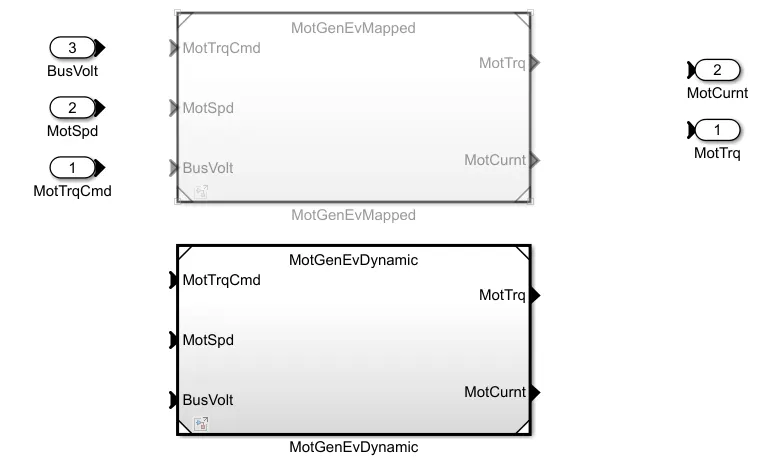
we can see the highlited dynamic block will be selected as shown below.
2.How does the model calculate miles per gallon? Which factors are considered to model fuel flow?
According to the EPA, one gallon of gasoline is equal to 33.705 kilowatt-hours. The mile per gallon gasoline equivalent is a US customary unit of electric car efficiency. Miles per gallon gasoline equivalent can be abbreviated as MPGe; for example, 1 mile per gallon gasoline equivalent can be written as 1 MPGe.
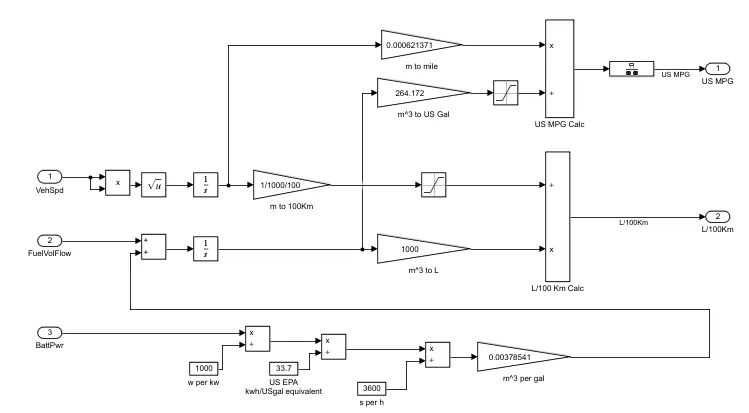
Simulink blocks used for calculation of US MPGe and L/100 Km is hsown below,
Calculations:
Initially, the battery power is converted to kw (W/1000) , then by dividing with USgal Equivalent to the result and then dividing with 3600 to convert into sec/Hr. The n The resultant is multiplied with a gain 0.00378541 to chnage the units to m3 /gal.
The given mass flow rate (kg/sec) is integrated to obtain how much fuel is used in kg. then, multiplied with a gain of 264.172 for changing the units from m3 to US gal and saturated the limits.
Simultaneously consider the distance travelled in meters by integrating the velocity of a vehicle and convert to miles multiplied by a gain block of 0.000621371.
Now divide the two resultants followed by a rate transition block to obtain the miles per gallon.
Factors considered to model fuel flow are:
- Vehicle speed
- Fuel volume flow (for HEV)
- Battery power
3.Run the HEV ReferenceApplication with WOT drive cycle. Change the grade and wind velocity in the environment block. Comment on the results.
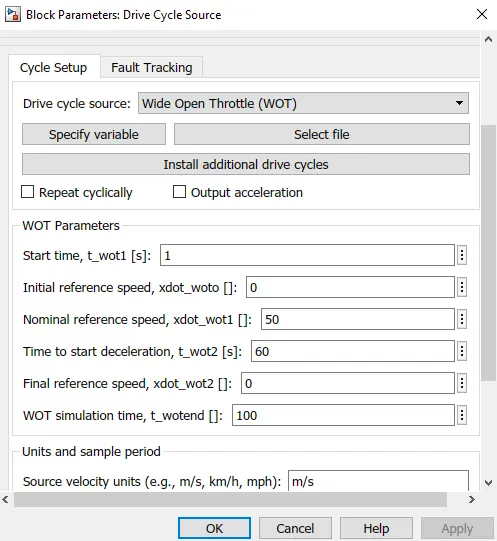
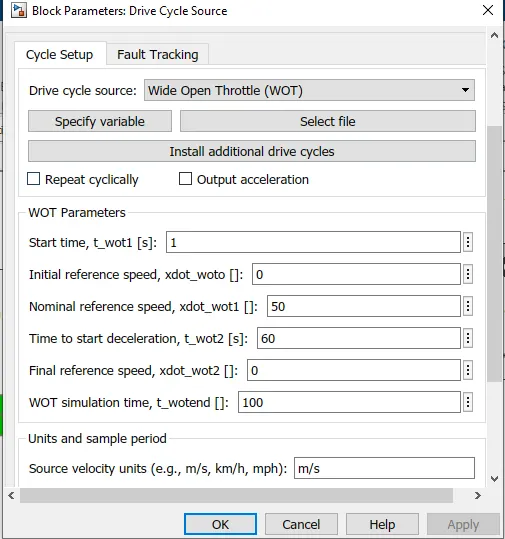
Considered HEV reference application and the drive cycle changed to WOT and the other parameters as shown below,
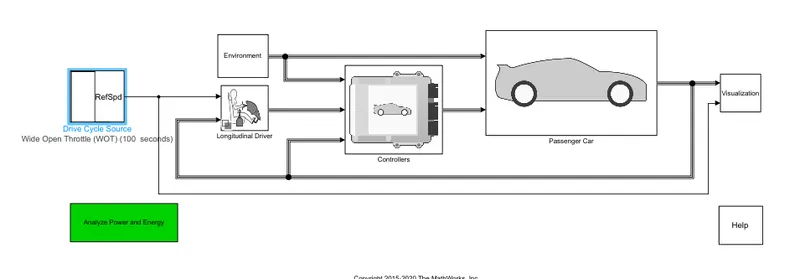
HEV model with WOT For 40 sec shown below:
Results:
Trace velocity,Target (yellow),actual(blue) in mph:
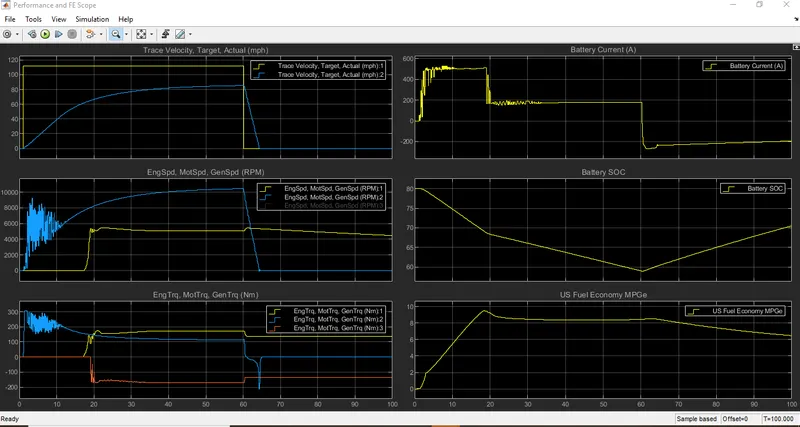
It is observed that, power generated by the source is not enough to meet the wideopen throttle requirements. So that we can obsorve the difference in the Actual and target curve shown in 1 st graph.
Battery Current :
Initially, current supplied by the battery is high to meet the high initial velocity during WOT. When the velocity is constant the current also become constant. ehrn the deceleration sarts thebattery current becomes negative, which indicates regenerative braking.
Battery SOC:
The battery SOC keeps on dereasing as the current is supplied initially. when the vehicle starts decelerates, during regenerative braking the battery SOC starts increasing.
Engine,Motor and generator Speed: Initially only motor is used to start the vehicle as motor has high initial torque.Later generator starts charging the battery when SOC drops below 60%. Engine graph cant be seen as it may have overlaped with generator.
Engine, Motor and generator Torque: Motor torque is hih initially and the engine starts incereasing when the battery SOC reaches less than 60%. And the generator torque is negitive as its charging the battery.
4. Keeping all other parameters same, compare the simulated results of hybrid and pure electric powertrains.
Model of Pure electric vehicle with WOT drive cycle:
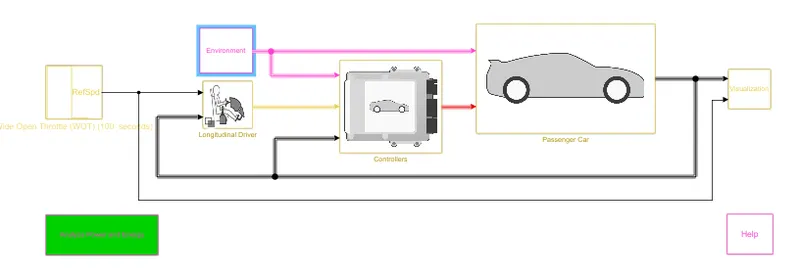
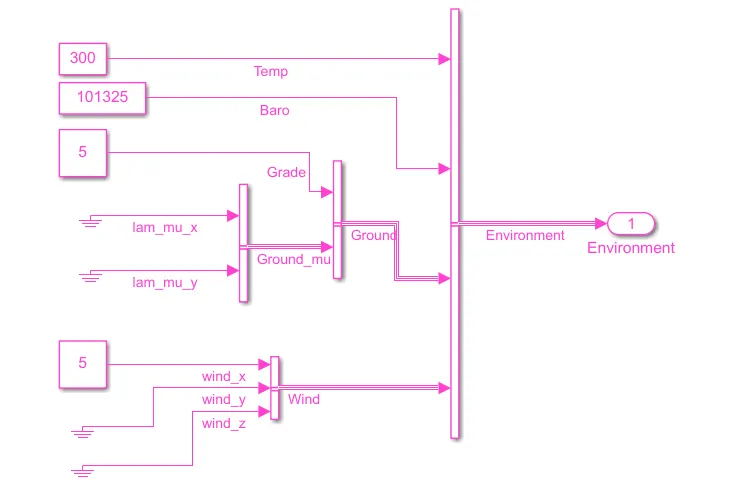
Keeping all the parameters same but Drive cycle, grade and wind velocity is changes as Hybrid electric vehicle.
Results:
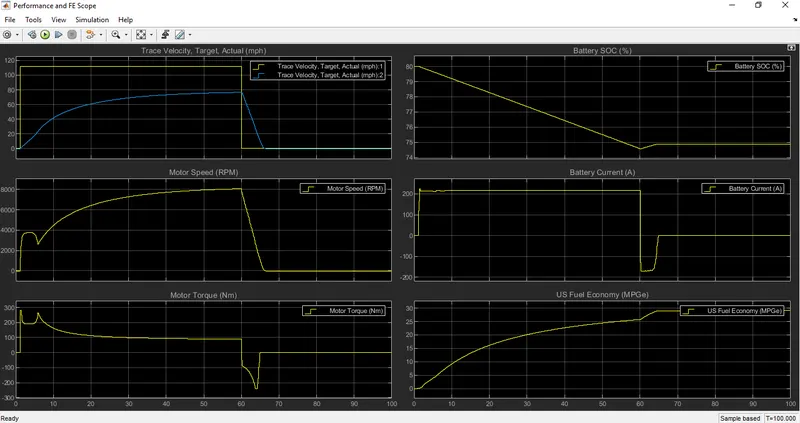
Trace velocity:Ideally, Velocity should be equal to target plot (yellow) shown in the graph. but the blue line shows the actual plot of velocity. It means the vehicle battery power is not meeting the vehicle power demand. Once the velocity becomes zero, the aactual velocity also gradually becomes zero(deccelerating).
Motor Speed: Motor speed started increasing gradually at the sarting due to high starting torque and deccelerates when the velocity or the drive cycle demands the power to be zero.
Motor Torque: We can observe that motor torque at the initially stage is higher side, because to reach the target velocity of vehicle, motor has to deliver huge power to the vehicle initially. when the vehicle starts deccelerating the vehicle is produccing a negitive torque which means regenrative braking is applied and power is fed back to the battery to charge is shown in battery SOC or the current is fed back to the battery shown in battery current plot.
Battery SOC: its a state of charge, when the battery power is utilised by motor the battery soc will be reduced. The same can be seen in the plot, when the motor speed is increasing the battery is discharging and the SOC is reducing gradually. when the motor is in regeneration mode, the battery tends to charge which is shown in the plot.
Battery Current: when the motor is demanding high torque at the starting,the motor is drawing more current from the battery. when the motor demands constant power current drawn also become constant and during regenerating more current goes negitive in the plot means battery is charging in the regeneration mode.