Week-3 Challenge: ADVISOR Tool
1. For EV_defaults_in file, if cargo mass is 500 kg with all other default conditions, can the vehicle travel for 45 km with FTP drive cycle? Conclude your observations.
Use matalab advisor tool to simulate the vehicle parameters. opening of simulation tool:
- open matlab and set the directory path to advisor.
- Type advisor in the command window.
- Advisor 2002 window will open on the screen. Select units as metric and press on start. Default vehicle input file will open as shown in the figure.
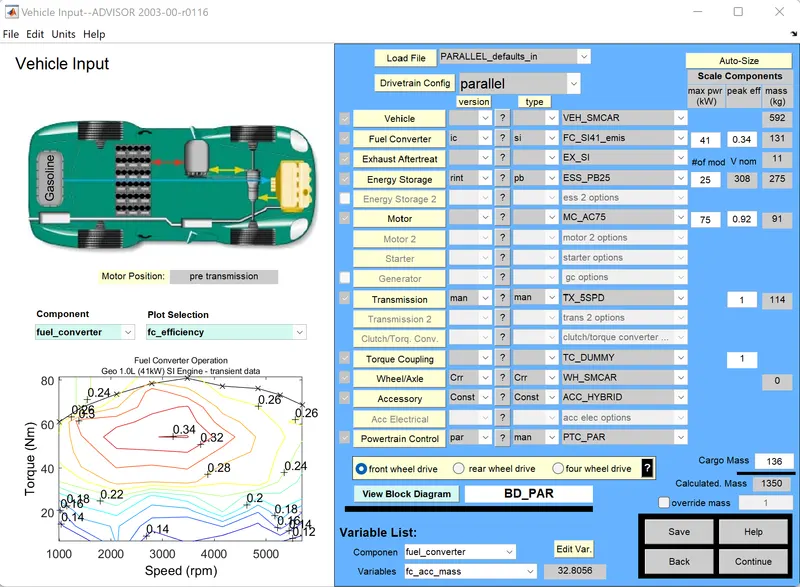
As given in the question needs to select EV-default file and the cargo mass to 500 kg as shown in the figure below.
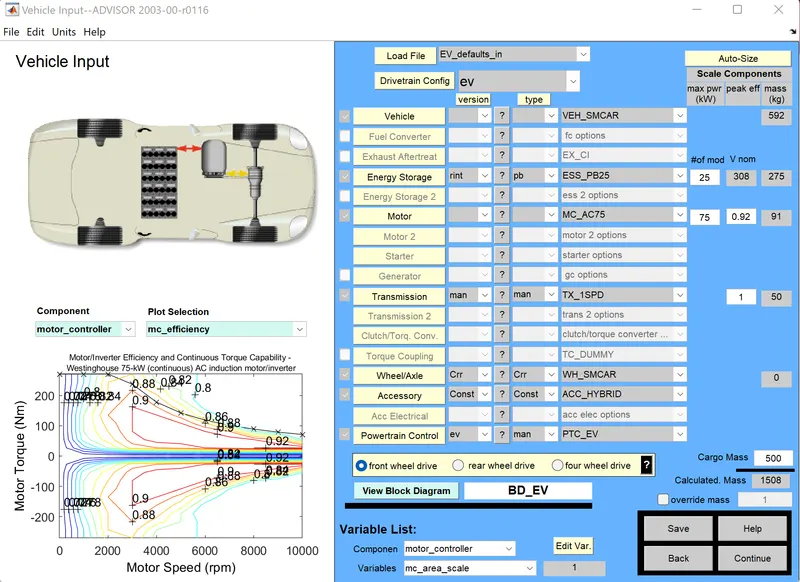
After selecting the parameters in the vehicle input by keep other values as default value, click on continue to see the simulation parameter window.
As given in the question select drive cycle as FTP drive cycle, as shown below.
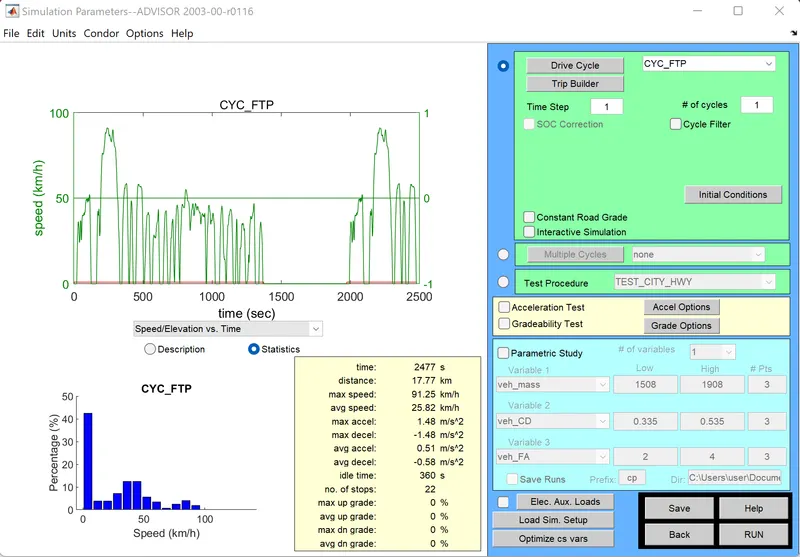
Click on run to see the simulation results as shown below.
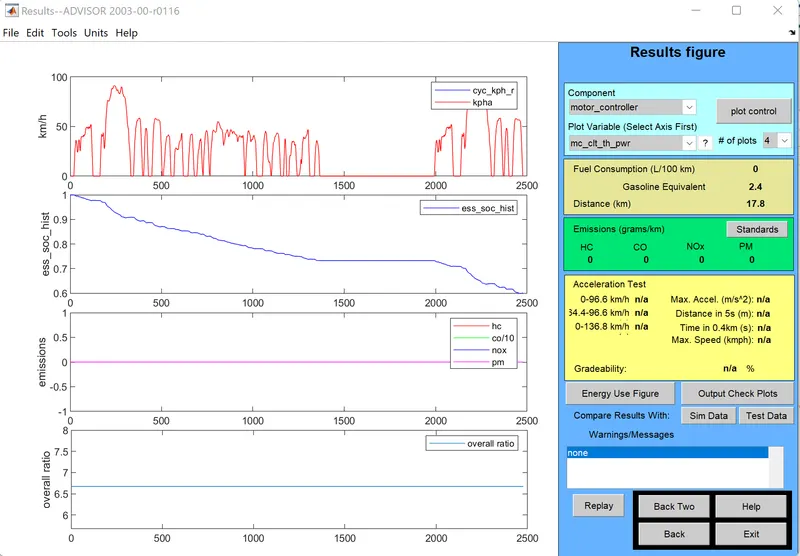
From the simulation results we can see the vehicel can travel for 17.8 km distance of 1 load cycle.
And we can observe that 40% of SOC is consumed for the distance travelled.
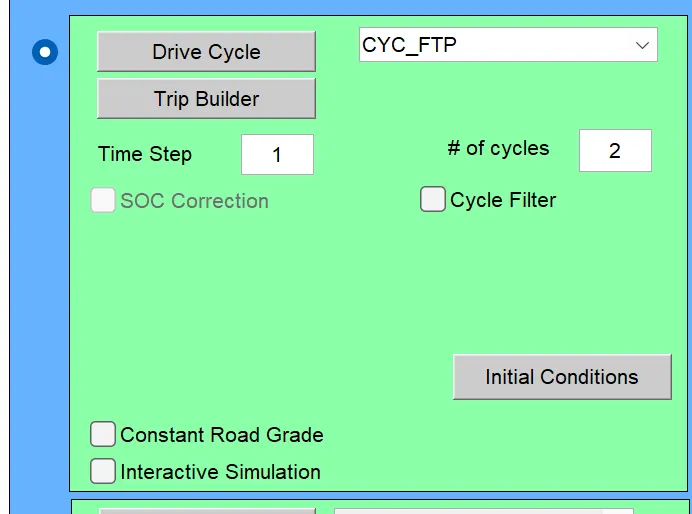
Now, to chnage the no. of load cycle, click on back to go to simulation parameter window and change the no of load cycles to 2 as shown below,
Again Click on Run to see simulation results as shown below,
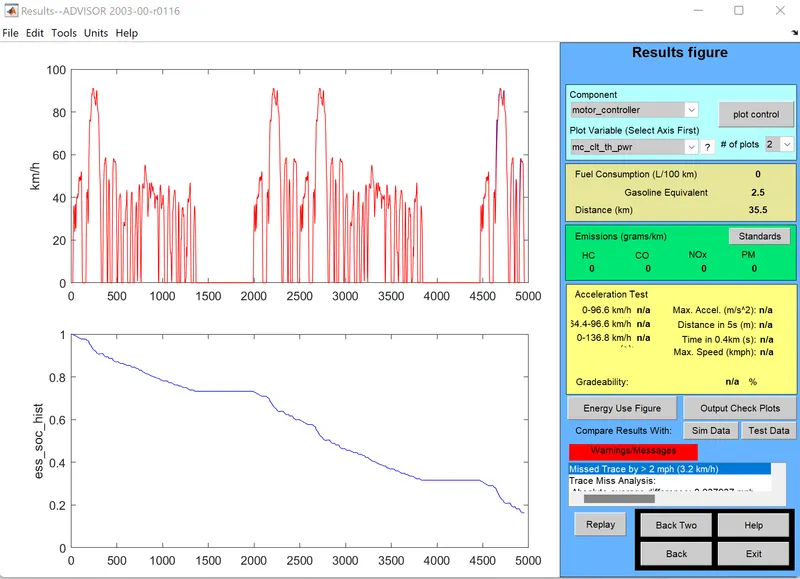
From the simulation results we can see the vehicel can travel for 35.5 km distance of 2 load cycles.
And we can observe that grater than 80% of SOC is consumed for the distance travelled.
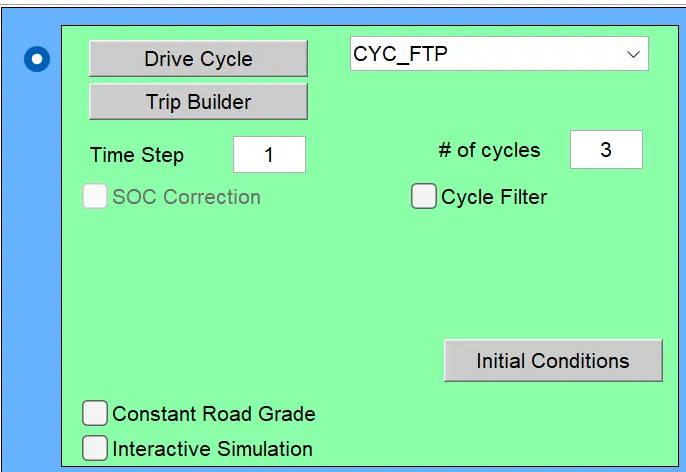
Now again change the No. of load cycles to 3 in the simulation parameter window as shown below,
Click on Run to see simulation results as shown below,
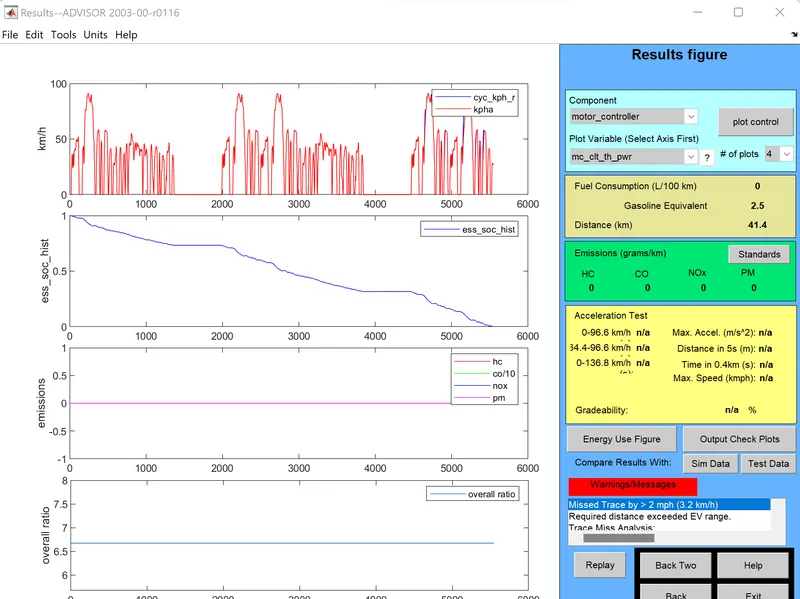
From the simulation results, we can observe that the vehicle travelled a distance of 41.4 km and the SOC of the battery is Zero.
So the vehicle can travel for 17.8 km distance inthe 1 st load cycle.
and 35.5 for 2 load cycles. Then in the 3 rd load cycle after travelling for 41.4 km distance, SOC become zero %.
So the vehicle can travel for 41.4 km distance with 100 % of SOC.
Conclusion: Hence the vehicel cannot travel for 45 km with FTP drive cycle due to Insufficient SOC.
2. In the above case, try changing the battery capacity and repeat the simulation.
Changing the storage capacity in the vehicle input window as shown below,
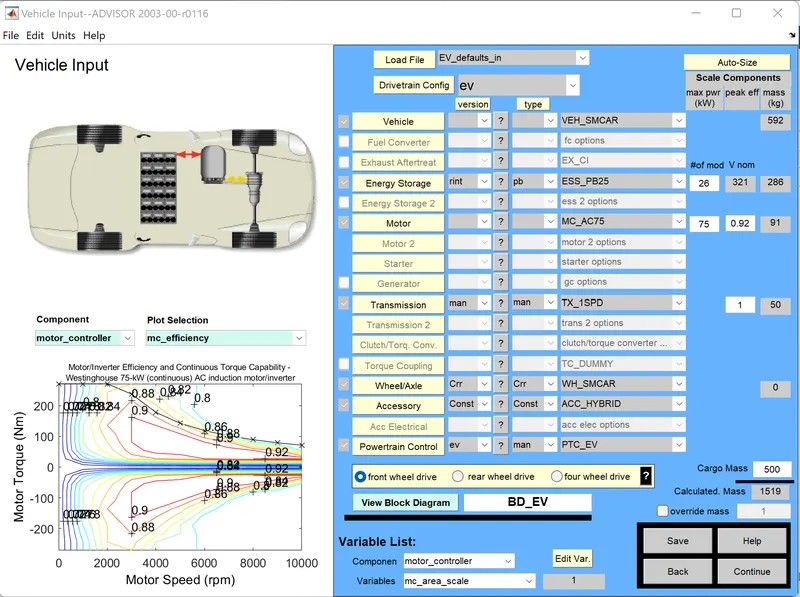
a.) For 26 modules the voltage 321v and mass is 286 kg. Click on continue will take us to simulation parameter window. Select drive cycle as Cyc-FTP. and select no. of drive cycles is 3, as with 2 drive cycles battery is not discharged completely so that vehicle can move further using drive cycle 3.
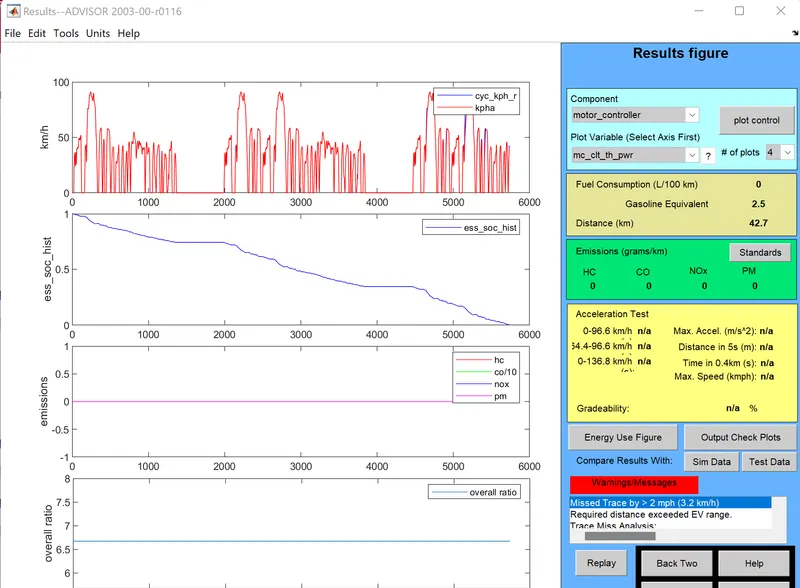
So the result is that the vehicel can travel only 42.7 km. as the battery SOC becomes Zero% at that stage as shown below.
b.) For 27 modules the voltage 333 v and mass is 297 kg as shown below,

Simulation results :
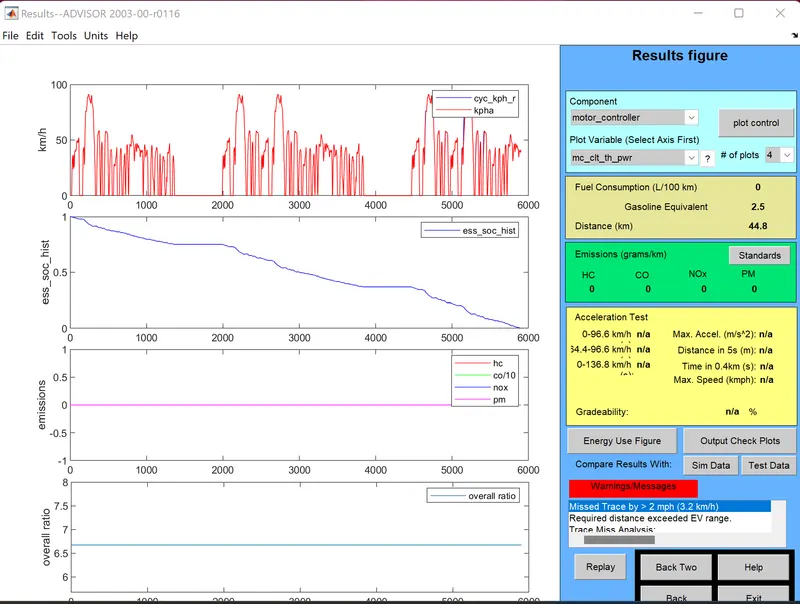
So the result is that the vehicel can travel only 44.8 km. as the battery SOC becomes Zero% at that stage as shown.
c.) For 28 modules the voltage 345 v and mass is 308 kg as shown below,

Simulation results :
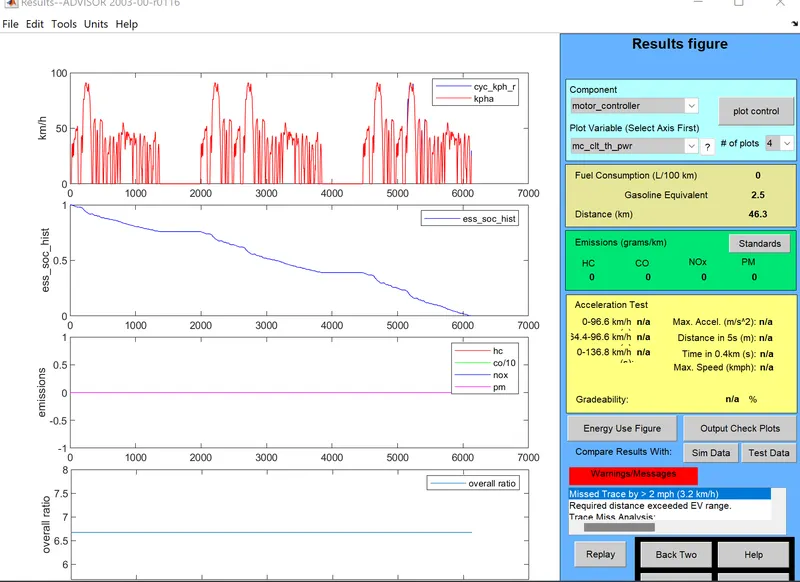
So the result is that the vehicel can travel only 46.3 km. as the battery SOC becomes Zero% at that stage as shown.
Conclusion: With storage capacity of 28 modules, 303 volts & 308 kg of mass battery will be suitable for the vehicle to travel 45 km with FTP drive cycle.
3. Perform gradeability test with PRIUS_Jpn_defaults_in file
Compare your results in table and conclude.
Open advisor tool in matlab command window and select load file as PRIUS_Jpn_defaults as shown below,
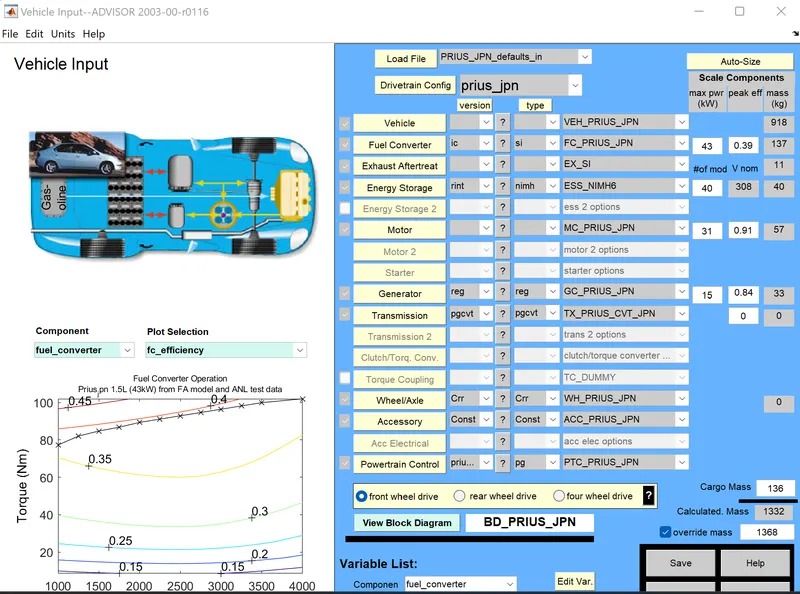
Consider default values for the Vehicel and click on run then it wiil open simulation window. select drive cycle as cyc-FTP and click on gradeability test then click on grade options. then we can see a small window will open with options as shown below,
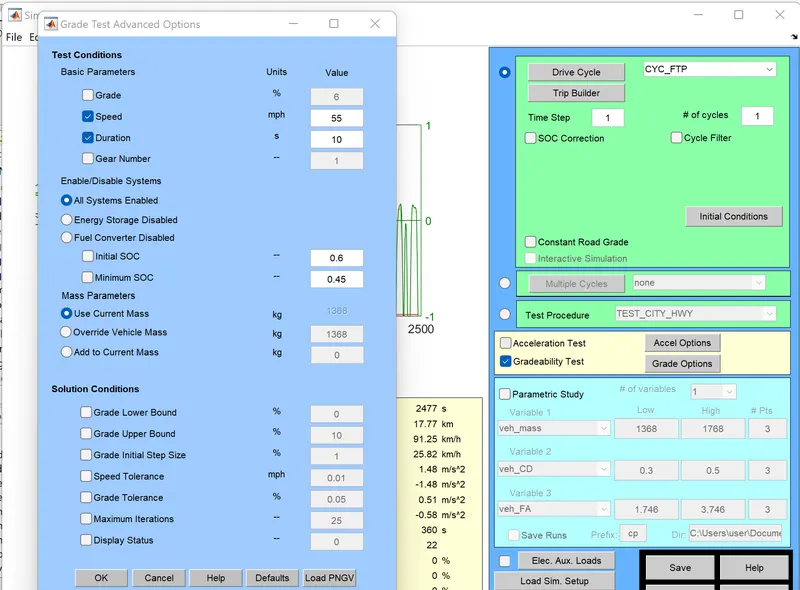
Now, Select the speed and duration and click okay and run the simulation for multiple values of speed and duration and observe the gradeability for each condition.
Example: consider Speed=55 mph or 88.5 kmph and time duration=10 sec
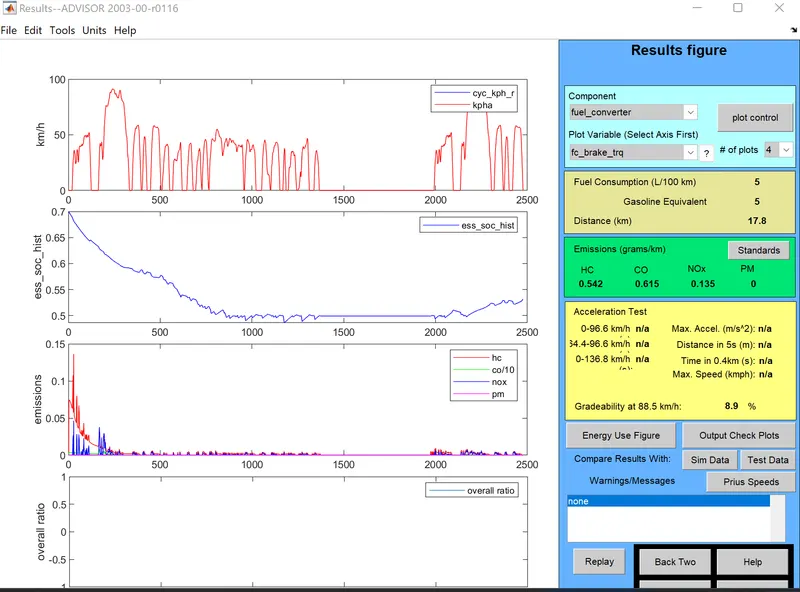
Greadability = 8.9 %
Similarly by comparison of Gradeability with different speeds with a time duration of 10 sec and 20 sec is shown in the comparision table below.
| Sl. No. | Speed in mph | Speed in kmph | Gradeability of time duration of 10 sec | Gradeability of time duration of 20 sec |
| 1 | 55 | 88.5 | 8.9 % | 11.5 % |
| 2 | 65 | 104.6 | 7.2 % | 9.5 % |
| 3 | 75 | 120.7 | 5.3 % | 7.2 % |
| 4 | 85 | 136.8 | 3.6 % | 5.3 % |
| 5 | 95 | 152.9 | 2.0 % | 3.6 % |
Conclusion: From the above comparision table, it is observed that as the speed increases, the percentage of gradeability reduces. And this is true for the time durations of 10 sec and 20 sec as shown in ythe comparision table.