Week-4 Challenge WOT Condition Part-2
1) What is the difference between mapped and dynamic model of engine, motor and generator? How can you change model type?
Difference between Mapped and Dynamic model are as follows:
| Mapped Model | Dynamic Model |
|
Uses set of steady state lookup tables to characterisize the engine performance. |
Model converts the engine behavior into engine characteristics that are seperated into lower level components. |
| Engine: Tables provide overall engine characteristics, including the torque, fuel flow rate and engine exhaust emmision. | Engine: Dynamic blocks will have the required inputs like torque, engine speed etc.. |
|
Motor/Generator: It is a macro motor behavior set of lookup tables such as battery voltage, motor torque and speed. Here the results are quick but not much accurate. |
Motor/Generator: It contains the internal Permanent Magnet Synchronous Machine(PMSM), 3phase voltage inverter and also the PM controller. Here the results are delayed compared to mapped model but the outputs are accurate. |
Example of Mapped and Dynamic Ev Engine are shown below:
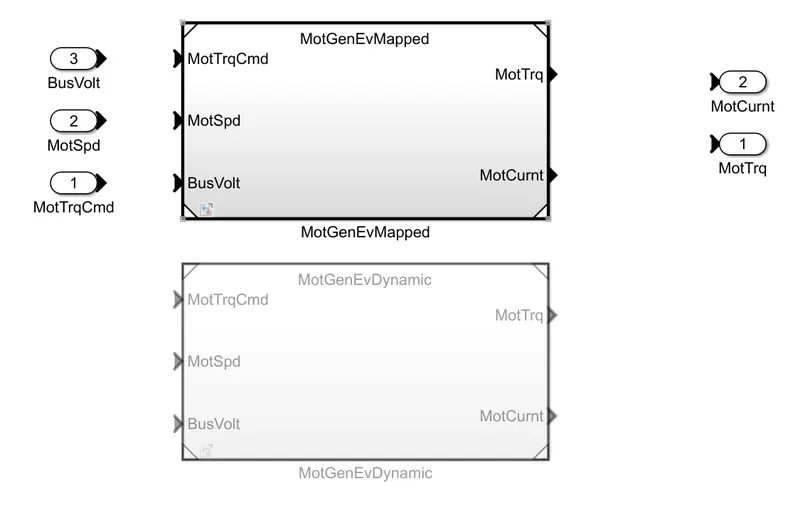
To change the model type one should follow the below steps:
- Go to the Modelling option and select for model explorer.
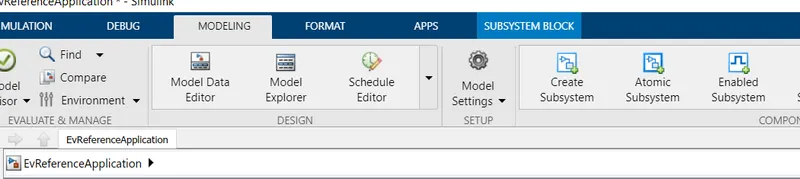
- Under the model select for Passanger car followed by the Electric plant/Engine block set as per the model.
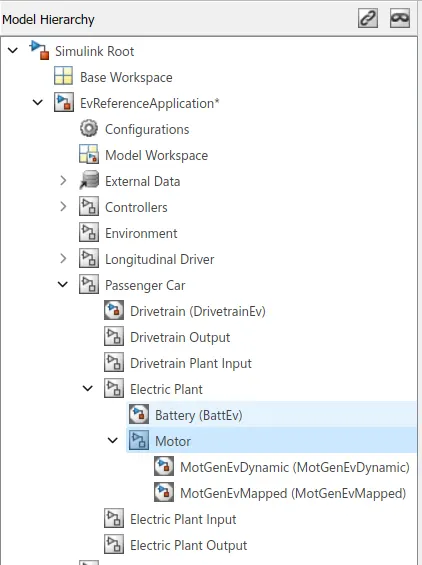
- On right bottom corner under label mode active choice we can select the model type(Dynamic OR Mapped).

2) How does the model calculate miles per gallon? Which factors are considered to model fuel flow?
Miles Per gallon is the value in which the fuel economy of the vehicle is expressed.
Let us discuss how it is calculated with a model.
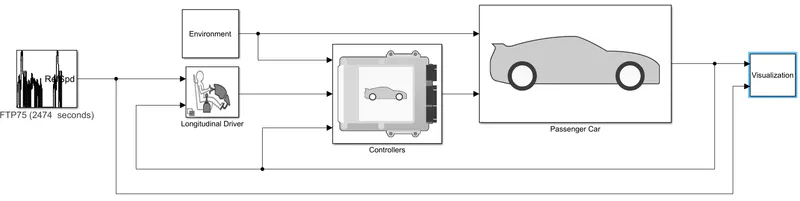
we can see a visualization block and inside there is a performance calculation block which calculates the MPG
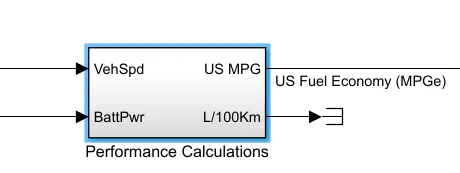
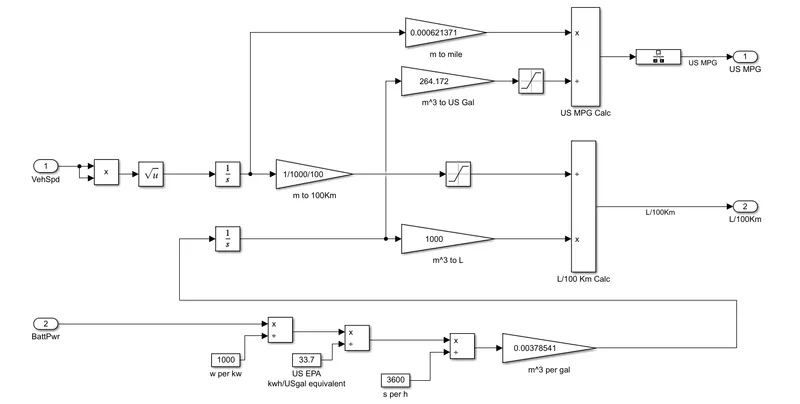
in the above simulink model we can see the steps for the calculation of the MPG.
Note:
1 Gallon= 33.7Kwh of energy in electric vehicles
264.172 US Gallons= 1000L
- MPG is different from MPGe, MPGe means miles per gallon equivalent.
- So as we know the energy used in hybrid vehicle is of battery power and fuel, both needs to be added and to do so both the values must be in same units.
- In the above block we can see the battery power is divided by 1000, it is to convert the Kw into W.
- Next the battery power is divided by factor 33.7(US EPA gal equivalent) as the power used by battery is in MPGe.
- To convert the output into Ws from Wh we divide it by 3600 and then it is converted into m³/gal
- Now the vehicle speed is multiplied by itslef and then squre rooted. The obtained value is integrated and later converted into miles in m to miles block.
- The obtained value is divided with gallon to get the MPG.
Factors to be considered:
* Vehicle speed and battery power are the main source of the MPGe.
3) Run the HEV ReferenceApplication with WOT drive cycle. Change the grade and wind velocity in the environment block. Comment on the results.
The diagram shows the Power trian configuration.
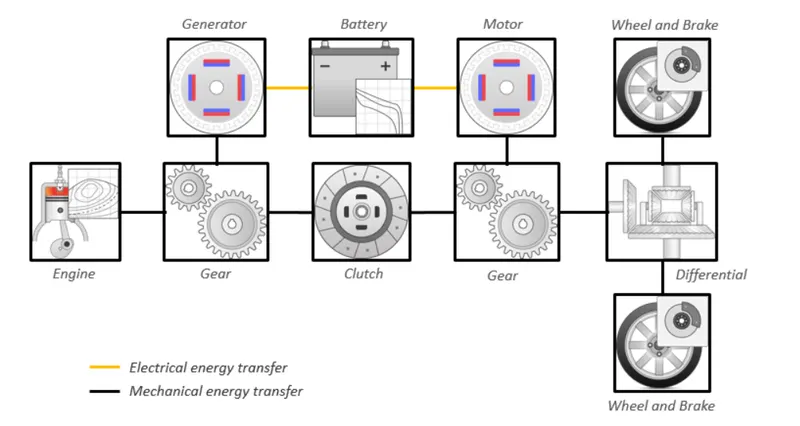
The hybrid electric vehicle reference application represents a full multimode hybrid electric vehicle (HEV) model with an internal combustion engine, transmission, battery, motor, generator, and associated powertrain control algorithms.
HV reference application model:
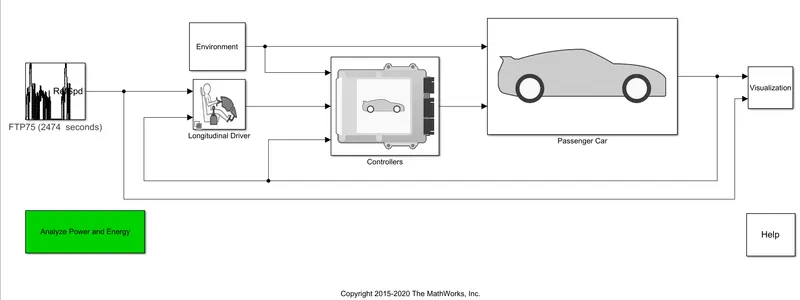
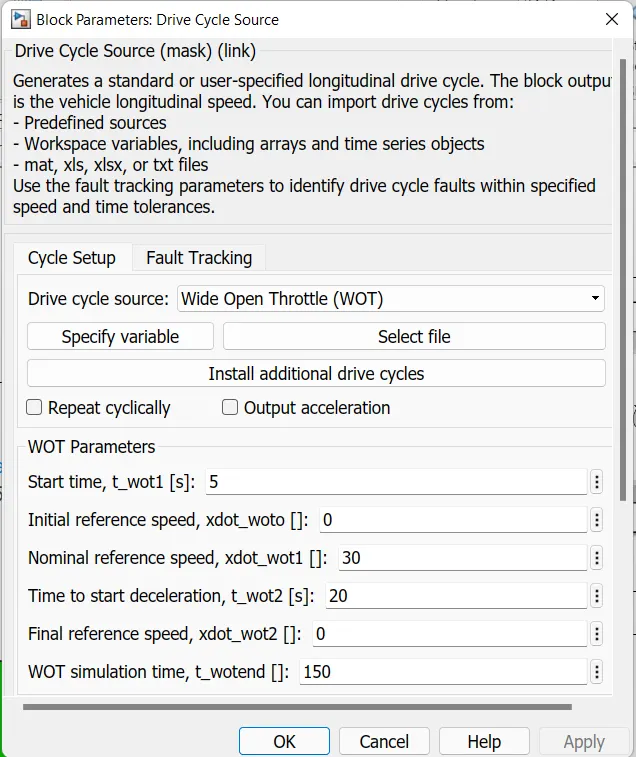
As per given let us run the model with WOT drive cycle and let the simulation time be 150s
Result:
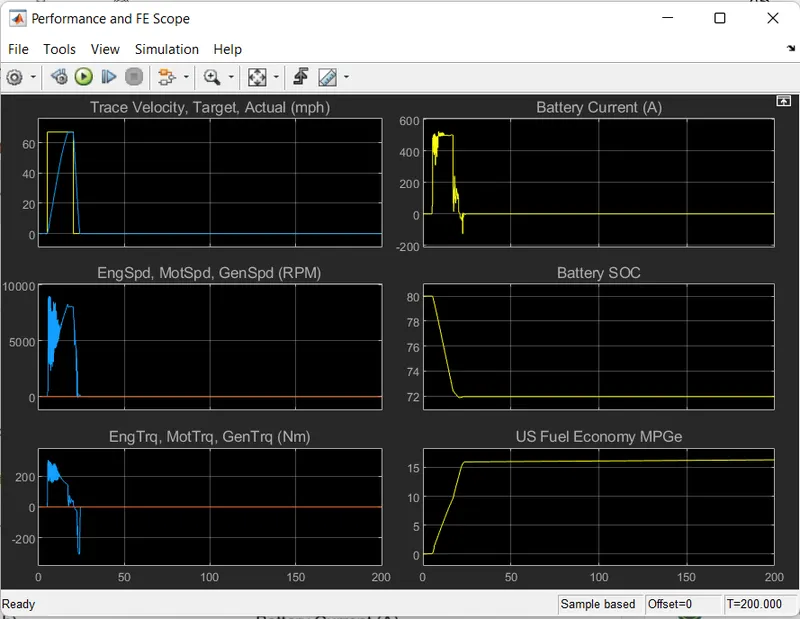
- We can see the increase in current upto 500 and after 18sec it starts decreasing. Current increases slight in between, goes negative and remains constant after 25sec.
- Battery SOC is dropped to 72 with slight increase later and remains constant.
- The fuel economy is increased to 16.
- Engine torque increases upto 275 and after 20seconds goes negative.
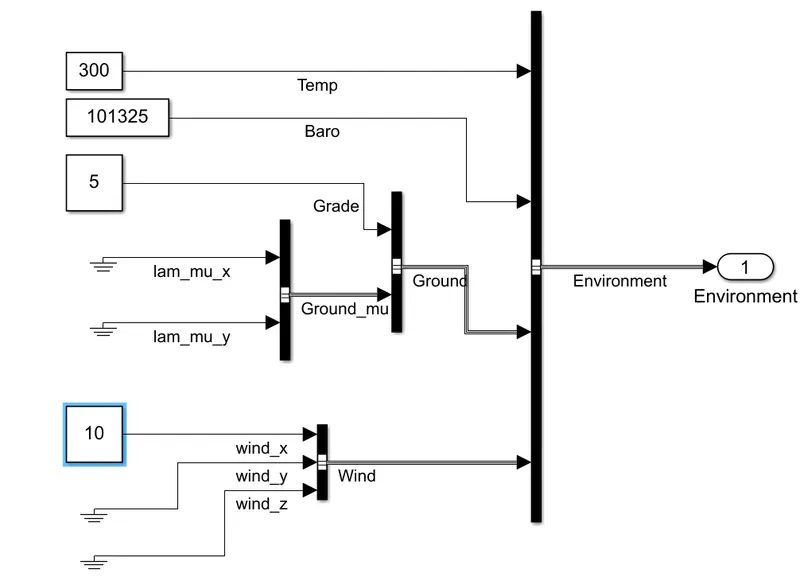
Now let us change the grade value to 5 and wind velocity to 10 in environment block.
Result:
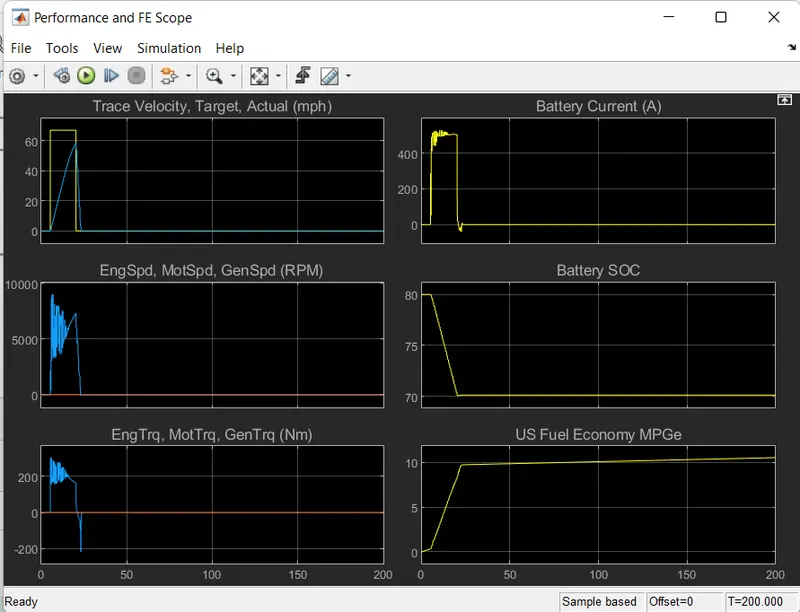
When we compare the obtained result with the previous result we have the following observation:
- Battery current remains same when compared with the previous result.
- Battery SOC is decreased to 70 from 72. It is because of the wind velocity and grade value, the vehicle requires more power
- As we can see the fuel econmomy is reduced to 10, it is very less compared to previous one.
4) Keeping all other parameters same, compare the simulated results of hybrid and pure electric powertrains.
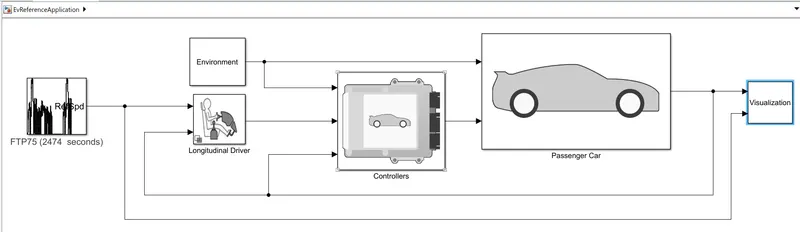
* Open the EVreference application:
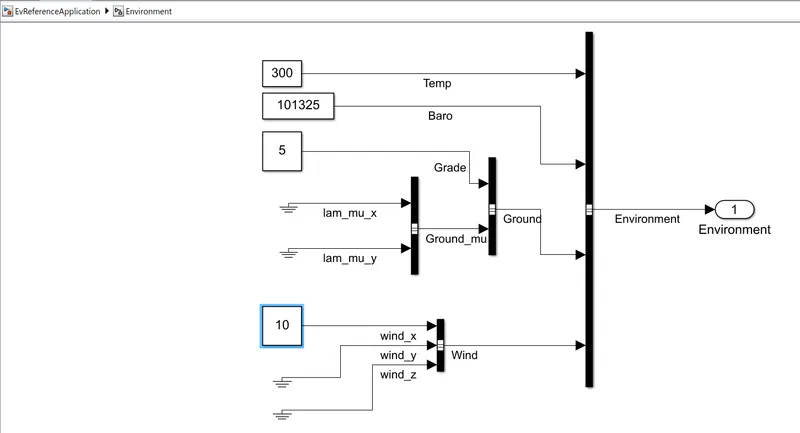
let us change the grade to 5 and wind velocity value to 10 in the environment block
Result:
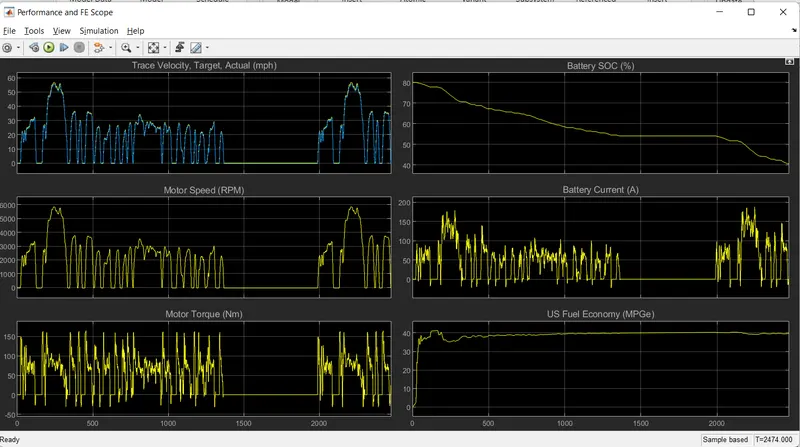
Observation:
- Battery SOC falls from 80 to 40.
- Battery current has a rapid increase and decrease from 0 to 180.
- Fuel economy also has a rapid variation.It increases upto 41, later has a slight decrease and remains almost constant after 1000seconds.
*Now let us open HEVreference apllication:
Result:
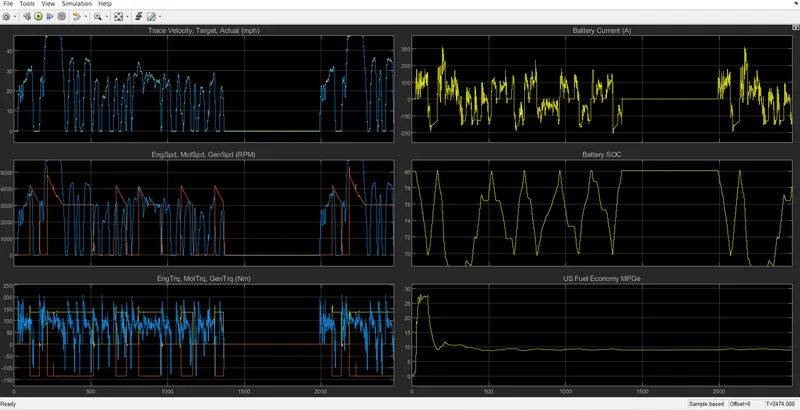
Observation:
- Here we can see rapid variation in battery current.
- Secondly when we look at battery SOC, there is decrease and increase through out the cycle. We can see that the battery is getting charged for sometime inbetween and continuous through the drive cycle. Charging happens during deceleration.
- When we look at fuel economy it increases to 28 and maintains constant value almost. we can say the fuel economy is almost constant after 500seconds.