Week-3 Challenge: ADVISOR Tool
1) For EV_defaults_in file, if cargo mass is 500 kg with all other default conditions, can the vehicle travel for 45 km with FTP drive cycle? Conclude your observations.
ADVISOR Tool:
- Advanced Vehicle Simulator tool created by NREL(National Renewable Energy Laboratory) is uses a backward flow i.e drive cycle to energy storage.
- It is based on the scripts & m.files and lookup tables are used, no built in MATLAB models.
- It helps to understand the vehicle performance, analysis of user defined drivetrain components and related data.
- It is a real world data fitted into systems.
- Estimates the fuel economy of vehicles that are yet to be built.
- Evaluate the energy management strategy for hybrid vehicle fuel converter.
In Advisor Tool we can see 3 windows:
- Vehicle input window.
- Simulation parameter window.
- Result window.
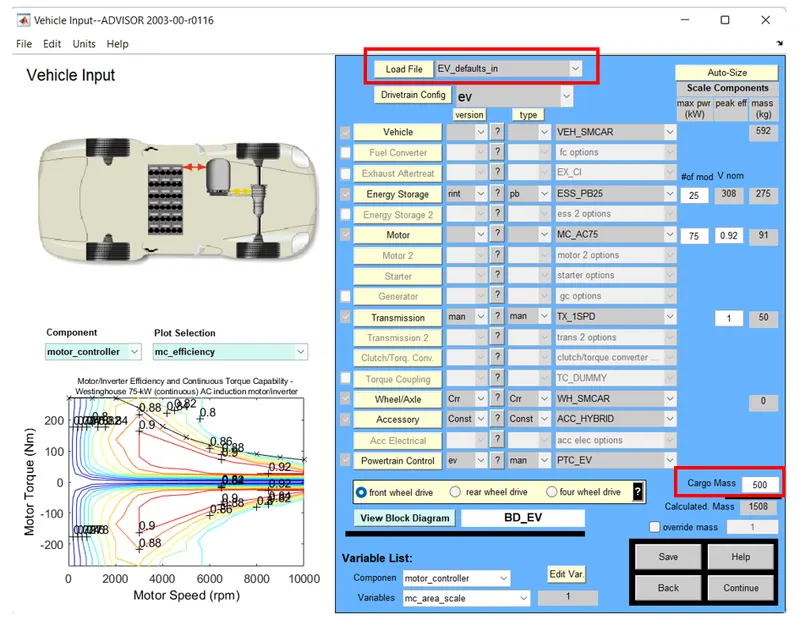
Load file is EV_defaults_in and Cargo mass: 500
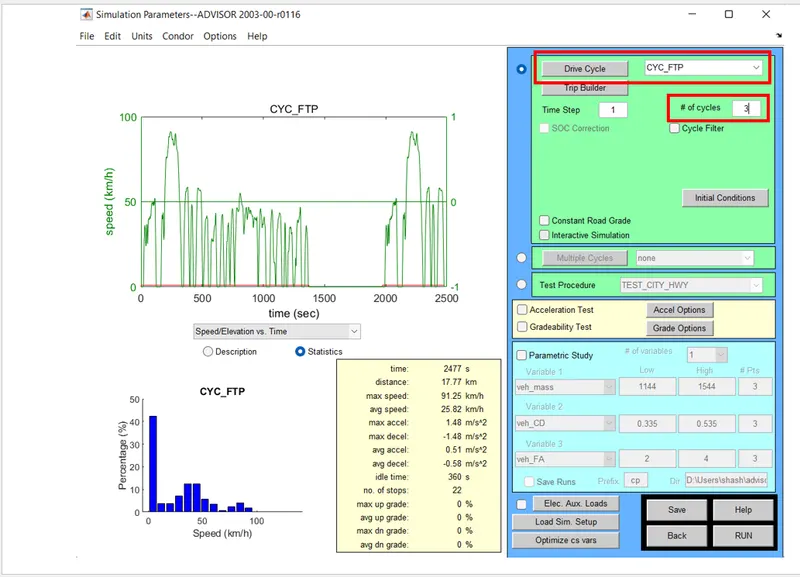
Drive cycle: CYC_FTP and NO.OF.CYCLES: 3
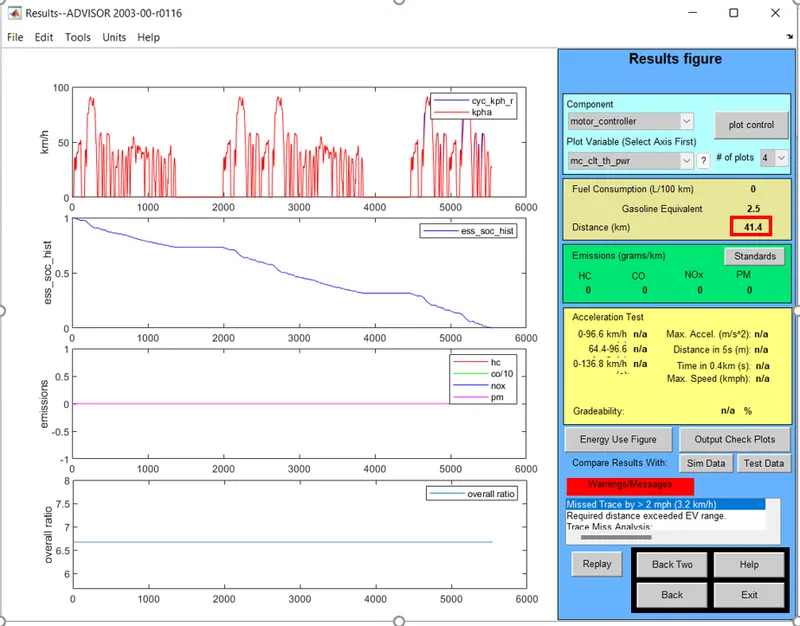
Conclusion:
As we can see in the result, distance travelled for 3 number of cycles is 41.4km. The battery SOC is 100% used for 3 no.of drive cycle. Hence the EV_defaults_in cannot travel 45km in any drive cycle.
2) In the above case, try changing the battery capacity and repeat the simulation.
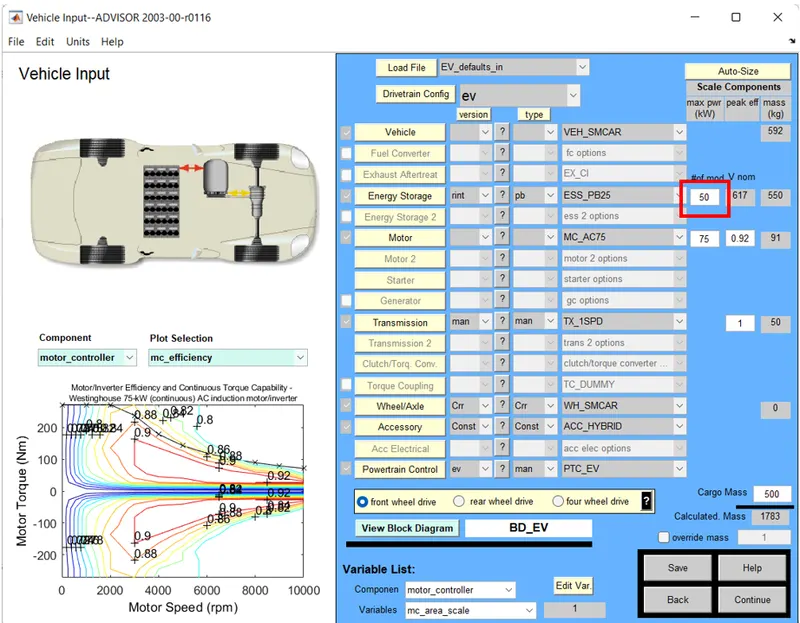
In the above model the battery capacity is changed from 25modules to 50 modules.
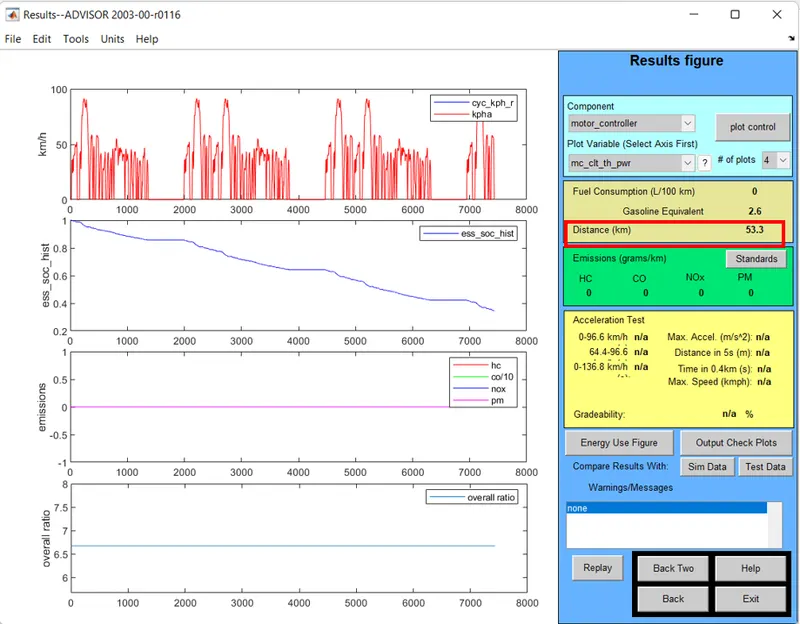
as a result we can see that the vehicle runs for 53.3km for same number of cycles with increase in battery capacity.
3) Perform gradeability test with PRIUS_Jpn_defaults_in file
Compare your results in table and conclude.
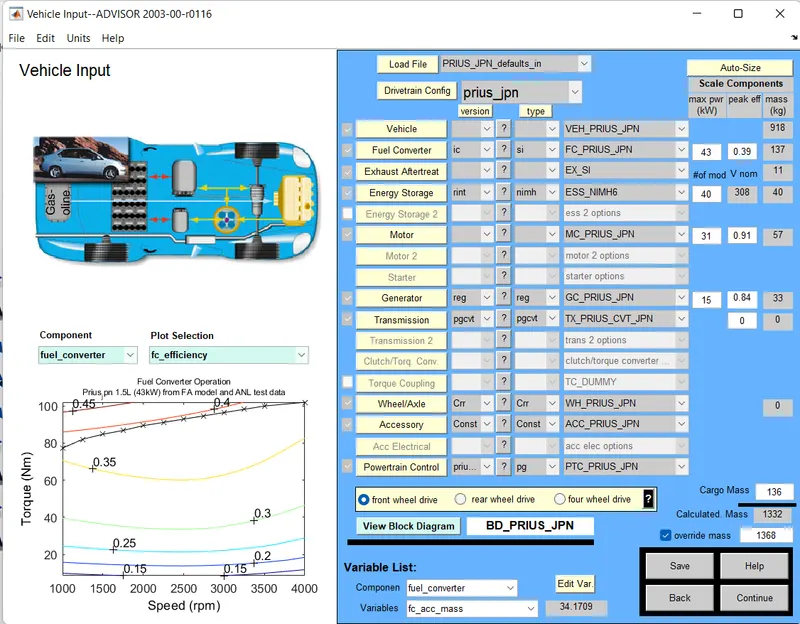
Let us load the PRIUS_Jpn_defaults_in
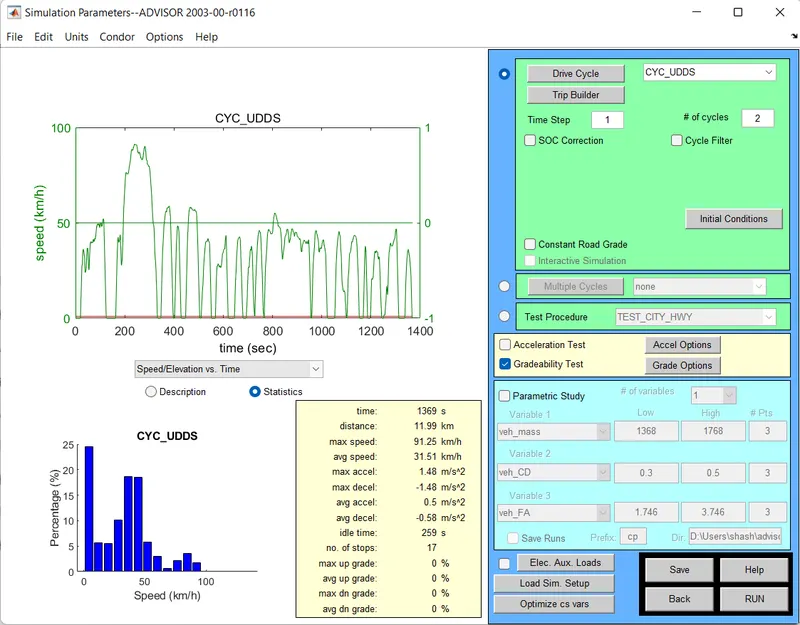
Let us select for Gradeability test in Simulation parameter window.
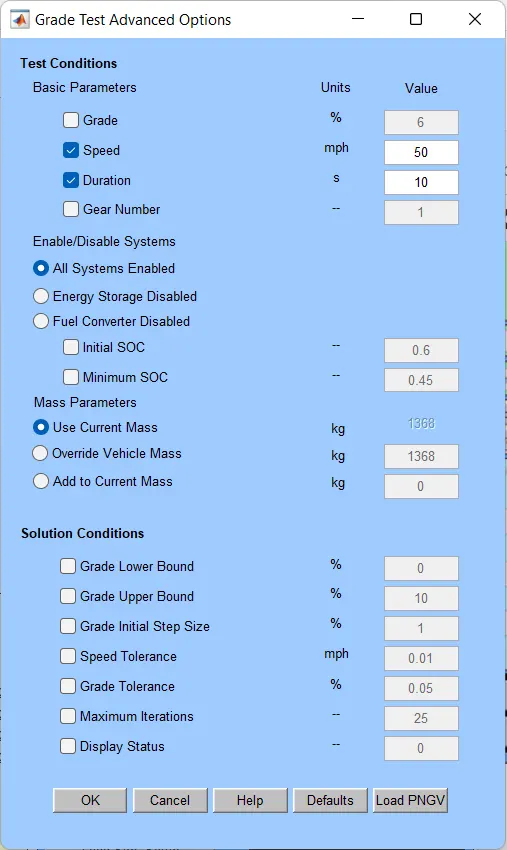
Speed is changed to 50mph0 with duration of 10s.
Enabling All systems let us run the model.
Result for 10seconds duration
Speed: 50mph = 80kmph
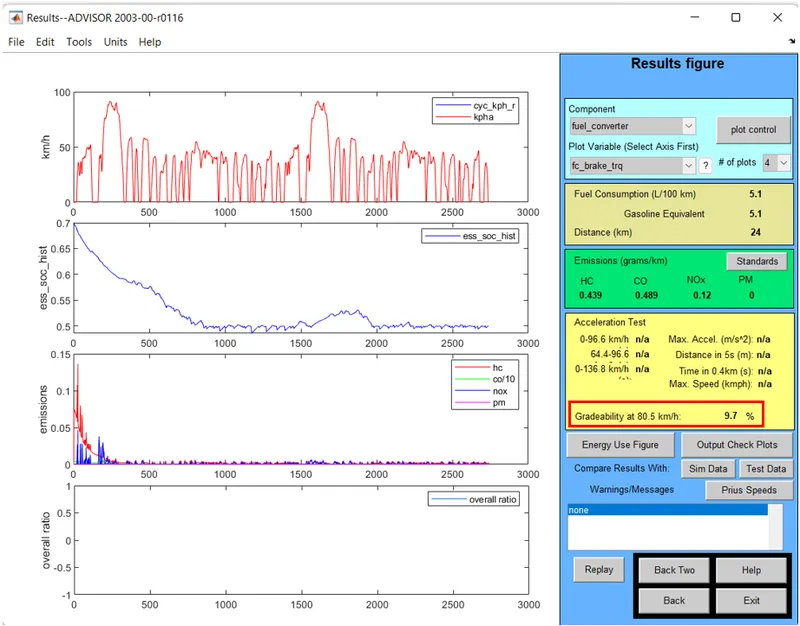
Gradeability obtained is 9.7%
Speed: 55mph = 88kmph
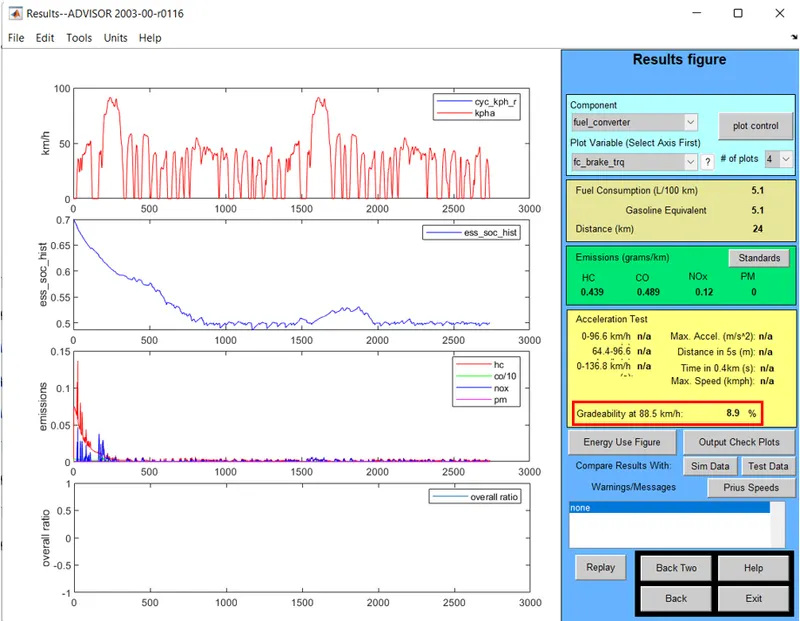
Gradeability obtained is 8.9%
here we can see that the gradeability is reduced with increase in speed.
Let us change the speed for 40mph = 64kmph
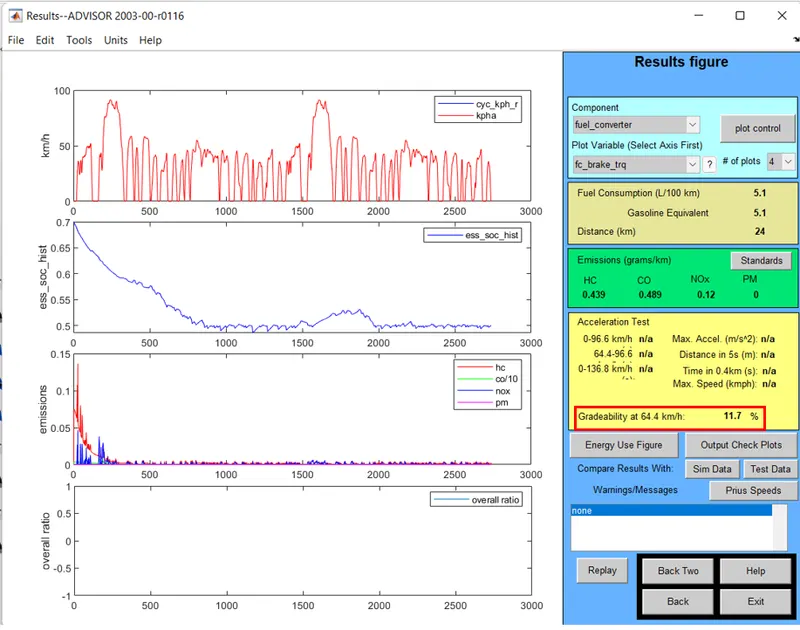
Gradeability obtained is 11.7%
Here the Gradeability is increased from 8.9% to 11.7% with decrease in speed value.
| SR. NO | Speed mph | Speed kmph | Gradeability(%) |
| 1 | 50 | 80 | 9.7 |
| 2 | 55 | 88 | 8.9 |
| 3 | 40 | 64 | 11.7 |
Conclusion: The Gradeability is inversely proportional to vehicle speed i.e as the vehicle speed increases gradeability decreases and vice-versa